


1. Introduction
High-peak-power mid-infrared (mid-IR) laser sources are attractive for many applications, such as ultrafast spectroscopy, material processing and nonlinear frequency down-conversion[ Reference Ma, Qin, Xie, Qian and Tang 1 – Reference Nejadmalayeri and Herman 4 ]. A mid-IR picosecond laser with a μJ-level pulse energy can be applied to polymer processing due to the strong resonance absorption, resulting in a multifold increase in processing efficiency[ Reference Frayssinous, Fortin, Bérubé, Fraser and Vallée 5 – Reference Jobin, Paradis, Aydin, Boilard, Fortin, Gauthier, Lemieux-Tanguay, Magnan-Saucier, Michaud, Mondor, Pleau, Talbot, Bernier and Vallee 7 ]. A high-peak-power mid-IR femtosecond laser can generate a longer-wavelength mid-IR coherent source via intra-pulse difference-frequency generation or an optical parametric oscillator[ Reference Zhang, Fritsch, Wang, Krausz, Mak and Pronin 8 , Reference Shiner, Trallero-Herrero, Kajumba, Bandulet, Comtois, Legare, Giguere, Kieffer, Corkum and Villeneuve 9 ]. Since the cut-off photon energy of high harmonic generation (HHG) is proportional to the square of the driving laser wavelength, a mid-IR laser also allows for the extension of HHG to the shorter-wavelength X-ray range[ Reference Chen, Mancuso, Hernandez-Garcia, Dollar, Galloway, Popmintchev, Huang, Walker, Plaja, Jaron-Becker, Becker, Murnane, Kapteyn and Popmintchev 10 , Reference Koc, Hauf, Woerner, von Grafenstein, Ueberschaer, Bock, Griebner and Elsaesser 11 ].
At present, Er-doped fluoride fiber lasers have become a common way to generate 2.8 μm lasers due to their high efficiency, excellent beam quality and compact structure[ Reference Haboucha, Fortin, Bernier, Genest, Messaddeq and Vallee 12 – Reference Tang, Qin, Liu, Zhao, Xie, Wen and Qian 15 ]. With the nonlinear polarization rotation (NPR) mode-locking technique, 10 kW-level peak power is available in the fiber oscillator[ Reference Duval, Bernier, Fortin, Genest, Piché and Vallée 16 – Reference Qin, Xie, Gu, Hai, Yuan, Ma and Qian 18 ]. Higher-peak-power pulses, however, are difficult to generate from a mode-locked oscillator since pulse splitting will occur at high peak power in the fiber[ Reference Huang, Pang, Jiang, He and Russell 19 ]. For scaling of peak power and pulse energy, several works on direct femtosecond pulse amplification accompanied with soliton self-compression[ Reference Huang, Pang, Jiang, Köttig, Schade, He, Butryn and Russell 20 – Reference Yu, Liang, Huang, Wang, Wang, Luo, Yan, Dong, Liu, Lue, Guo and Ruan 24 ] or soliton self-frequency shift (SSFS)[ Reference Duval, Gauthier, Robichaud, Paradis, Olivier, Fortin, Bernier, Piche and Vallee 25 – Reference Gauthier, Olivier, Paradis, Dumas, Bernier and Vallée 28 ] have been reported. Sub-two-cycle pulses with a peak power of approximately 500 kW have been realized through an Er-doped fluoride fiber amplifier and subsequent soliton self-compression[ Reference Huang, Pang, Jiang, Köttig, Schade, He, Butryn and Russell 20 ]. Simultaneous amplification and soliton self-compression in Er:ZBLAN fluoride fiber has been investigated, achieving a peak power of 2 MW and pulse energy of 101 nJ at 2.8 μm[ Reference Zhou, Qin, Yuan, Ma and Xie 21 ]. Compared to soliton self-compression, SSFS allows for broad spectral tunability in the mid-IR region. Duval et al. [ Reference Duval, Gauthier, Robichaud, Paradis, Olivier, Fortin, Bernier, Piche and Vallee 25 ] reported on the generation of tunable soliton pulses from 2.8 to 3.6 μm with a maximum peak power of 200 kW via SSFS in a zirconium-based fluoride fiber. The wavelength tunable region is mainly limited by the transparency range of the fluoride fiber. Using an indium-based fluoride fiber with a longer cut-off wavelength, up to 4.3 μm solitons have also been achieved[ Reference Tang, Wright, Charan, Wang, Xu and Wise 26 ]. In addition, a fiber chirped pulse amplification (CPA) system, seeded by an optical parametric chirped pulse amplification (OPCPA) system, was reported, which amplified the pulses from 12.4 to 84 μJ using an Er:ZBLAN fiber; however, the chirped pulses were not compressed[ Reference Wan, Yang, Bai and Liu 29 ].
In this work, we demonstrated a grating-free fiber CPA system seeded with fluoride fiber ultrashort pulse sources. High-energy picosecond pulses of 2.07 μJ were generated at the repetition rate of 100 kHz. After compression with highly dispersive Ge rods, the shortest pulse of 408 fs was obtained. With ZBLAN fiber as the stretcher and Ge rods as the compressor, the fiber CPA system was realized with a compact grating-free structure. In addition, the spectral broadening phenomenon of chirped pulses was observed in the amplifier, which was explained by the numerical simulations.
2 Numerical simulation
The pulse evolution in the fiber amplifier was simulated with the modified nonlinear Schrödinger equation (NLSE) to better understand this process and optimize the experiment. Considering the gain saturation effect, the population density distributions on the Er3+ Stark levels are different for laser pulse operation and spontaneous emission, which cause different gain profiles. Therefore, the rate equations should be introduced to simulate the gain profile in real pulsed laser operation. The modified NLSE can be expressed as follows[ Reference Agrawal 30 ]:
 $$\begin{align}\frac{\partial U}{\partial z}-\sum \limits_{ij}{{g}}^{{\kern1.2pt}ij}\frac{U}{2}+i\frac{\beta_2}{2}\frac{\partial^2U}{\partial {t}^2}-\frac{\beta_3}{6}\frac{\partial^3U}{\partial {t}^3}= i\gamma U{\left|U\right|}^2,\end{align}$$
where U represents the pulse electric field (not the slowly varying envelope); β n is the nth-order dispersion coefficient; γ represents the Kerr nonlinear coefficient. Considering the Stark levels, the gain function g ij is rewritten as follows:
 $$\begin{align}{g}^{ij}\left(\nu \right)=\left({\sigma}_\mathrm{e}^{ij}{r}_2^{{\kern1.2pt}i}{N}_2-{\sigma}_\mathrm{a}^{ij}{r}_1^{{\kern1.2pt}j}{N}_1\right){f}^{{\kern1.2pt}ij}\left(\nu \right),\end{align}$$
where N 2 and N 1 represent the population densities of the upper and lower laser levels (4I11/2 and 4I13/2), respectively, and r 2 i and r 1 j represent the proportions of their Stark levels. The probability coefficient f ij (ν) is of Lorentz type [1 + 4(v – v 0 ij )2/(Δv ij )2]–1, where v 0 ij and Δv ij are the transition central frequency and the corresponding frequency width, respectively. The values of v 0 ij and Δv ij are given by Huang et al.[ Reference Huang, Mortier and Auzel 31 ]. The σ e ij and σ a ij are the intrinsic emission and absorption cross-sections among the Stark levels[ Reference Huang, Mortier and Auzel 31 , Reference Wang, Cheng, Zhong, Sun, Tian, Zhang and Chen 32 ]. The proportions of the Stark levels (r 2 i and r 1 j ) were obtained by an iteration code. While the pulse passes, r 2 i and r 1 j abruptly change and then slowly recover toward Boltzmann distribution. When reaching a stable state, both r 2 i and r 1 j should recover to the same values before each pulse reaches them.
The population densities N 2 and N 1 were obtained by solving the laser rate equations:
 $$\begin{align}\frac{\mathrm{d}N_5}{\mathrm{d}t}&=-\frac{N_5}{\tau_5}+{W}_{22}{N}_2^2-{W}_{50}{N}_5{N}_0+{W}_{42}{N}_4{N}_2+{R}_{\mathrm{ESA}},\nonumber\\ \frac{\mathrm{d}N_4}{\mathrm{d}t}&=-\frac{N_4}{\tau_4}+{\beta}_{54}\frac{N_5}{\tau_5}-{W}_{42}{N}_4{N}_2,\nonumber\\ \frac{\mathrm{d}N_3}{\mathrm{d}t}&=-\frac{N_3}{\tau_3}+{\beta}_{53}\frac{N_5}{\tau_5}+{\beta}_{43}\frac{N_4}{\tau_4}+{W}_{11}{N}_1^2+{W}_{50}{N}_5{N}_0,\nonumber\\ \frac{\mathrm{d}N_2}{\mathrm{d}t}&=-\frac{N_2}{\tau_2}+\sum \limits_{i=3}^5{\beta}_{i2}\frac{N_i}{\tau_i}-2{W}_{22}{N}_2^2-{W}_{42}{N}_4{N}_2\nonumber\\&\quad+{R}_{\mathrm{GSA}}-{R}_{\mathrm{ESA}}-{R}_{\mathrm{ASE}}-{R}_{\mathrm{SE}},\nonumber\\ \frac{\mathrm{d}N_1}{\mathrm{d}t}&=-\frac{N_1}{\tau_1}+\sum \limits_{i=2}^5{\beta}_{i1}\frac{N_i}{\tau_i}-2{W}_{11}{N}_1^2+{W}_{50}{N}_5{N}_0+{W}_{42}{N}_4{N}_2\nonumber\\&\quad+{R}_{\mathrm{ASE}}+{R}_{\mathrm{SE}},\end{align}$$
where N 1–N 4 represent respectively the population densities of the energy levels 4I13/2, 4I11/2, 4I9/2, 4F9/2. The energy levels 4F7/2, 4H11/2 and 4S3/2 are considered as one thermal-coupled level[ Reference Pollnau, Graf, Balmer, Luthy and Weber 33 ], and N 5 represents its population density. Here, τ i represents the lifetime of level i and β ij represents the branching ratio for decay from level i to level j; W 11, W 22, W 50 and W 42 are the parameters for different energy conversions; R GSA and R ESA represent the pump rates of ground-state absorption (GSA) and excited-state absorption (ESA), respectively; R ASE and R SE represent the rate for amplified spontaneous emission (ASE) and the rate for stimulated emission, respectively. The simulation results were obtained by numerically solving the NLSE and rate equations. The parameters for simulating the NLSE and rate equations were the same as the experimental parameters, except for τ i , β ij , W 11, W 22, W 50 and W 42 from Li and Jackson[ Reference Li and Jackson 34 ] and Henderson-Sapir et al.[ Reference Henderson-Sapir, Munch and Ottaway 35 ].
3 Experimental setup
The schematic of the fiber CPA system is shown in Figure 1. The system was seeded by femtosecond pulses at 2.8 μm with pulse duration of 66 fs and pulse energy of less than 1 nJ at 100 kHz[ Reference Zhou, Qin, Yuan, Ma and Xie 21 ]. A 17.5 m 7% (molar fraction) Er:ZBLAN fiber (Le Verre Fluoré) was employed as the pulse stretcher and the pre-amplifier (L = 1 m). A cladding-mode stripper was used to block the pump power and suppress the ASE. The fiber core had a diameter of 15 μm and a numerical aperture (NA) of 0.12, which was surrounded by 240 μm × 260 μm cladding (NA ≈ 0.5). The pre-amplifier was pumped by a 976 nm laser diode pigtailed to an output fiber of 105 μm (NA = 0.22). After the pre-amplifier, a polarization-dependent isolator was inserted to suppress the ASE.
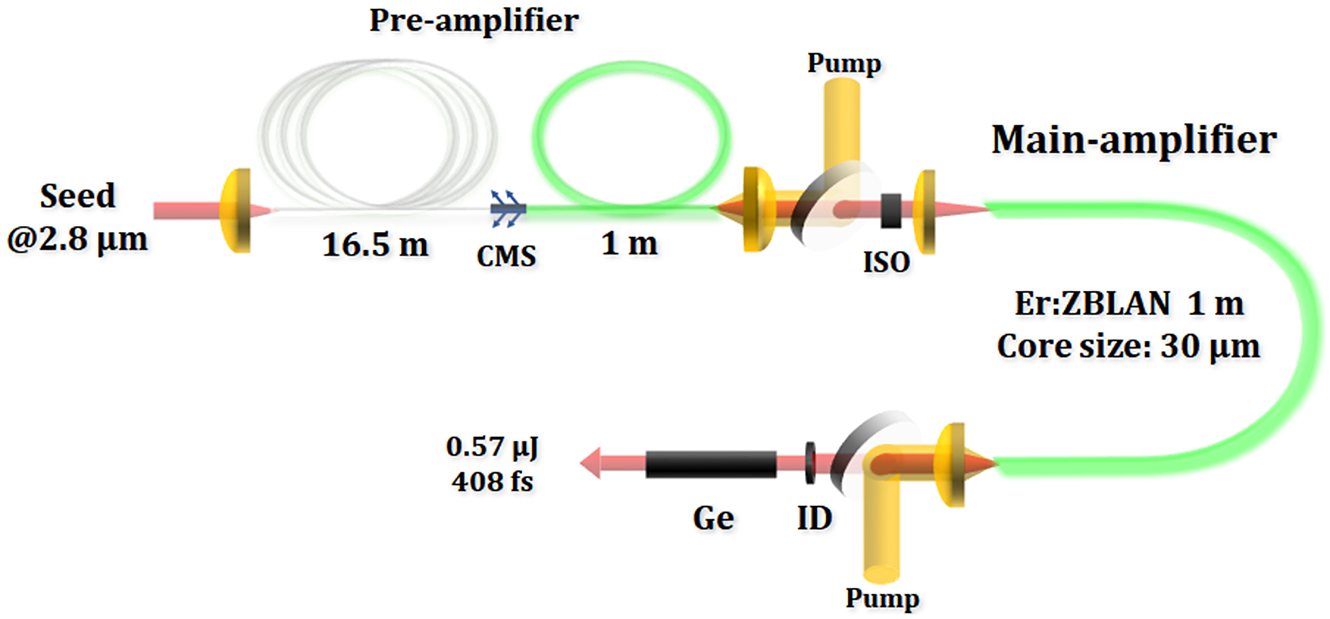
Figure 1 Schematic of the 2.8 μm fiber CPA system. CMS, cladding-mode stripper; ISO, optical isolator; ID, iris diaphragm; Ge, germanium.
A 30 μm-core-diameter Er:ZBLAN fiber (Fiberlabs) was employed as the gain medium in the main amplifier. It had a length of 1.0 m and core NA of approximately 0.12. The cladding diameter was 300 μm with an NA of approximately 0.5. A larger core diameter was selected to reduce the accumulation of nonlinear phase shift and avoid damage to the fiber output facet. The fiber was coiled with a radius of approximately 15 cm to suppress high-order transverse modes. In addition, an iris diaphragm was employed to filter out the high-order transverse mode. The pump source was the same as in the pre-amplifier. The amplified chirped pulses were compressed by highly dispersive Ge rods. After the compressor, the output spectrum was measured by a mid-IR spectrometer (Ocean Optics, SIR5000) with a resolution of 0.22 nm. The pulse duration was measured by a commercial intensity autocorrelator (APE, PulseCheck 150). The output beam spot was recorded by a mid-IR charge-coupled device (CCD; XenICs) with a single pixel of 15 μm.
4 Experimental results and discussion
The seeding pulses were first stretched by the front 16.5-m unpumped Er-doped fluoride fiber (–0.083 ps2/m at 2.8 μm) and then pre-amplified by the remained 1-m fiber under the launched pump power of 0.8 W. The pulse duration from pre-amplifier was measured by a mid-IR autocorrelator. The autocorrelation trace in Figure 2(a) is close to Lorentz profile due to a large pedestal, which is caused by the spectrum for chirped pulses (Figure 3(a)). Considering a Lorentz pulse profile with a convolution factor of 2.0, the pulse duration from the pre-amplifier was approximately 9.8 ps. The corresponding pre-amplified pulse spectrum is presented in Figure 3(a). The ASE spectrum, shown in Figure 3(b), was measured when the seeding pulse was blocked. The proportion of ASE in the spectrum was calculated to be approximately 8%. Considering an average power of 7.4 mW from the pre-amplifier and a repetition rate of 100 kHz, the pulse energy except for the ASE was estimated to be 68 nJ, resulting in a low peak power of 6.9 kW. The pulse nonlinear phase shift for the pre-amplifier (Φ ≈ 0.14π) can be neglected.
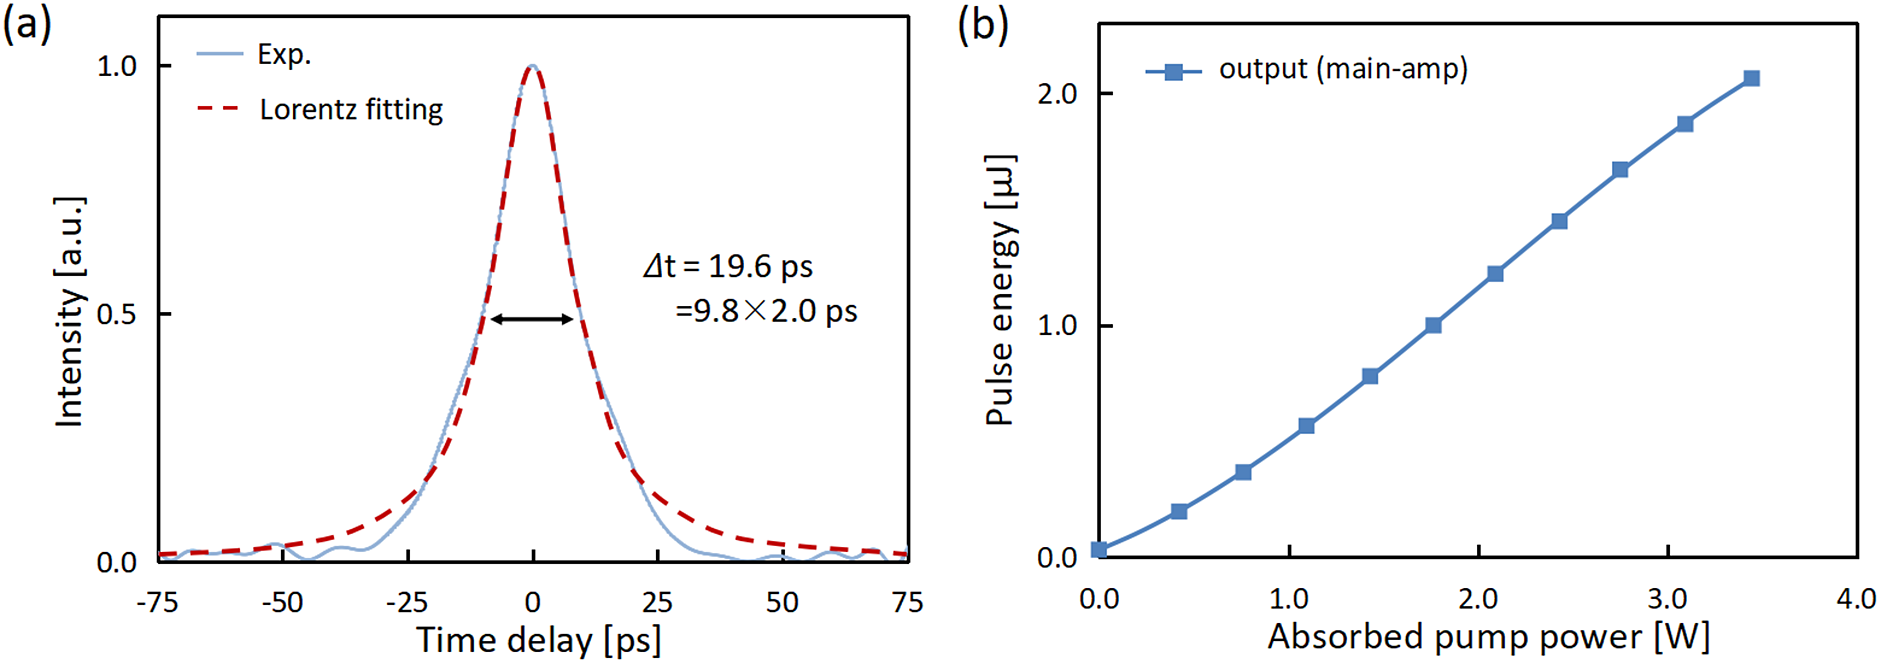
Figure 2 (a) Autocorrelation trace for the pulses after the pre-amplifier. (b) Dependence of output pulse energy on the absorbed pump power in the main amplifier.
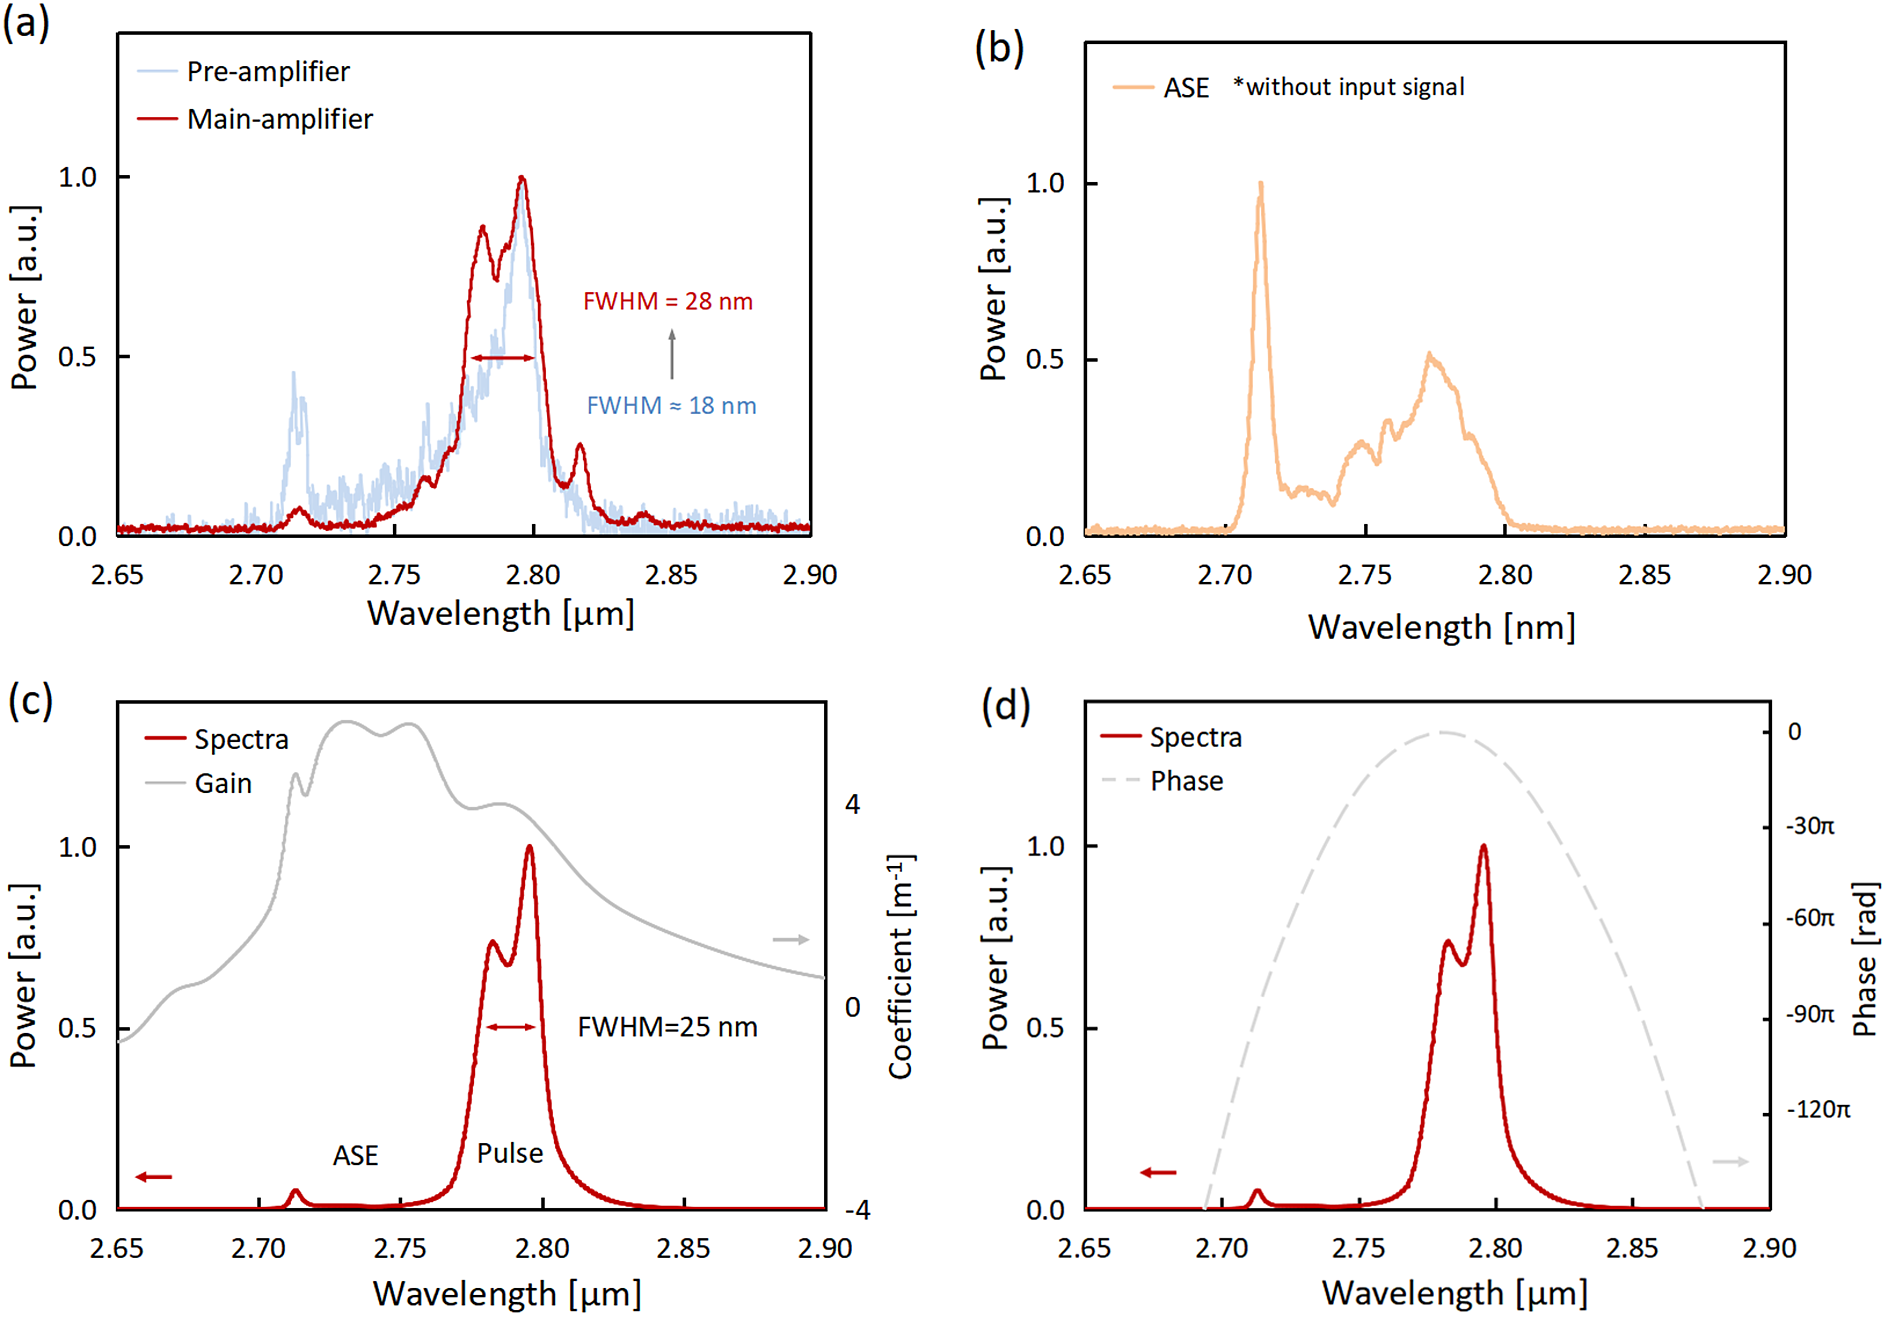
Figure 3 (a) Measured output spectra of the pre-amplifier and the main amplifier. (b) Measured ASE spectrum without seeding signal. (c) Simulated output spectrum and gain spectrum. (d) Simulated output spectrum and spectral phase.
The pre-amplified pulses were further amplified in a larger-core Er:ZBLAN fiber. Figure 2(b) shows the dependence of output pulse energy on the absorbed pump power. When the absorbed pump power reached 3.45 W, the output pulse energy of 2.07 μJ was obtained. Further increasing of pump power would increase the risk of fiber end damage[ Reference Du, Xiao, Cui, Chen, Jovanovic and Galvanauskas 36 ]. Due to the polarization-dependent loss of the optical isolator, the randomly polarized ASE component was halved before going into the main amplifier and the linearly polarized main pulse could transmit. The measured spectrum shows that the ASE component was negligible from the main amplifier (Figure 3(a)).
A negatively chirped pulse generally undergoes spectral narrowing through self-phase modulation (SPM) because the negative chirp of the initial pulse can cancel the SPM-induced positive chirp, as discussed by Agrawal[ Reference Agrawal 30 ]. In our experiment, the SPM effect was strong enough (Φ ≈ 0.8π); however, the spectral broadening phenomenon was observed such that the spectral width increased from 18 to 28 nm in the main amplifier. To explain this phenomenon, we conducted a numerical simulation of the gain profile in laser operation based on the rate equations and iteration code, as discussed above. The simulation results show that the gain peak in laser operation locates at a shorter-wavelength edge of approximately 2.75 μm rather than 2.8 μm in spontaneous emission[ Reference Duval, Bernier, Fortin, Genest, Piché and Vallée 16 ], which is caused by different population distributions in the laser operation and spontaneous emission states. A higher gain coefficient at a shorter wavelength leads to the spectral broadening of the short wavelength edge. The simulated results well matched the experimental results, as shown in Figures 3(a) and 3(c). The simulated phase plot in Figure 3(d) implied the amplified pulses were compressible.
In order to compress the chirped pulses after amplification, we adopted the highly dispersive semiconductor Ge that had a large normal group velocity dispersion of +1.685 ps2/m at 2.8 μm[ Reference Qin, Xie, Gu, Hai, Yuan, Ma and Qian 18 ]. The compressor consisted of multiple 10-mm-diameter Ge rods in the length range of 1–20 cm. We optimized the achievable pulse duration by changing the inserted total length of the Ge rod, as shown in Figure 4(a). The plot of net dispersion versus pulse duration in Figure 4(a) is asymmetrical, which is caused by the third-order dispersion of the Ge rod and ZBLAN fiber. The shortest pulse was obtained when the total length of the Ge rod was 91 cm and the net dispersion provided by fluoride fibers and Ge rods was close to zero. Figure 4(b) shows the autocorrelation trace of the shortest pulse. Assuming a sech2(t) profile for compressed pulses, the shortest compressed pulse had a duration of 408 fs, and the time-bandwidth product was calculated to be 0.44. The compressed pulse duration was mainly limited by gain narrowing in the fiber preamplifier and the remained third-order dispersion. The slight humps in the edges of the autocorrelation trace could be attributed to the third-order dispersion of +1.2 × 10⁻² ps3, provided by the Ge rods and ZBLAN fibers. Eventually, the pulse energy of 0.57 μJ was obtained after the compressor, and the calculated peak power was approximately 1.4 MW. Currently, the large transmission loss of the compressor was caused by two-photon absorption and linear absorption of the Ge rod. We also tried pulse compression with mid-IR grating (Thorlabs, GR2550-45031), and the transmittance of the mid-IR grating compressor (four passes) was only 8.3%. In the experiment, we coiled the main amplifier fiber with a small radius of approximately 15 cm to suppress the high-order transverse mode and employed an iris diaphragm to further filter out the high-order transverse mode. The near-field beam profile was recorded by a mid-IR CCD, as shown in Figure 5. The beam shows a near-Gaussian intensity distribution.

Figure 4 (a) Variation of the pulse duration with net dispersion of the stretcher and compressor. (b) Autocorrelation trace for the shortest compressed pulses.

Figure 5 Near-field beam spot of the amplified pulses.
5 Conclusion
In summary, we demonstrated a grating-free fiber CPA system at 2.8 μm for the first time. High-energy picosecond pulses of 2.07 μJ were produced through a two-stage fiber amplifier at the repetition rate of 100 kHz. Compressed by highly dispersive Ge rods, the amplified chirped pulses were de-chirped to 408 fs with a pulse energy of 0.57 μJ and peak power of approximately 1.4 MW. This grating-free design is compact and easy to install, making the fiber CPA system more robust and practical. A spectral broadening phenomenon in the Er:ZBLAN fiber amplifier was observed, which was caused by the special gain shape of Er:ZBLAN fiber amplifier in operation. The numerical simulation confirmed the results. The high-peak-power fluoride fiber CPA system with compact structure and good stability shows great application prospects in the fields of semiconductor material micro-processing, mid-IR frequency down-conversion and strong-field physics experiments.
Acknowledgment
This work was partially supported by the National Natural Science Foundation of China (Nos. 62075126 and 62005161) and the Chenguang Program.


 Open access