


Newborn adiposity is frequently used to assess the maternal–fetal intra-uterine environment and, in line with the developmental origins hypotheses, may be representative of future metabolic health outcomes( Reference Ong 1 , Reference Demerath and Fields 2 ). It has been recognised that birth weight alone, and other various indices of weight and length, that is, BMI and ponderal index (PI), do not adequately account for a neonate’s fat mass( Reference Oken and Gillman 3 , Reference Wells, Chomtho and Fewtrell 4 ). Several decades ago, Catalano et al. (Reference Catalano, Thomas and Avallone5) developed an anthropometric model to estimate neonatal fat mass, which was validated against total body electric conductivity (TOBEC). This model requires standard newborn measurements of weight and length using a hard-surface length board, and a flank skinfold thickness obtained with calipers. This model has been used in numerous epidemiological studies involving >20 000 newborns to provide a measure of newborn adiposity( 6 – Reference Feig, Murphy and Asztalos 8 ).
Other technologies have since become available to assess newborn adiposity including bone densitometry, bioimpedance, MRI and air displacement plethysmography (ADP), each with advantages and disadvantages( Reference Demerath and Fields 2 , Reference Zanini Rde, Santos and Chrestani 9 ). ADP, measured by the PEA POD® infant body composition system, is currently considered by researchers to be the optimal approach to obtain neonatal adiposity, as it was validated against the gold standard four-compartment model( Reference Ellis, Yao and Shypailo 10 ), is non-operator dependent and is both fast and non-invasive( Reference Urlando, Dempster and Aitkens 11 ). Yet, the PEA POD® is expensive and impractical for large epidemiological studies.
The objective of this study was to determine the consistency of the original neonatal anthropometric fat mass estimation equation( Reference Catalano, Thomas and Avallone 5 ) with ADP assessment methodology. Further, we sought to assess if the original anthropometric fat mass estimation equation compared with other published validation models by studying a multi-ethnic cohort and independently validating our models in a separate group of neonates, thus assuring that the model can be utilised with various ethnic populations.
Methods
In a large number of neonates, we conducted an independent assessment of the original equation using ADP data as our gold standard and explored the possibility of recalibrating model parameters. We then evaluated the accuracy of these predictive fat mass equations in a validation study in a separate group of neonates. In addition, we compared the accuracy of these equations with other published predictive equations for estimating neonatal fat mass using ADP as the reference. Newborns included in this analysis were born full term (>37 weeks’ gestation) at one of two academic institutions, MetroHealth Medical Center, Case Western Reserve University in Cleveland, OH, USA, or Northwestern Medicine Prentice Women’s Hospital in Chicago, IL, USA. The Institutional Review Board at each centre approved the study, and mothers provided written, informed consent for their newborns to be enrolled. Measurements were obtained by trained examiners at approximately 12–72 h of life. All measurements were performed in duplicate and results averaged. Head circumference was obtained with measuring tape at the broadest circumference of the head, measured to the nearest 0·1 cm. Length was obtained to the nearest 0·1 cm with the baby positioned on a hard-surface measuring board, head in the midline position, legs held straight and a moveable footboard was pressed against the balls of the feet. Weight measurements (without clothing or diaper) were obtained to the nearest 0·001 kg on a calibrated scale. The flank skinfold was measured to the nearest 0·1 mm with Harpenden calipers (Baty) in the mid-axillary line just above the iliac crest. This skinfold measurement was made by lifting the skin with the thumb and index finger, with care taken not to include any underlying tissue. The flank skinfold was measured several times until a consistent reading was obtained( Reference Catalano, Thomas and Avallone 5 ).
ADP measurements using the PEA POD® Infant Body Composition System (Cosmed), were obtained on all neonates. The PEA POD was calibrated before each use by a menu-operated system according to the manufacturer guidelines( Reference Urlando, Dempster and Aitkens 11 ). For neonate measurements, a wig cap was placed on the baby; next the baby was placed naked on the PEA POD scale and weight was measured to the nearest 0·001 kg. Then, the neonate was placed inside the PEA POD chamber for 2 min during volume measurements. Using pressure–volume equations, body composition, including fat mass and fat-free mass, was calculated to provide adiposity (reported as percentage body fat).
Statistical analysis
This study was a secondary analysis of several large observational studies and thus a sample size was not calculated. A total of three models for predicting fat mass were evaluated. Model 0 was that published by Catalano et al. ( Reference Catalano, Thomas and Avallone 5 ), specifically 0·54657 + 0·39055 × birth weight (kg)–0·03237 × birth length (cm) + 0·0453 × flank skinfold (mm). Predictive accuracy for ADP according to model 0 was independently assessed in both the Cleveland and Chicago data sets.
Model 1 used the same variables from model 0 as predictors (weight, length and flank skinfold), but linear regression model parameters were re-estimated according to observed ADP fat mass using leave-one-out cross-validation in the Cleveland data set. Final β estimates for model 1 were calculated as means from all cross-validation rounds, resulting in the equation –0·24087 + 0·28396 × birth weight–0·00968 × birth length + 0·06669 × flank skinfold. Model 2 was developed using the same approach as model 1, but additionally included head circumference as a predictor, resulting in the equation 0·40367 + 0·34824 × birth weight–0·01163 × birth length + 0·0625 × flank skinfold–0·02168 × head circumference (cm). After training model 1 and 2 parameters in the Cleveland data set, model accuracy was independently assessed in the Chicago data set.
Model accuracy was assessed according to three metrics: (1) Lin’s concordance correlation coefficient, (2) mean prediction error defined as the mean of the differences between the predicted and observed ADP fat mass values and (3) root mean squared error defined as the square root of the mean of the squared differences between the predicted and observed ADP fat mass values. All measures were evaluated for models 0, 1 and 2 in the independent Chicago validation data sets. For model 0, evaluation in the Cleveland data set using these metrics was also performed since the Catalano et al. ( Reference Catalano, Thomas and Avallone 5 ) equation was developed using measurements on an entirely independent group of individuals.
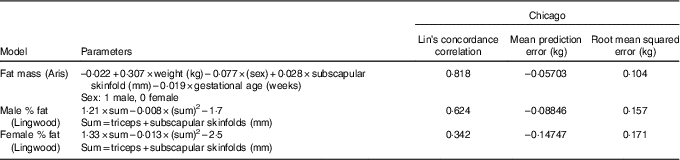
A review of the literature found three other studies that developed neonatal predictive fat mass anthropometric models using the PEA POD ADP method: Aris et al. ( Reference Aris, Soh and Tint 12 ), Lingwood et al. ( Reference Lingwood, Storm van Leeuwen and Carberry 13 ) and Deierlein et al. ( Reference Deierlein, Thornton and Hull 14 ). The Deierlein group incorporated a newborn thigh skinfold measurement in their model, a measurement we did not have within our data sets. The two other published models incorporated neonatal measurements of subscapular skinfolds (Lingwood and Aris) and triceps skinfolds (Lingwood), data we had available in the Chicago cohort. We used the Chicago data set to evaluate the accuracy of the fat mass models developed by Lingwood et al. ( Reference Lingwood, Storm van Leeuwen and Carberry 13 ) and Aris et al. ( Reference Aris, Soh and Tint 12 ) and compared with results in the Chicago data set that were used for independent validation of the equations developed here.
Using the Chicago data only, we applied the sex-specific equations from Lingwood et al. ( Reference Lingwood, Storm van Leeuwen and Carberry 13 ) to estimate the percentage fat and multiplied by birth weight to derive fat mass. Similarly, we applied the prediction model from Aris et al. ( Reference Aris, Soh and Tint 12 ) to the Chicago data. We confirmed linearity using scatterplots of the predicted values and PEA POD ADP values and then calculated the Lin’s concordance correlation coefficient, mean prediction error and root mean squared error.
We also calculated the BMI and PI for each observation in both the Chicago and Cleveland data sets. After verifying a linear relationship via scatterplots, we calculated the Pearson correlation coefficient between BMI and PI with the PEA POD ADP values for the Chicago and Cleveland data separately. Since BMI and PI are not calibrated specifically to predict fat mass but instead represent correlated measures of adiposity on different measurement scales, Pearson’s correlation was used for these analyses instead of Lin’s concordance correlation.
Results
Characteristics of the participants at each site are provided in Table 1. Race/ethnicity was self-reported by the mother as one of the following: White, Black, Hispanic, Asian. We first compared neonatal fat mass measured by ADP to simple measures of neonatal BMI and PI, equations which only require a weight and length. The correlation between BMI and ADP fat mass was 0·682 and 0·755 in the Cleveland and Chicago data, respectively. The correlation between PI and ADP fat mass was even weaker, 0·462 and 0·545 in the Cleveland and Chicago data, respectively.
Table 1 Newborn characteristics
(Mean values and standard deviations or percentages)
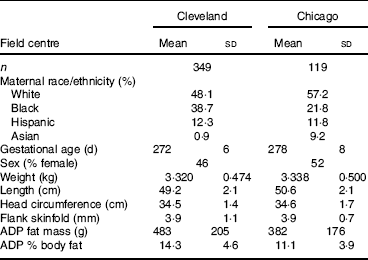
ADP, air displacement plethysmography.
Table 2 displays measures of model accuracy for predicting neonatal ADP fat mass using three models. Model 0 displays the original fat mass estimation equation( Reference Catalano, Thomas and Avallone 5 ). Model 1 and 2 parameters were estimated using the MetroHealth Cleveland cohort of 349 neonates. Model 1 used the same variables as in model 0, birth weight, length and flank skinfold thickness, to predict ADP fat mass. Model 2 included these same variables with the addition of head circumference as a predictor. Models 0, 1 and 2 were independently evaluated in the Northwestern University Chicago cohort of 119 neonates.
Table 2 Neonatal fat mass prediction
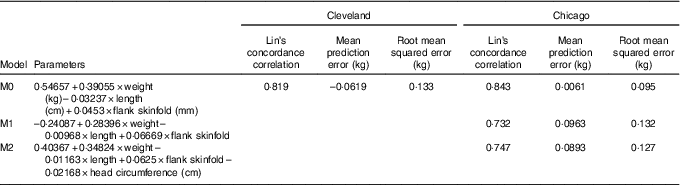
M0, original model; M1, new model using original predictors of weight, length and flank skinfold thickness; M2, M1 + head circumference.
In the Cleveland data set, M0 demonstrated reasonably high Lin’s concordance correlation with ADP fat mass with a value of 0·819. M0 tends to underestimate ADP slightly in the Cleveland data set with a mean prediction error of –0·0619 and an overall root mean squared error of 0·133.
The Chicago data set was used as an additional independent validation for model M0 as well as independent validation for models M1 and M2, with parameters that were trained using Cleveland data. Lin’s concordance correlation estimates are similar for all three models at 0·843, 0·732 and 0·747 for M0, M1 and M2, respectively. Mean prediction error is much smaller for M0 at 0·0061 compared with M1 and M2 that on average overestimate ADP fat mass with mean prediction error values of 0·0963 and 0·0893, respectively. Results according to root mean squared error confirm higher accuracy of M0 in the validation data from Chicago with values of 0·095, 0·132 and 0·127, respectively.
Bland–Altman plots to demonstrate agreement between the observed ADP fat mass and predicted fat mass are displayed in Fig. 1: (a) model 0 for the Chicago cohort, (b) M0 for the Cleveland cohort, (c) M1 and (d) M2 for the Chicago cohort. Fig. 2 displays agreement between predicted and observed fat mass in scatterplots for models 0 and 1 in both the Cleveland and Chicago data. Blue lines are lowess curves and solid lines represent the line of unity. For M0, plot of Cleveland data underestimates ADP fat mass to some extent, while results in the Chicago data demonstrate very little bias. For M1, as expected since the model was trained in the Cleveland data, the lowess curve demonstrates consistency of observed and predicted values, particularly in the middle of the ADP fat mass range. Overestimation of ADP fat mass according to M1 is evident in the plot for Chicago data.
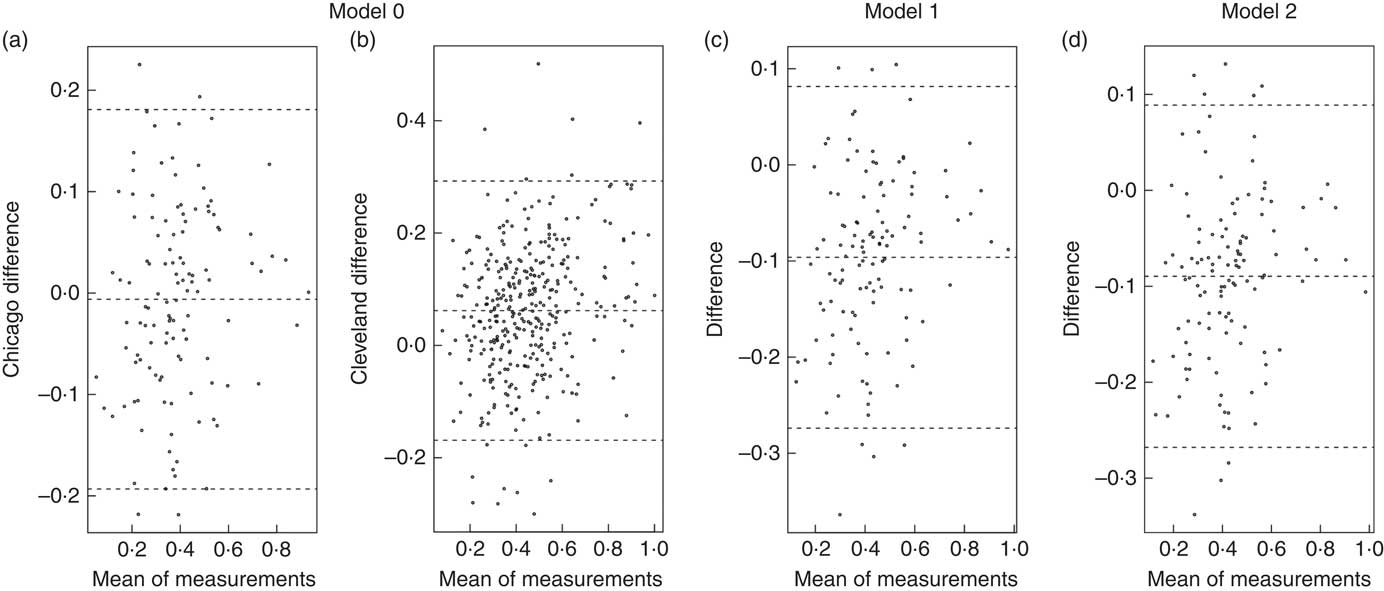
Fig. 1 Bland–Altman plots. Agreement analysis plots display the difference in the mean of measurements for model 0 in Chicago (a), and Cleveland (b), and model 1 (c) and model 2 (d) in Chicago.
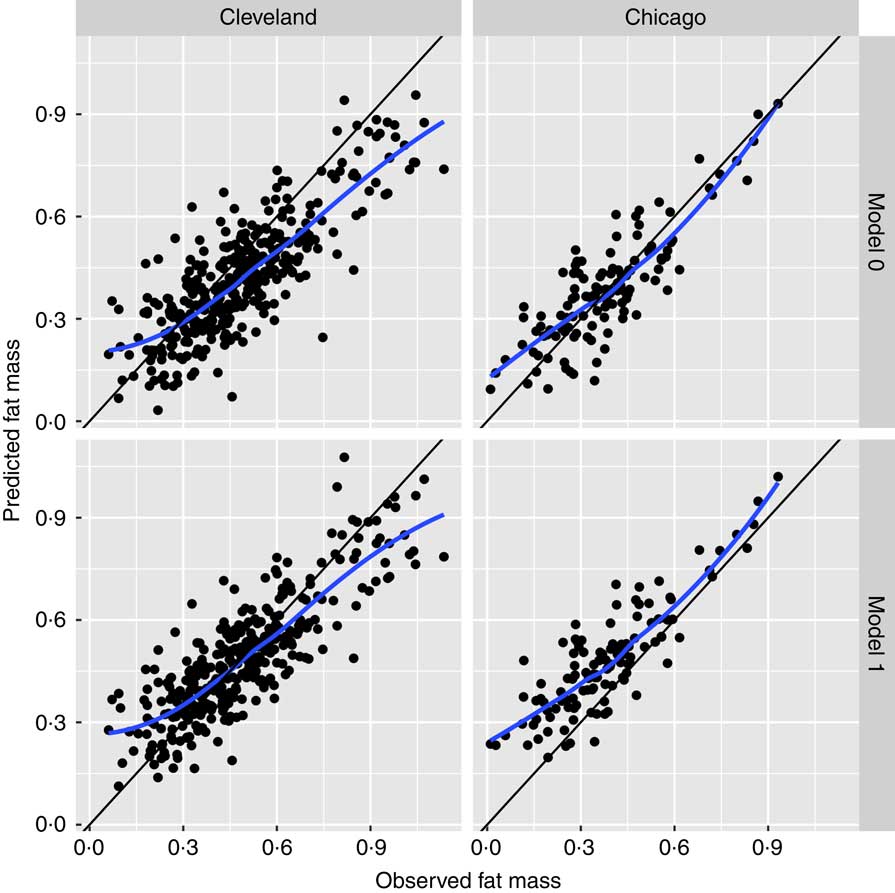
Fig. 2 Scatterplots of agreement between predicted and observed fat mass. Scatterplots for models 0 and 1 in the Cleveland and Chicago data: blue lines are lowess curves and solid lines represent the line of unity between predicted and observed fat mass.
We next compared the accuracy of these models in Table 2 to other published predictive fat mass equations, again using the Chicago data set as an independent validation. Table 3 reports measures of predictive accuracy for the fat mass models developed by Lingwood et al. ( Reference Lingwood, Storm van Leeuwen and Carberry 13 ) and Aris et al. ( Reference Aris, Soh and Tint 12 ) and tested in the Chicago data set, using ADP fat mass as the standard. Lin’s concordance correlation estimates are similar for these models, 0·818 for the Aris et al. model, 0·624 in male neonates and 0·342 in female neonates in the Lingwood model. Mean prediction errors indicate underestimation of ADP fat mass in these models. The Aris model has the smallest mean prediction error, along with the lowest root mean squared error confirming higher accuracy for this parameter equation compared with the Lingwood models.
Table 3 Aris and Lingwood equations tested in the Chicago cohort
Discussion
This analysis suggests that the anthropometric model developed by Catalano et al. ( Reference Catalano, Thomas and Avallone 5 ) several decades ago to estimate neonatal fat mass is reasonably accurate, even when evaluated with reference to ADP. A number of other studies have developed fat mass prediction equations specifically to predict ADP( Reference Aris, Soh and Tint 12 – Reference Deierlein, Thornton and Hull 14 ). However, given that the fat mass estimation equation developed by Catalano et al. ( Reference Catalano, Thomas and Avallone 5 ) has been used in a number of large epidemiological studies on neonates from a variety of ethnic backgrounds, our primary objective was to demonstrate the accuracy of this specific equation. We updated model parameters for the same covariates using ADP fat mass data from a large number of neonates born at MetroHealth Center in Cleveland, OH and then independently evaluated accuracy of these equations in a group of neonates born at Northwestern University in Chicago, IL.
We evaluated three metrics to assess model accuracy. Lin’s concordance correlation coefficient measures the agreement between two measures of the same variable and thus, when evaluated for estimation models against the gold standard ADP, gauges the accuracy of the various models. We evaluated mean prediction error in order to quantify the bias in each prediction model, that is, the extent to which each model over- or underestimates ADP. We furthermore evaluated root mean squared error as a reflection of both bias and variance of the prediction. Results for the Chicago data set are considered independent evaluations for models trained using the Cleveland data, and comparable sets of results for evaluating all models.
This analysis indicates that the original equation (model 0) estimates neonatal fat mass with reasonable accuracy and, in the independent Chicago data set, demonstrates superior performance to models 1 and 2 considered here. Model 0 has the lowest mean prediction error and lowest root mean squared error, indicating a more precise and less variable prediction equation compared with models 1 and 2. Fig. 2 displays this precision with a lowess curve for model 0 in Chicago data that is closer to the line of unity than for model 1.
We also tested the accuracy of other published fat mass prediction equations, specifically those developed in the Aris cohort of Asian neonates( Reference Aris, Soh and Tint 12 ) and the Lingwood cohort( Reference Lingwood, Storm van Leeuwen and Carberry 13 ). The ethnicity of the Lingwood cohort is not specified. We determined that both of these models had similar levels accuracy in predicting neonatal fat mass, compared with the original Catalano model( Reference Catalano, Thomas and Avallone 5 ), with a slightly higher level of accuracy in the Aris model compared with the Lingwood model. It is interesting to note the similar level of accuracy between the Aris and Catalano models when validated in our Chicago cohort, as Aris was composed of Asian neonates, and the Catalano and Chicago cohorts were multi-ethnic.
An analysis of BMI and PI compared with ADP fat mass using Pearson correlation showed rather poor correlations compared with the predictive fat mass models that incorporated at least one newborn skinfold measure. From the results within these analyses, we can conclude that adding one newborn skinfold measure using calipers to the usual newborn measures of weight and length improves the accuracy of estimating neonatal fat mass.
An advantage of using an anthropometric estimation model is the ability to obtain accurate fat mass measurements on newborns with only three measurements, using relatively inexpensive and portable equipment. Examiners can be easily trained on the technique of obtaining the newborn’s weight, length on a hard-surface board and skinfolds with calipers. The original Catalano model( Reference Catalano, Thomas and Avallone 5 ) for newborn fat mass estimation and the Aris cohort( Reference Aris, Soh and Tint 12 ) use just a single skinfold, whereas other anthropometric models( Reference Lingwood, Storm van Leeuwen and Carberry 13 – Reference Schmelzle and Fusch 16 ) use 2–4 skinfold measurements; these extra measurements may increase the likelihood of error. Similar accuracy between the Catalano model validated within a multi-ethnic newborn population, and the Aris model validated within an Asian population provides justification that either of these models are reasonable options to accurately assess neonatal fat mass.
Contrary to other anthropometric models in which the reference method for predicting fat mass was PEA POD ADP( Reference Aris, Soh and Tint 12 – Reference Deierlein, Thornton and Hull 14 ), the model developed by Catalano et al. ( Reference Catalano, Thomas and Avallone 5 ) used TOBEC as a reference method. The coefficient of determination between the TOBEC fat measurements and the derived anthropometric model estimates of newborn fat was high (r 2 0·84, P = 0·0001). The TOBEC method has fallen out of favour with the development of newer methods such as the ADP method used by the PEA POD, which was specifically developed for use in newborns and infants to measure body composition( Reference Urlando, Dempster and Aitkens 11 ).
Recognising that all anthropometric estimates of neonatal body composition have limitations, in this report, we have demonstrated that the original model is accurate in estimating newborn fat mass when evaluated with regard to the newer methodology of ADP. The present analysis utilised data from two sites for a total of 468 neonates, improving on prior studies of a smaller number of newborns. The use of multi-ethnic cohorts, and independently validating the models enables these results to be generalisable to various populations. Neonatal body composition data in the literature from various ethnic groups is lacking, thus continued evaluation and reporting of these measures from multiple ethnic groups is necessary.
In summary, these results demonstrate that the original anthropometric fat mass estimation equation( Reference Catalano, Thomas and Avallone 5 ) is accurate for estimating newborn fat mass. Within the fields of developmental origins research and longitudinal assessment of body composition over the lifespan, we advocate the continued use of this newborn anthropometric fat mass estimation equation in epidemiological studies.
Acknowledgements
There was no financial support for this study.
J. L. J. conceptualised and designed the study, collected the data, interpreted the data, drafted the initial manuscript and reviewed and revised the manuscript. M. N. performed data analysis and generated the figures. O. T. performed data analysis. D. M. S. supervised data analysis, interpreted the data, and reviewed and revised the manuscript. P. C. conceptualised and designed the study, supervised data collection, interpreted the results and reviewed and revised the manuscript. All authors approved the final manuscript as submitted and agree to be accountable for all aspects of the work.
The authors declare that there are no conflicts of interest.


