


Techniques
Exploring the Parameter Space of Point Spread Function Determination for the Scanning Electron Microscope – Part I: Effect on the Point Spread Function by MC Nevins, K Quoi, RK Hailstone, E Lifshin, Microsc Microanal | doi:10.1017/S1431927619014806
The point spread function (PSF) of the scanning electron microscope (SEM) can be determined using a recently developed nanoparticle calibration method. Many parameters are involved in PSF determination, and these introduce a previously unstudied amount of uncertainty into the PSF size and shape. Signal type, support material thickness, reference particle size, PSF smoothing (K), and background correction were investigated regarding their effect on the PSF. Experimental data were complemented by CASINO simulations. Differences in detector position between the observed particles and the method's simulated reference particles caused shifting between secondary electron (SE) PSFs and backscattered electron (BSE) PSFs. Support material thickness did not have a practical effect on the PSF at the tested accelerating voltages. Uncertainty in reference particle size varied the PSF full width at half maximum (FWHM) within ± 0.7 nm at 2σ, with virtually no uncertainty in some cases (see adjacent plots). The K smoothing and background correction were also studied. The interconnection of these parameters will help in future efforts to select optimum parameter values.
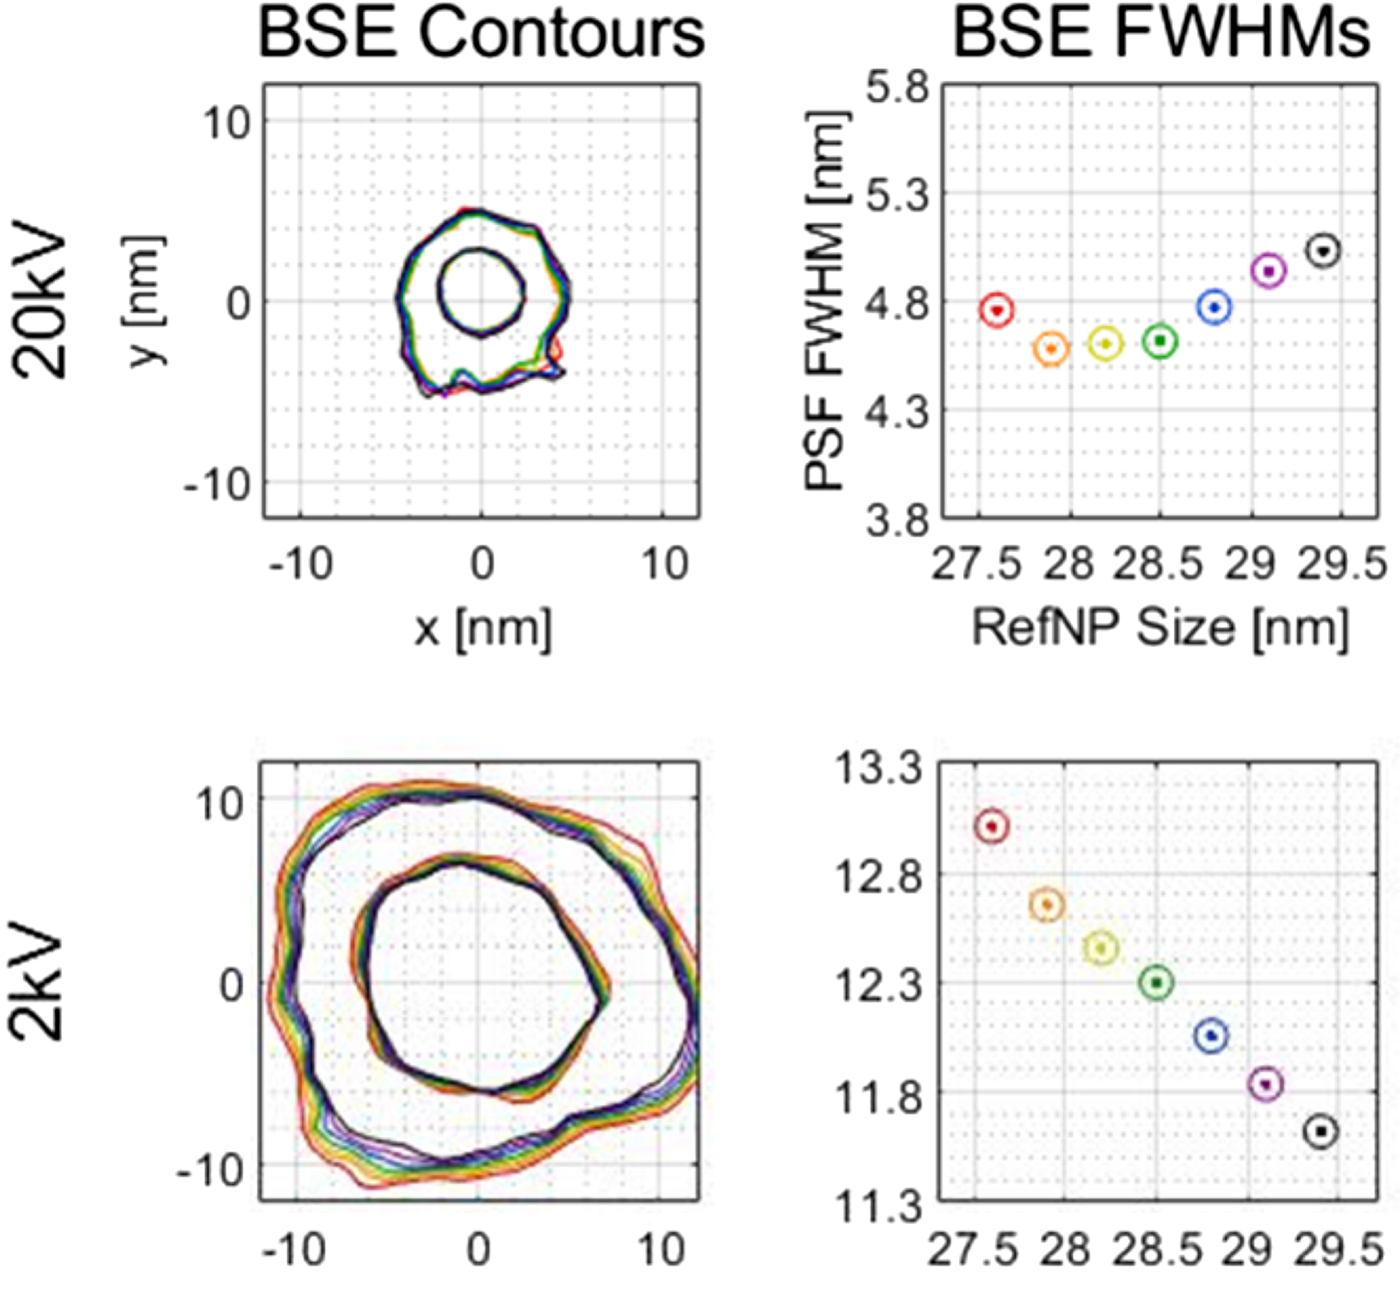
Reference particle size range PSF contours and FWHMs on a TEM grid. Contour plots show FWHM and FWTM contours (inner and outer, respectively). The rainbow of colors from red to purple and then black represents different reference particle sizes. The axis labels on the top plots also applies to the 2 kV plots in that column.
Techniques and Biological Applications
Annexin A2 Enhances the Progression of Colorectal Cancer and Hepatocarcinoma via Cytoskeleton Structural Rearrangements by Huimin He, Li Xiao, Sinan Cheng, Qian Yang, Jinmei Li, Yifan Hou, Fengying Song, Xiaorong Su, Huijuan Jin, Zheng Liu, Jing Dong, Ruiye Zuo, Xigui Song, Yanyan Wang, Kun Zhang, Wei Duan, and Yingchun Hou1, Microsc Microanal | doi:10.1017/S1431927619000679
Annexin A2 (ANXA2) has been implemented in the progression of cancer and modulates the behavior of cytoskeletal proteins. However, the detailed regulation of ANXA2 in colorectal cells is poorly understood. We report that ANXA2 plays a role in rearrangement of cytoskeletal structures relevant to cell motility and that ANXA2 is involved in the progression of colorectal cancer. Inhibition of ANXA2 was performed using RNAi methods and changes in the f-actin components of the cytoskeleton were used to investigate the involvement of ANXA2 in cell metastatic potential (Figure). We found that ANXA2 is involved in the progression of colorectal cancer via the modification of cell growth and motility. Inhibition of ANXA2 resulted in depolymerization of f-actin and impaired rearrangement of the cytoskeleton altered cell motility. These results suggest that ANXA2 may serve as a potential biomarker for diagnosis of colorectal cancer and that it may provide a promising target for cancer therapy.
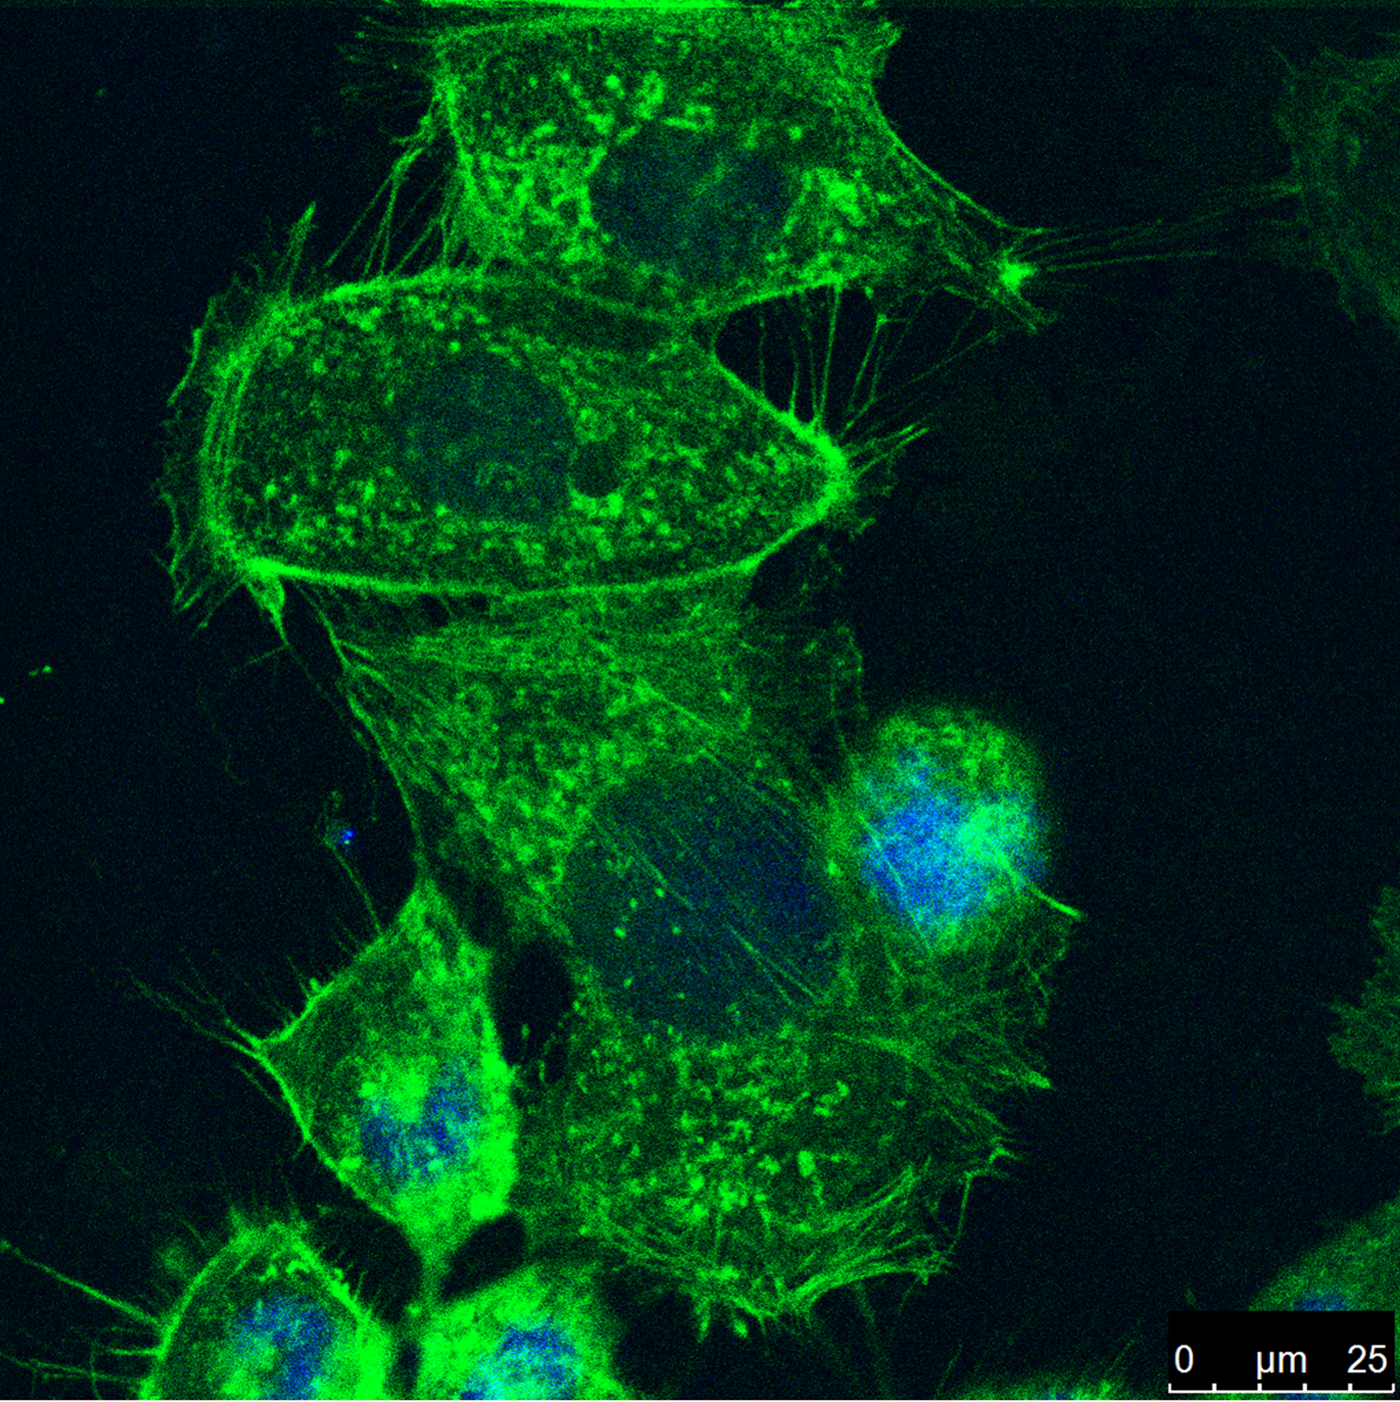
Caco2 cells were seeded on coverslips in a six-well plate. After ANXA2 inhibition (72 h) depolymerization of f-actin (green) led to rearrangement of the cytoskeleton and reduced cell motility. Cell nuclei were stained with DAPI (blue).
Techniques and Material Applications
Electron-excited X-ray Microanalysis by Energy Dispersive Spectrometry at 50: Analytical Accuracy, Precision, Trace Sensitivity, and Quantitative Compositional Mapping by DE Newbury and NWM Ritchie, Microsc Microanal | doi:10.1017/S143192761901482X
Electron-excited X-ray microanalysis with energy dispersive spectrometry (EDS) is a core elemental characterization technique that is widely applied in the physical and biological sciences, engineering, especially manufacturing and failure analysis, and forensic science. Quantitative EDS analysis can be performed following a standards-based protocol that uses a simple standards suite consisting of pure elements and binary compounds for those elements that are incompatible with a vacuum (e.g., MgO, CaF2). Tests of accuracy performed on homogeneous reference materials and stoichiometric compounds demonstrate that a relative deviation from expected value (RDEV) of 5% or less can be achieved in at least 95% of analyses for major (C > 0.1 mass fraction) and minor (0.01 ≤ C ≤ 0.1) constituents, even with severely interfering X-ray peaks and large differences in the relative concentrations of the interfering species. Trace (C < 0.01) constituents can be measured to levels of C = 0.001 (1000 parts per million) or lower. X-ray spectrum imaging that collects a complete EDS spectrum at each beam location yields quantitative compositional maps (Figure).
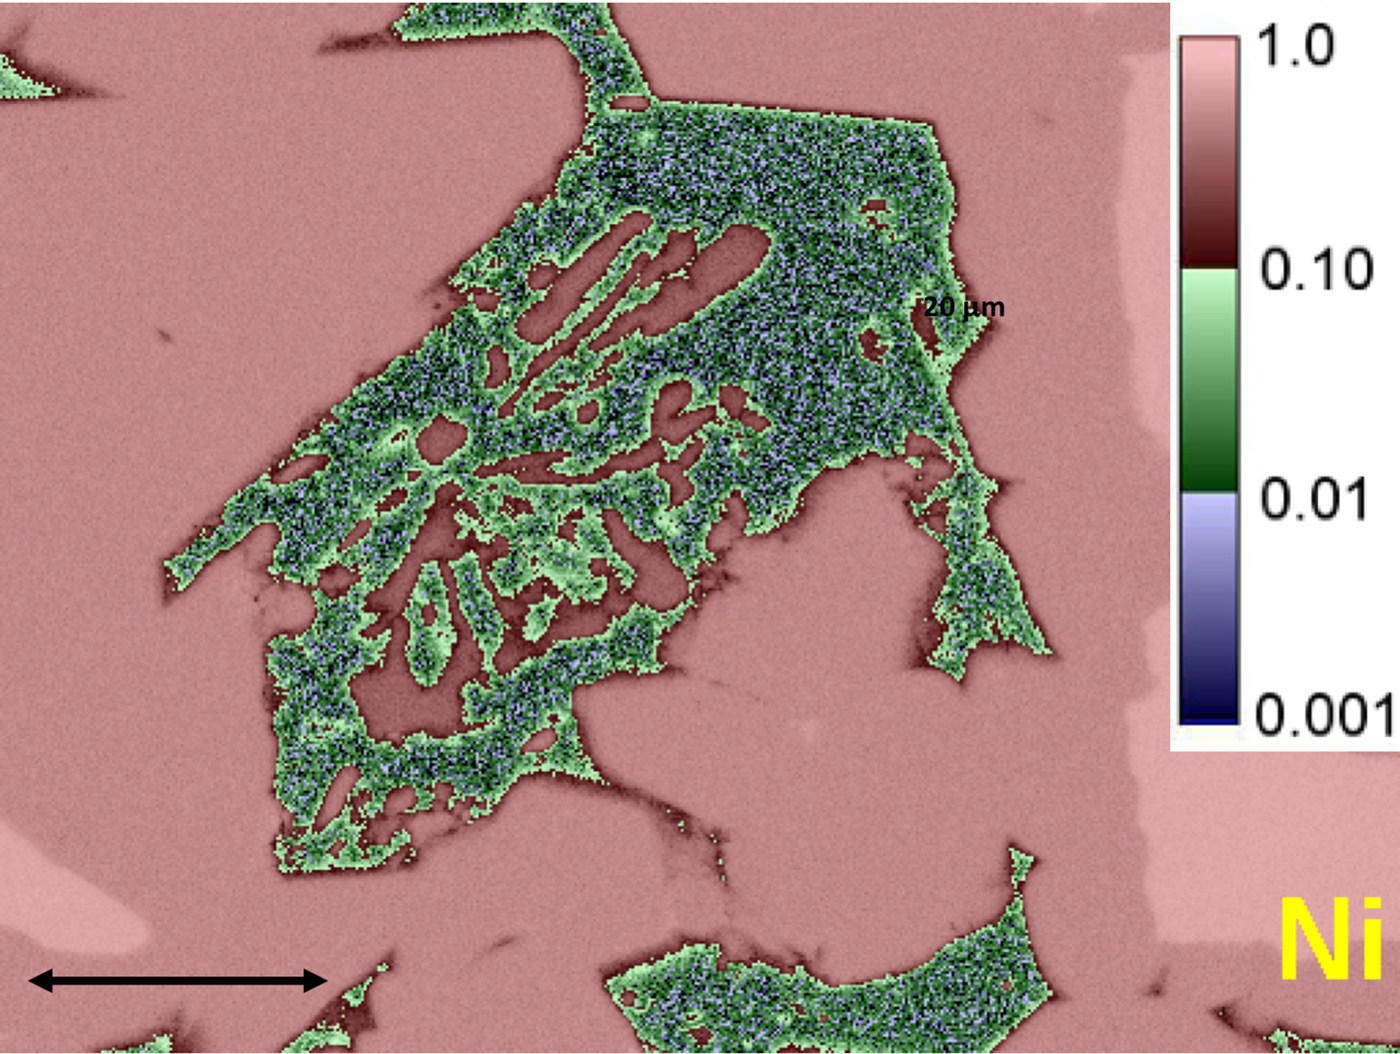
X-ray spectrum imaging (XSI) with EDS. Image shows a quantitative compositional map of Ni in Raney nickel alloy with logarithmic 3-band color encoding of the Ni concentration values. Green and blue features show regions with relatively low Ni concentrations. Small blue regions indicate trace levels of Ni (C < 0.01).
