


Agriculture in the semi-arid climate of Afghanistan is very dependent upon irrigation. In the north-east, river discharge is kept moderately high through the growing season by melting snow from the Hindu Kush which supplies local village fields even as high as 3 600 m (11 800 ft) before coalescing in gorges like that of the Panjshir River which waters extensive plains to the south as it flows on to join the River Indus. The height of the climatic snow line in these mountains has risen until it is now only a little below the highest peaks. This, together with the concomitant shrinkage of glaciers has reduced the total amount of water stored in the mountains and increased the dependence for melt water upon the more ephemeral snow patches. Further observation on the wide range of human and physical problems associated with this glaciological phenomenon was the aim of an expedition of 12 staff and students from the University of Newcastle upon Tyne. Work was carried out during July and August 1965 from a base camp at 4 200 m (13 800 ft) at the head of the Samir Valley, a branch of the Panjshir, and 150 km (93 miles) north-east of Kabul. This paper outlines the regime of the Mir Samir West Glacier.
Topography
The general trend of the main mountain ridges is south-west to north-east but turreted Alpine peaks soar steeply from side ridges 1–2 km long. The rock varies from slightly metamorphosed sediments found along the west flank of the Samir Valley to hard gneisses and schists which are dominant elsewhere. These have well-marked joint planes that weather into deep clefts and give rise to extensive block screes. The highest mountain—Mir Samir—rises to 5 809 m (19 060 ft) at the intersection of two ridges, the longer of which trends west-southwest to east-north-east.
In each of the quadrants so formed, snow accumulation is sufficient to produce a glacier but only in the two north-facing ones are they of any size. The largest is known as East Glacier and is nearly 1 km2 in area; the one to the north-west is known as West Glacier and is 0.5 km2 in area. lt falls steeply as an ice apron from 5 080 m (16 700 ft) on the north-facing rock precipice (Fig. 1). The bergschrund at approximately 5 000 m (16 400 ft) opens along nearly the whole length of the glacier, the surface of which slopes gently westwards from a secondary snow-collecting basin at its eastern end. The average height of the glacier surface is 4 870 m (16 000 ft). To the north it is bounded by a low ridge which gives rise westwards to a broad lateral moraine, partly separated from the glacier by a melt stream flowing on the ice. At the western end it curves steeply to a sluggish melt-water lake dammed by a terminal moraine of large sub-rounded blocks, through which the melt water courses to a series of shallow moraine-ponded streams that show considerable diurnal flow.

Fig. 1. Map of the head of Samir Valley. Afghanistan.
Snow Accumulation and Stragification
The continuity of snow layers over the greater part of the glacier can be interpreted from the vertical snow profiles, of which three typical sections are shown in Figure 2. In 1965 the glacier was snow-covered until near the end of August but in most years the snow on the tongue seems to melt completely and the snow-accumulation season does not commence until late winter. Moderate winter winds are indicated by thin crusts, above which a characteristic series of superimposed layers suggests that, in spring and early summer, cloud cover and precipitation are interspersed with bright sunshine. In the pit profiles medium-grained snow, moderately compacted, gives way to loose damp snow which is then covered by crusts that can reach a considerable thickness and display an undulating upper surface where wet snow and possibly some rain has fallen onto a glazed surface. An undulating lower surface of the dominant ice layers indicates radiation melting and melt-water percolation into the snow beneath, sometimes giving rise to ice knuckles.

Fig. 2. Snow stragification on Mir Samir West Glacier, July 1965.
At all the pits examined, the control by radiation and decrease in precipitation is manifest as the ice layers increase in frequency, thickness and continuity as the summer surface is approached.
The minimum temperature in the vertical profiles was found to be under the dominant ice layers, suggesting an early spring minimum, by which time nearly half the snow has accumulated on the middle and upper areas of the glacier.
Only in the bergschrund was it possible to measure at different sites the thickness of earlier annual layers between the yellow-brown discoloured ice formed by rock dust blown onto wet summer snow (Table 1). Figure 3 shows the measured accumulation and the gross accumulation interpolated from pits in protected snow patches at the glacier margin and from the distribution of adjacent fine-grained rock material on boulders and heaped cobbles. The interpolated curve of net accumulation is based on the mean accumulation measured in the bergschrund and the increasing thickness of infiltration ice found at the snow/ice interface, which indicates a firn line a little below 4 900 m (16 000 ft).
Table. I Accumulation (kg m−2) in Bergschrund on Mir Samir West Glacier


Fig. 3. Change of snow accmulation and glacier area with height, July 1965.
Flow lines could be traced in the snow when viewed from a distance but no definite crevasses were seen. Some mass transfer from the steep accumulation slopes to the lower glacier was evident in the slow trickle of melt water, dripping in the bergschrund and flowing along the ice surface at the bottom of the snow pits, but avalanches transfer the bulk of the snow down the steep rock wall.
Ablation
Thirteen flagged wood stakes (nine on the glacier and four in large snow patches) were set >2 m in the snow on 16 July 1965, and the snow level and density were read periodically at the stakes. Figure 4 shows the mean values of gross ablation on the glacier which was generally between 10 and 20 kg m−2 d−1.

Fig. 4. Mean gross and net ablation over Mir Samir West Glacier, July. and August 1965.
Net ablation was measured as stream discharge, 100 m from the glacier terminus, where melt water formed a wide, juvenile turbulent stream. After some days of experimental siting, a water-depth recorder was mounted on top of a stilling well. Stream flow was achieved from this record via a stage/discharge curve, for which successive gauging of stream flow was made by civil engineering, dilution techniques. For this, sodium dichromate and a photometer were used in preference to sodium chloride and a conductivity bridge, since the former combination does not require large quantities of salt nor careful measurement of water temperature.
Hourly discharge, plotted from the depth record and stage/discharge curve, showed minimum flow occurring daily at 10.00 h local time increasing slowly, in response to radiation melting, to a maximum about 18.00 h. The stream never dried up though freezing at the falling surface caused trouble with the float of the water-level recorder. Melt water percolated through the snow and generally flowed along the ice surface of the previous year, revealed in the pits. Hence even a sharp drop in air temperature caused only a tardy response in the stream flow, the glacier behaving like a flood-control reservoir.
In Figure 3, net ablation measured as stream discharge divided by the area of the glacier averaged 9 kg m−2 d−1. Over the 3 weeks during which both net and gross ablation were measured gross ablation was 17% greater.
Mass Balance
From Figure 3 the product of the net accumulation and the glacier area above the firn line is 40 000 m3 of water equivalent. To balance this amount by melting over the glacier area below the firn line requires the removal of 95 kg m−2. Since most of the glacier surface even in late August was still covered by winter snow, it is unlikely that there would be much change in the balance for 1965. In most years, however, it seems that the lower glacier is reduced to bare ice by early winter. In mid-July 1956, Reference NewbyNewby (1958, p. 143) found about 1 ft (30 cm) depth of rapidly melting snow over the lower area of the glacier.
The hypsographic curve in Figure 3 shows the extensive area of the glacier between 4 840 and 4 870 m. Lowering of the firn line into this height interval would thus cause the glacier to advance. The high (c. 20 m) terminal moraine about 100 m from the glacier snout borders a boulder-strewn basin that has every appearance of a bull-dozed hollow, at the deepest part of which, and fringing the glacier, is a shallow lake and snow patch. This hollow and the high moraine are a result of fluctuations of the glacier snout position as the firn line pulsed a few metres into the critical altitude range of 4 840 to 4 880 m. From the evidence of lichens (see below), the alternations of the glacier have probably occurred during the last 400 years. A rise of the firn line to its present level of nearly 4 900 m thus results in a slow recession.
Glacial Retreat Interpreted from Lichen Distributions
A thorough examination of lichens growing on the moraines around the west glacier suggests that a very slow retreat may recently have speeded up. The usual criteria of species number/uniform area and mean and maximum colony diameter were used in the investigation.
The composition of the assemblages mapped are indicated in Table II. It can be seen that the units are reasonably homogeneous and separated by clear-cut differences. Figure 5 shows how they tend to lie in arcs around the snout of the glacier, parallel to each other and to the receding ice front. On the northern side of the moraine the oldest stages are missing along certain stretches because at these points summer melt water is continually acting to cause instability and erosion down steep boiler-plate slabs.
Table II Characterization of the Lichen Zone


Fig. 5. Lichen zones on moraines at the snout of Mir Samir West Glacier.
It is impossible to put an accurate time scale to the sequence of lichen colonization described above, as lichen growth is controlled by climatic features and the two have only been integrated for a few areas. There is also some indication that young lichens grow faster than old ones (Reference AbbayesAbbayes, 1951).
Having stated the limitations of the method, it is cautiously suggested that the age of the terminal moraine where several of the lichen species are represented by colonies over 80 min in diameter must be measured in hundreds of years with a minimum somewhere near 400 years and a maximum between 1 000 and 1 500 years. The width of zone 5 gives the impression that retreat may recently have speeded up.
Regional Summary of Glacier Recession
Figure 1 shows the approximate extent in mid-August of the glaciers at the head of the Sarnir Valley. The glaciers on the steep north-facing slopes are supplemented by avalanche snow from yet steeper slopes above and have a lower limit close to 4 800 m (15 750 ft). The smaller shrunken glaciers in cirques open to the west have a fairly common lower limit of 4 930 m (16 170 ft). For south-facing slopes the snow line is above the highest peaks.
Reference GrötzbachGrötzbach (1964, p. 296), with a geographical expedition from the Universität München, gave 4 700 and 5 100 m for the snow line in 1963 on north- and south-facing slopes of the middle Khwaja-Muhammad mountains, which are 40 km to the north. This indicates a climatic snow line that is more than 100 m higher than was drawn by Wissman on his map of snow lines in High Asia, and hence Grötzhach postulated glacial retreat.
At the head of the Samir Valley, an earlier halt stage of the glaciers can be interpreted over the cirque floors with a common height of approximately 4 600 m (15 100 ft). The most advanced stage of the ice is indicated by large lateral moraines along the Samir Valley, but it is not easy to separate individual moraines of glacial evidence from soil creep and the extension of scree from the valley walls. However, a marked change can be observed in the valley at 3 960 m (13 000 ft) where the V-shape valley cross-section below gives place to the U-shape above, and where the rock debris below is contiguous with the steep scree that produced it, and is not ridged parallel to the valley walls. These two earlier halt stages are also reflected in two remnant terraces found at intervals along the sides of the deeply entrenched Panjshir river to which the Samir river is a tributary.
The greater snow to the east in the Karakoram mountains produces a lower snow line, e.g. 4 000 m on the Chogo Lungma Glacier (Reference UntersteinerUntersteiner, 1957), but recession there too is the dominant theme. The Kolahoi northern glacier in Kashmir Las has retreated 1.5 miles (2.4 km) since 1857 (Reference OdellOdell, 1963).
Micro-meteorology at the Glacier
It is assumed that the fluxes of heat, momentum and water vapour in the surface layer are proportionally dependent on their respective vertical gradients. This gives rise to the following expressions for flux of momentum τ, heat H, and vapour E, which may be written (Reference SuttonSutton, 1953):


where the constants K m, K H and K v are the respective eddy diffusivities, u is wind speed, T temperature and q the specific humidity. If the vertical profiles are very similar (can be superimposed), then these eddy diffusivities are generally assumed equal.
Apparatus
Individual psychrometers were made for each height of measurement (Reference CaisleyCaisley and others, 1963, p. 40) but, since mean values were required, lagged thermocouples were used rather than transistors. Wet and dry bulb, copper-constantan thermocouples were soldered to short copper rods mounted concentrically in tubular radiation screens through which air was drawn by a 16-blade fan powered by a 12 V motor. Psychrometer units were clamped to a vertical aluminium tube at 2, 6, 10, 30, 100 and 200 cm, and pointed up-wind. When wind and sun were from the same direction, the mast was swung round a few degrees to avoid direct rays onto the thermocouples. The 12 air temperatures could be read successively at a light-point galvanometer within 1 min. Similar thermocouples were taped to a wood rod inserted in the ground with the couples on the north side to give temperature readings at 1, 3, 6, 12 and 30 cm depth.
Temperatures were read up and down the range of thermocouples for alternate periods of 5 min in each run.
Casella Shepherd cup-counter anemometers were mounted on a nearby separate mast at 10, 20, 30, 100 and 200 cm, and were read at the beginning and end of each timed run. Mean values at each height were accepted as representative of the temperature and humidity profiles for the 30 min observation period which was accompanied by the run of the wind recorded at the anemometers, from which a vertical mean profile could be drawn of wind speed.
A levelled Moll Pile with potentiometer measured incoming and reflected short-wave radiation, from which albedo could be found for the surface through the day.
A Monteith type of net-flux radiometer (Reference Monteith and SzeiczMonteith and Szeicz, 1962, p. 492) made of 300 fine wire thermocouples on a 10 cm diameter annulus was mounted on a 1 m long, thin bamboo arm clamped horizontally 1 m from the ground. This was gently swung through 5° above and below the horizontal and so achieved ventilation which permitted a steady value of the net radiation flux to be read on the potentiometer. Radiation was read to accompany each set of wind and temperature profiles.
Wind, temperature and humidity
Figure 6 summarizes meteorological observations made in the same valley as the glacier but 3 km distant and 600 m lower. High air temperature with great diurnal range, low humidity and light north-west winds prevailed with small amounts of cloud. These conditions were interrupted by shorter periods varying from a few hours in the evening to a few days, when alto-stratus clouds grew from the west accompanied by more variable winds bringing snow flurries up the valleys.

Fig. 6. Meteorology at the head of Samir Valley at an altitude of 4 200 m (13 800 ft), July and August 1965.
Surface winds were controlled by valley direction and on the glacier light winds were common down the gently sloping surface. Wind speeds at 1 m above the surface ranged from 0.5 to 4 m s−1. Wind speeds at the lower heights were thus less precise, anemometers occasionally stopping during a timed run. Ignoring these few occasions, vertical profiles of wind speed could be fitted by a logarithmic law. At the lowest speeds, winds above 10 cm increased linearly with height. It was expected that wind-speed profiles would deviate from the logarithmic law as air stability deviated from the neutral atmosphere (Reference Grainger and ListerGrainger and Lister, 1966, p. 124) but the Richardson number, used as a stability index, departed little from zero for 20 of the 24 observed profiles. Thus it was surprising to find poor agreement in the superimposed profiles of wind speed, temperature and vapour pressure. The last two were very similar but a common law was not possible and a logarithmic law, which gave the best fit, was used in the estimation of fluxes for comparison in the ablation process.
Gradients of temperature and vapour pressure were small and rarely varied as the logarithm of height through the whole 200 cm but became more linear above 100 cm and displayed definite anomalies in the lowest few centimetres (Fig. 7). It is thus doubtful whether the vertical fluxes calculated through the 100 to 30 cm air layer can be assumed to apply through the lowest 10 cm where the anomalies in the profiles indicated some advection. Nevertheless, in the heat-balance calculations, the fluxes through the 30 to 10 cm air layer were assumed to reach the surface.

Fig. 7. Typical profiles of wind speed (u), temperature (T) and vapour pressure (e).
Evaporation and eddy convection
Evaporation, derived from Equation (3), may be written with vapour pressures in place of specific humidities and separating the constants for the site:
where

and E is evaporation in kg m−2 s−1, e 1 and e 2 are vapour pressure in mbar at heights z 1 and z 2 (i.e. 0.3 and 1.0 m), u 1 and u 2 are wind speed in m s−1 at heights z 1 and z 2, M is the molecular weight of water = 18, k is von Kármán’s constant ≈ 0.4, R is the gas constant = 8.31 J mol−1 K−1, T is air temperature in k ≈ 278, d is the conversion from mbar to N m−2 = 102, and thence B = 1.55 kg m−3 mbar−1, over the length of test period, 30 min.
Similarly, Equation (2), expanded as Equation (4), may be written in the convenient form:
where

and H is sensible heat in kW m−2, T 1 and T 2 are temperature in °C at heights z 1 and z 2, ρ is air density, which at the height of the glacier and with the mean temperature and humidity of the observation period = 7.102 × 10⁻⁴ Mg m−3, C p is the specific heat of air ≈ 1.003 kJ kg K−1, and thence C = 1.416 for H in kW m−2.
Evaporation was small (0.32 kg m−2 h−1) even in the early afternoon with little cloud cover and wind speed nearly 3 m s−1 at 1 m. With the up-glacier wind bringing warmer air and light precipitation there was condensation which reached a peak about 09.00 h (Fig. 10) with 0.41 kg m−2 h−1.
Evaporation was only 20% greater than condensation over the total observation time, being negligible in the mass balance though of critical importance in the heat balance because of the high value of the latent heat of vapourization of ice (≈ 2 598 J g−1).
The sensible heat flux was very small, since gradients of temperature and wind speed were generally small; even when warm moist air, bringing light precipitation, moved up-slope from the west, the sensible heat was still small as a component in the heat balance.
Conduction through the Surface Snow Layer
Conduction of heat through the snow surface cannot be measured directly, since temperature probes for measuring gradients are not satisfactory at the surface and thermopiles in the form of heat-flux plates interfere with natural conditions, particularly in snow near 0°C at which they rapidly become wet and useless. Hence vertical profiles of temperature for each 30 min test period were plotted to find the gradient at 5 cm depth (Fig. 7). The mean change in temperature from the previous test to the following test was found by graphically integrating from 0 to 5 cm depth the area between the snow temperature profiles. The heat per 30 min into this 5 cm layer was then added to the heat conducted through the bottom of this layer (Fig. 8). Radiation on the surface snow caused rapid heating, from which melt water percolating into the snow raised to 0°C a layer that varied from approximately 12 to 20 cm thick (Fig. 8). Such an isothermal layer precluded heat conduction but changes in the thickness of this layer provided a small component in the heat balance. Vertical spacing of the thermocouples was too big below the first 12 cm to permit accurate measurement of this change in depth of the 0°C isotherm, so the resulting small component of heat is included in the total error, shown as “unexplained” in the heat balance in Figure 11.

Fig. 8. Snow temperatures on Mir Samir West Glacier, 9–10 August 1965.
Radiation (Fig. 9)

Fig. 9. Albedo, radiation and cloud over Mir Samir West Glacier, 9–10 August 1965.
Albedo of short-wave radiation varied between 45 and 60% which is slightly lower for a melting snow surface than observed on glaciers at higher latitudes (Reference Lister and TaylorLister and Taylor, 1961, p. 33). However, this is in accordance with the observed decrease in albedo with increase in radiation and, as commonly found, incoming radiation was slightly increased (and albedo decreased) by the presence of small amounts of cloud. Stratus clouds provided a better reflecting surface and thus greater increase in incoming radiation (and accompanying decrease in albedo) than cumuliform cloud.
Melting
Gross ablation, as shown in Figure 4, was too small and inaccurate for comparison with ablation calculated over 30 min intervals. The volume of melt water discharged in streams that joined only a short distance from the glacier snout was 73% of the gross ablation over the 3 weeks when both gross and net ablation were measured. Net ablation as stream discharge and the volume of gross ablation as calculated for the micro-meteorological intervals is shown in Figure 10. Of 9 740 m3 of melt water available, only 8 308 m3 were discharged in the glacier stream in the same 24 h, leaving 1 432 m3 retained in the snow cover. Since the area of the glacier was 4.4 × 10⁵ m2, the water retained in the snow cover could, on refreezing, give up 108.5 J cm−2 and raise by 0.3°C the temperature of an average column of 1 cm2 cross-section and 150 cm depth, having a mass of 82.5 g. The measured temperature rise was less than 0.1°C per day, so approximately 0.27 g of water was available per cm2 column, filling part of the 55.5 cm3 of pore space, a decrease in pore volume of 0.5% on that one day of high melt. Stream discharge was greatest during this time and a few days later it was noticed that snow had ablated from the glacier snout, leaving regelation ice, with a softer, wet snow surface higher up the glacier. Thus the calculated and the stake measurements of gross ablation, are in good accordance with the response of the snow surface and the net ablation measured as stream discharge.

Fig. 10. Ablation on Mir Samir West Glacier, 9–10 August 1965.
The Heat Balance
The total heat involved at the glacier surface over 23 periods of 30 min is shown in Figure 11 and summarized in Table III. The net radiation, as expected, was the dominant source of heat; Reference UntersteinerUntersteiner (1957, p. 157) found radiation supplying 88% of the heat responsible for ablation of firn at 4 000 m on Chogo Lungma Glacier. With the onset of warm moist air over the glacier surface, e.g. from 08.00 to 10.30 h on 10 August (Fig. 6) the heat given to the surface by condensation became rather more important than the average conditions indicated. From the meteorological record (Fig. 6) this invasion by warm moist air occurred during eight of the 30 days observed. For the whole summer, the heat of condensation would be lower and of evaporation higher than shown in Table III but, because of the high latent heat, the loss by evaporation is small. Again, for the whole summer, the snow must be a heat sink only, most of the heat to raise the snow to 0°C being supplied by refreezing of percolated melt water.
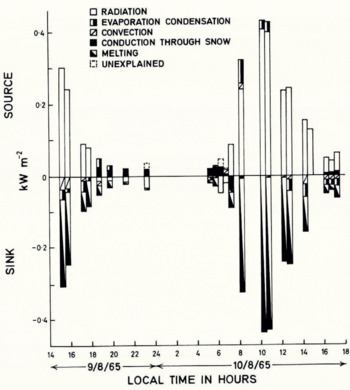
Fig. 11. Heat balance on Mir Samir West Glacier, 9–10 August 1965.
Table III Percentage Source and Sink of Heat Evaluated at Glacier Surface. 9–10 August 1965

In the Panjshir region the dominant source of water for human and agricultural use through the dry summer is from melting snow at successive heights. Before the end of the summer only a few small glaciers remain in steep-walled mountain basins protected from the south. Melting from these small natural reservoirs helps to offset the aridity of late summer and autumn. Increasing this melt water by argificial darkening of the glacier surfaces is very possible but it would be dangerous and expensive by aircraft and very demanding on human labour by any other means, since silt would have to be man-packed from lakes and accumulation basins a few hundred metres below the glaciers. Such interference is undesirable since the glaciers are already receding, so increasing their ablation would accelerate glacier shrinkage and remove these natural reservoirs.
Rapid run-off is a far greater problem but the narrow steep-sided valley of the Panjshir river offers suitable sites for dams. Many small settlements high in the valley could be served by small dams across some of the tributary valleys but areas of flat land suitable for agriculture are more scarce than water.
Acknowledgements
For financial support the authors are much indebted to the University of Newcastle upon Tyne, the Natural Environment Research Council, the Mount Everest Foundation, the Royal Geographical Society, the European Office of Sciengific Research for the United States Army, and many business and industrial concerns in northern England.


