


1. Introduction
The turbopause is a demarcation between regions in the atmosphere characterised by different mixing processes. Below, the homosphere, turbulence dominates, whereas above, the individual constituents are distributed according to their respective scale heights. Since ionisation creates different species (such as atomic oxygen) at different heights, an elevated turbopause will result in mixing of these components downwards affecting the mesospheric chemistry such as hydroxyl. In turn, species such as water vapour and hydroxyl can be mixed to similarly elevated heights affecting the ion chemistry. For an introduction to the basics of turbulence applicable to this study, the reader is referred to Batchelor (Reference Batchelor1953). The method for extracting turbulence parameters from ground-based radar is described by Briggs (Reference Briggs1980), and to facilitate this we employ data from the 2.78 MHz medium frequency radar (hereafter MFR) at Ramfjordmoen in northern Norway at 70°N, 19°E. The system has been described fully by Hall (Reference Hall2001). Hitherto, the most recent study of the available time-series is described by Hall et al. (Reference Hall, Holmen, Meek, Manson and Nozawa2016); this furthermore contains an exhaustive reference list and is the de facto reference for the method and description of underlying physics for this study; Weinstock (Reference Weinstock1978) is an underlying study and deserves specific mention.
2. Method and results
The 2.78 MHz medium frequency radar MFR) at Ramfjordmoen (70°N, 19°E, Hall, Reference Hall2001) transmits through a 4x4 crossed dipole array, and therefore illuminates structures in refractive index, dominated above the radar by corresponding structures in electron density (i.e. the ionospheric D-region). The geographic location is beneath the auroral oval and therefore a degree of ionisation extending to as low as 70 km altitude is not uncommon. Reflections from these structures give rise to an interference pattern on the ground which is subsequently recorded by simple equi-spaced inverted-V antennas connected to the receivers. Cross-correlations between signals from these receivers provide information on horizontal winds that cause the reflecting structures to drift through the radar beam. Autocorrelations indicate backscattered power. The backscattered power, however, fades with time as the scatterers change shape and/or become less distinct as they drift through the radar beam. Several mechanisms might cause this fading, but a common prime one is considered to be neutral turbulence (e.g. Briggs, Reference Briggs1980). Thus, by determining the characteristic fading times of the autocorrelations, it is possible to estimate turbulent intensity - or in fact an upper limit for it (since other mechanisms may be present) – which is parametrised by the energy dissipation rate, ε´ (the prime being used to differentiate between this determination and the actual dissipation rate, ε). At the same time, kinematic viscosity increases with altitude due to decreasing density, and at a certain height, energy dissipation due to viscosity, εmin, equals that due to neutral turbulence; this can be thought of when inertial forces equal viscous forces, i.e. when the Reynolds number Re is unity. This condition, the intersection of the εmin, and ε, profiles defines the turbopause. The reader is referred to Fukao et al. (Reference Fukao, Yamanaka, Ao, Hocking, Sato, Yamamoto, Nakamura, Tsuda and Kato1994), Hall et al. (Reference Hall, Holmen, Meek, Manson and Nozawa2016), Weinstock (Reference Weinstock1984) and references therein for an in-depth description of turbulent energy dissipation rate estimation and thereafter turbopause identification.
The results are shown in Figure 1. Turbulent intensity is indicated below the turbopause in the vicinity of 105 km. The distinct seasonal variation is due to gravity wave saturation and breaking being more evenly distributed though the mesosphere in winter, whereas breaking is more concentrated immediately above the mesopause in summer when temperature gradients are steep. Again the atmospheric physics is fully described in references to be found in Hall et al. (Reference Hall, Holmen, Meek, Manson and Nozawa2016). Figure 2. Illustrates the turbopause altitude alone, here with a 30-day smoothing applied to enhance clarity. Earlier analyses of this dataset had identified possible trends; two possible candidates, identified by simple inspection are highlighted (1996–2001 and 2001–2005), but if we consider the entire series from 1996 to 2021, there is no convincing trend to be seen, although the determined value of 0.68 km decade−1 does indeed exceed the 2-σ uncertainty. For the individual segments and the entire series, the 95% confidence limits (Working & Hotelling, Reference Working and Hotelling1929) are indicated by dotted hyperbolae.
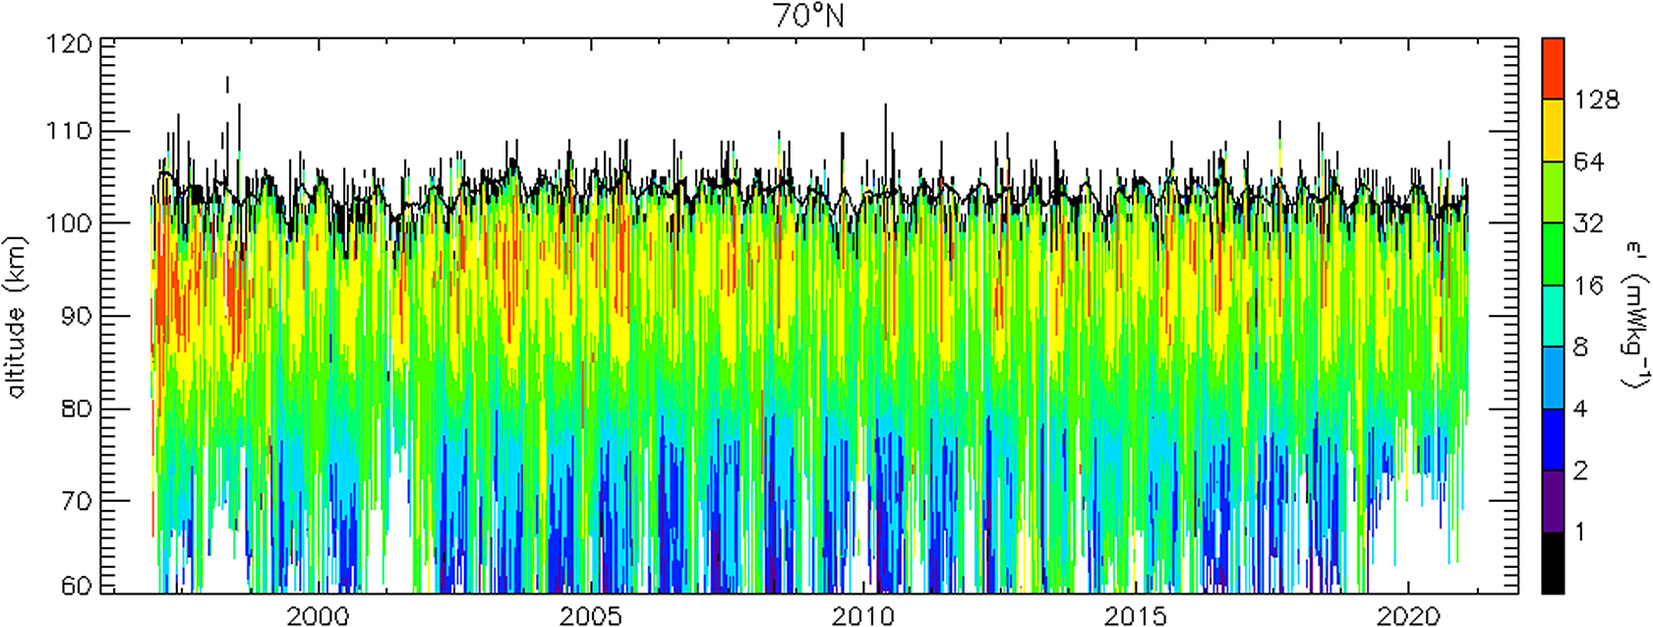
Figure 1. Turbulent intensity from Northern Norway (70°N, 19°E) (upper limits – see main text). Thick line shows turbopause.
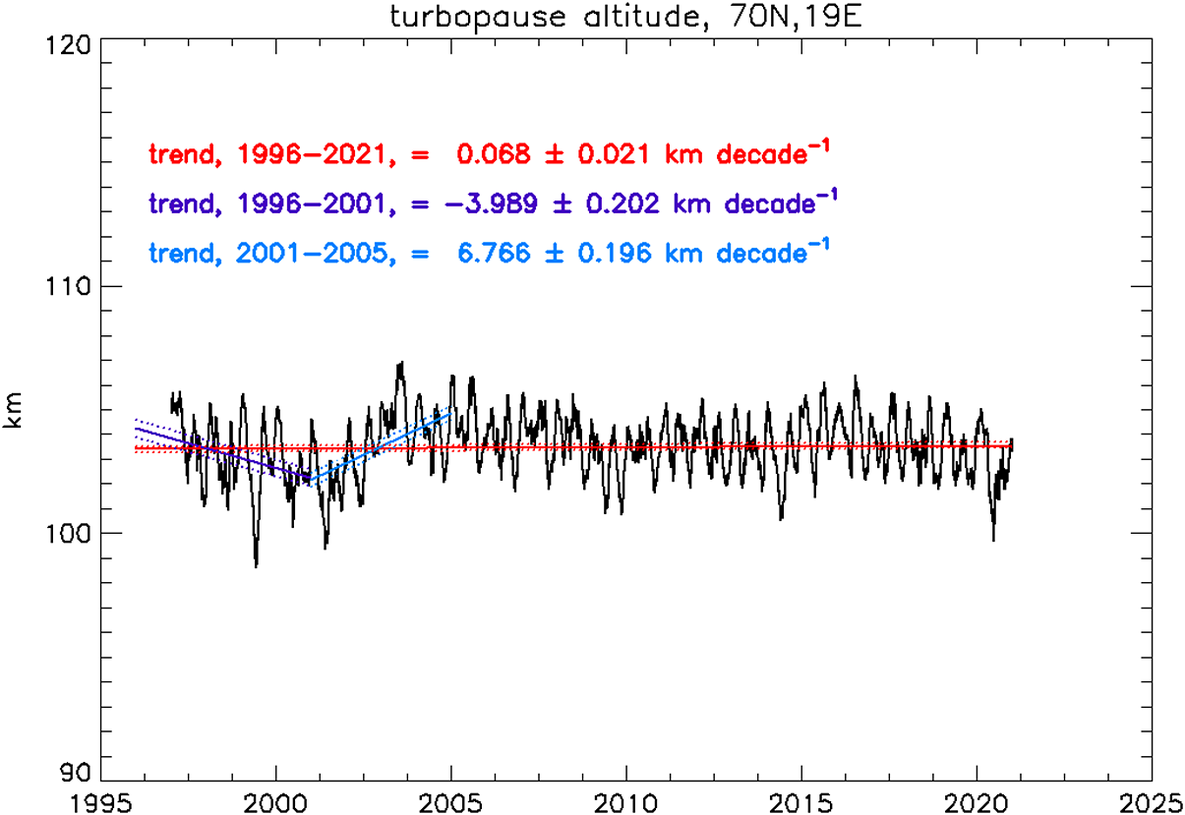
Figure. 2. Turbopause estimate over Northern Norway (70°N, 19°E). Purely from visual evaluation, two periods of change are identified: 1996–2001 and 2001 to 2005, and trendlines are fitted to these and to the entire period. Trends are indicated in the annotation on the plot and dotted hyperbolae indicate the 95% confidence limits.
3. Conclusion
While earlier examinations of data from the Ramfjordmoen MFR suggested trends which could be attributed to climate change in the underlying neutral atmosphere, this latest review of the entire timeseries from 1996 to 2021 (time of writing) suggests stability of the turbopause altitude with little significant variation, viz. 1.7 km over the last quarter of a century. In some ways, the result is surprising: kinematic viscosity and therefore the minimum energy dissipation sustained by the atmosphere, εmin, is proportional to temperature2/3 (e.g. https://en.wikipedia.org/wiki/Viscosity and Fukao et al., Reference Fukao, Yamanaka, Ao, Hocking, Sato, Yamamoto, Nakamura, Tsuda and Kato1994); ε´ is proportional to tempertature-1/2 (Weinstock, Reference Weinstock1978). Combined, these dependencies imply that increasing temperatures will tend to depress the turbopause and vice versa. However, the turbopause is located in a region of transition between summer and winter mesopauses, and therefore steep negative and positive temperature gradients. The recent stability of the turbopause is therefore simply reported here and relationships to upper atmosphere temperature trends left to deeper investigation.
Acknowledgments
The medium-frequency-radar (MFR) providing results for this study is partly owned by The University of Saskatchewan, Canada. In particular the authors thank Chris Meek for original provision of software and thereafter constant monitoring of the radar resulting in a nearly uninterrupted timeseries.
Funding information
This research employed resources provided solely by UiT – The Arctic University of Norway.
Conflict of interest
The authors declare no conflicts of interest.
Data availability
Data-files are available at http://radars.uit.no/mfrdata/YYYY/rtwYYYYDDD.dat, where YYYY is the year and DDD the day-number, e.g, http://radars.uit.no/mfrdata/2020/rtw2020354.dat. After 2021, the format changes to http://radars.uit.no/mfrdata/YYYY/rtwYYYYMMDD.dat, the date being specified by YYYYMMDD, denoting year, month and day-of-month. The files are binary and users are invited to contact the author for assistance with software. The site was accessed on 10th February 2021.
Author contributions
The MWR system is operated by CMH, and jointly owned by UiT – The arctic University of Norway, Nagoya University (SN) and The University of Saskatchewan.


 Open access
Comments
Comments to the Author: This experiment can be an important contribution to the Aeronomy community, I am looking forward to seeing the following work to be published as a whole paper