Modern democracy turns on the proposition that voters punish incumbents for costly policy choices. For example, voters might reward politicians for economic growth (MacKuen et al., Reference MacKuen, Erikson and Stimson1992), for distributive favours (Dahlberg and Johansson, Reference Dahlberg and Johansson2004) or for legislative action (Loewen et al., Reference Loewen, Koop, Settle and Fowler2014). However, this relationship is rarely perfect. For example, voters have been shown to punish and reward incumbents for things obviously beyond their control (Achen and Bartels, Reference Achen and Bartels2004; Healy et al., Reference Healy, Malhotra and Mo2010). In large part, the extensive literature on the relationship between war casualties and support for incumbents acts as a test of this central tenet. The results we present in this article call into question the proposition that voters necessarily punish incumbents for the negative results of their foreign policy decisions.
Wars are costly, not only in terms of lives and money but also often in terms of votes. There is a large literature from the American case showing that incumbents tend to be punished for war casualties. In this article, we present evidence from a neighbouring case suggesting that this is not always so. We use as our case study Canada's war in Afghanistan. Canada's engagement in Afghanistan surpassed a decade and extracted a great cost in both dollars and lives, with 158 lives lost, and many more people injured permanently. It is the country's most significant military undertaking since the Korean War (Stein and Lang, Reference Stein and Lang2007). On a per capita basis, this represents 4.5 deaths per million citizens in Canada. This number pales in comparison to both the First World War (8,222 deaths per million citizens) and the Second World War (3,727 deaths per million citizens). It is approximately one-ninth the per capita deaths in Korea (34 deaths per million citizens). By these measures, the war in Afghanistan was a modest undertaking. But this ignores that Canada has engaged in an important role in at least four other interventions (Kosovo in 1999, Bosnia in 1995, Somalia in 1995 and the Persian Gulf in 1991) in which the total number of Canadian casualties was 21. Moreover, Canada's contribution to the total effort in Afghanistan was substantial. Canadian deaths account for 4.4 per cent of all non-Afghan security forces deaths experienced by the International Security Assistance Force (ISAF). On a per capita basis, Canada's 4.5 deaths per million citizens is more than all other ISAF countries except the United States (7.8) and the United Kingdom (7.4). Finally, in modern warfare, most countries do not suffer major casualties in most wars (Cederman, Reference Cederman2003). Canada's involvement in Afghanistan thus provides a clear opportunity to test whether governments in a modern context are necessarily punished for the costs of foreign policy decisions, not least because of the incumbent government's consistent support for the war.
We find no evidence that voters punished candidates of the then incumbent party in Canada for the loss of soldiers from their constituency. To the contrary, voters in constituencies experiencing a war death increased their support for the then governing party in their first election as incumbents (2008). Despite a markedly higher casualty count by the time of their next election as incumbents (2011), we find no evidence of decreased support for the government in constituencies that experienced war deaths. Indeed, we find further evidence of increased support among individual survey respondents and more weakly at an aggregate level.
There may be some discussion about the culpability of leaders or political parties when it comes to Canada's war in Afghanistan. The Liberal party was in government when the war started; the Conservative party took office in 2006, several years into the war—which is where our analysis starts—and remained in power until 2015. The question is whether voters see as culpable the leader or party that started the war (in this case the Liberals) or the leader or party in government at the time these voters are making decisions at the ballot box. Croco (Reference Croco2015) argues that casualties can be particularly costly to a leader if that leader is the one who started the war but that if there is a change in leadership, this dynamic of culpability will also change.
The details of the case matter here. The Liberals and Conservatives had similarly supportive positions on Afghanistan in the run-up to both the 2008 and the 2011 federal elections. While it is certainly the case that the war started under a Liberal government, the Conservative government made policy choices before the 2008 election that make it difficult to ignore its culpability—for example, the decision in March 2008 to extend the mission.Footnote 1 We are not arguing that the Conservatives are as responsible for the war as they would have been had they been in power since the start of the war. Nonetheless, it is the case that the execution of the war occurred under policy choices made by a Conservative government, in a parliament in which they were the agenda setters. Accordingly, we think our study provides a compelling case of whether an incumbent is punished when they are the principal responsible for their country's involvement in a war abroad.
Our findings contribute to the literature on the relationship between war deaths and government support. In the context of voting behaviour in parliamentary systems, there is a long-standing debate over the importance of foreign policy for decision making at the polls. In the American case, where war casualties are thought to matter, there is a well-established (see, for example, Gartner and Segura, Reference Gartner and Segura1998; Hibbs, Reference Hibbs2000; Karol and Miguel, Reference Karol and Miguel2007; Mueller, Reference Mueller1973) but now contested (Berinsky, Reference Berinsky2009) negative relationship between war casualties and incumbent support. We find much the opposite in the Canadian case.
1. Literature
Citizens in democracies regularly respond to war deaths both by decreasing their support for a war effort and by decreasing their support for an incumbent (Cotton, Reference Cotton1986; Gartner, Reference Gartner2008; Gartner and Segura, Reference Gartner and Segura1998, Reference Gartner and Segura2008; Gartner et al., Reference Gartner, Segura and Barratt2004; Mueller, Reference Mueller1973). So pervasive is this effect that some have claimed that the domestic electoral costs of war—not least in the form of casualties—explain the empirical regularity of the democratic peace (de Mesquita and Siverson, Reference de Mesquita and Siverson1995; Karol and Miguel, Reference Karol and Miguel2007).
Previous work on casualty and government support leaves open three essential questions. First, there exists substantial debate over how and when war deaths decrease support for a candidate of the governing party. For example, Mueller (Reference Mueller1973) posited an effect where the cumulative logged casualties slowly decrease support for a war. Gartner and Segura (Reference Gartner and Segura1998) countered by suggesting that the effects of death on support were a function both of recent trends and the overall trajectory of casualties. This account has been updated into a convincing rational expectations account (Gartner Reference Gartner2008). However, both Berinsky (Reference Berinsky2009) and Gelpi et al. (Reference Gelpi, Feaver and Reifler2006) provide compelling counterpoints to this literature, essentially arguing that the negative effects of war deaths are contingent on larger beliefs about the justification and ongoing success of a war. Nevertheless, none of these suggest a positive effect for war deaths. Second, the literature leaves open the question of which deaths matter. Is it solely national trends, or does the geographic origin of those killed also matter? Our own reading is that while casualty rates most certainly matter for overall opinion on a war, local deaths also have a measurable effect. For example, Karol and Miguel (Reference Karol and Miguel2007) suggest that the localized effects of deaths in Iraq cost George W. Bush about two percentage points in the 2004 election. Similarly, Grose and Oppenheimer (Reference Grose and Oppenheimer2007) have shown that swings in congressional votes for Republican candidates were significantly influenced by both deaths of hometown soldiers and the votes of representatives on the original war resolution. The final question, which in our view is much less resolved, is whether such effects travel beyond the United States. It seems logical that the results from America would travel. See, for example, the work of Davies and Johns (Reference Davies and Johns2013) in the United Kingdom. However, this needs to be subject to more tests in other countries. In other words, the literature suggests a strong prior, in which deaths extract a (potentially local) cost on governments, though we note important caveats (Berinsky, Reference Berinsky2009; Gelpi et al., Reference Gelpi, Feaver and Reifler2006). Empirically, we find very different results.
2. Data, Variables and Empirical Strategy
The measures used in previous work on support for war can be divided into two categories. In the first, researchers examine approval of a war or of the current head of government (for example, Gartner and Segura, Reference Gartner and Segura1998). In this sense, such measures are capturing whether individuals support a particular effort and/or the political leader undertaking the effort. These measures could include casualty tolerance, support for long-term engagement or support of a leader's decision to go to war. Most importantly, these measures represent opinions and likely suffer from all of the well-known and attendant problems of survey measures (Zaller, Reference Zaller1992). In the second case, researchers examine how war affects the vote shares of a governing party or governing representatives (for example, Karol and Miguel, Reference Karol and Miguel2007). This is the approach we take. Elections act as a definitive distillation of voters’ judgments of their politicians and their actions. While all issues will not enter a voters’ calculus evenly, and some may be forgotten by the time of an election, an issue that does not systematically vary votes can probably not be expected to systematically constrain the behaviour of politicians for very long. In making this choice, we do not wish to suggest that previous work on approval and opinion has not taught us a great deal about the relationship between war efforts and approval. Quite the contrary: such studies have made substantial progress. Our wish instead is to extend this work to a case where we can actually evaluate the success of a government fully engaged in a war effort, a prospect that is more difficult than one might assume, given how many leaders exit during wartime (Karol and Miguel, Reference Karol and Miguel2007).
To measure the effects of war efforts on electoral support, we make use of two different dependent variables. First, we observe individual-level vote choice, as measured in the 2006, 2008 and 2011 Canadian Election Studies. Second, we use official district-level (or constituency-level) election returns in the 2008 and 2011 Canadian federal election. As we show in our results section, we find that war deaths exert an effect on both of these measures in 2008 and partially in 2011, though never in a direction that suggests the punishment of incumbents.
We collected data on the incidence of Canadian casualties in Afghanistan since the beginning of the conflict in 2002.Footnote 2 For each death, we identified the hometown of the dead solider, as reported by the government and in media sources, and the constituency that encompassed that hometown. For the present study, we limit our analysis to deaths that occurred during the Harper Conservative government's first two terms in office, a period from January 2006 to October 2008 and October 2008 to May 2011, respectively. In total, deaths occurred in 65 constituencies. Fifty-four constituencies experienced one death, nine experienced two, and two experienced three. This represents a total of 78 deaths. There were zero deaths in 241 of the constituencies we consider. In the period from October 2008 to May 2011, we observe deaths in 46 constituencies, with 35 experiencing one casualty, six experiencing two, and three experiencing three. This represents a total of 56 deaths.
For the period from 2006 to 2008, our individual-level data consist of 854 respondents in the 2008 Canadian Election Study (CES) who also participated in the 2006 CES and for whom we have a reported vote choice in both elections. We limit our analysis to this subset, as we are interested in measuring the effects of war deaths between elections on vote choice, controlling for previous vote choice. We note that panel attrition is unrelated to deaths in the respondent's constituency (χ 2 = 1.07, p = .30). Nearly one-quarter of respondents (23.9%) lived in a constituency that experienced a death. We matched respondents to their constituency according to their postal code and could thus match war deaths to respondents. Finally, in addition to basic demographics, we also know the party identification of respondents and their vote choice in 2006 and 2008. Accordingly, we present panel estimates of the probability of an individual voting for the current government if they are in a constituency that experienced a casualty, controlling for their partisan identification and their previous vote. As we are using panel data, we do not control explicitly for other demographic variables.
Our aggregate constituency-level data from 2006 to 2008 include electoral returns from 306 of Canada's 308 constituencies. Constituency boundaries did not change between the 2006 and 2011 elections, so we can calculate changes in Conservative vote share between elections, given the incidence of a casualty originating in the constituency. In addition to vote data, we also have a large amount of census data on the characteristics of these constituencies. We employ these data to refine our estimates below.Footnote 3
For the period of 2008 to 2011, our individual-level data include 629 respondents who participated in both the 2008 and 2011 CES and have available vote choice data. Fourteen per cent (13.7%) of these respondents lived in a constituency that experienced a casualty between 2008 and 2011.
Our aggregate-level constituency data from 2008 to 2011 include returns from 306 constituencies.Footnote 4
3. Results
We begin with two sets of individual-level results in Table 1. For each, we specify an ordinary least squares (OLS) model in which the dependent variable is a vote for the governing Conservative party (1) or a vote for any other party (0). We estimate the model with robust standard errors, clustered on electoral district. The first results in Table 1 suggest that the linear probability of voting for a Conservative local candidate increases by six percentage points (p = .09) if the constituency experienced a war death prior to the 2008 election.
Table 1 War Deaths and Individual-Level Support for Government Candidates in 2008

Note: The dependent variable is Conservative party vote in the 2008 Federal election; cell entries are coefficients and p value from an OLS regression with clustering of standard errors on the electoral district; p values in parentheses.
In Model 2, we estimate a model with more control variables—namely, indicators for Conservative party identification and other party identification. Second, we include a dummy variable indicating if the individual resides in one of the seven constituencies in the province of Newfoundland and Labrador.Footnote 5 This second set of results suggests that the linear probability of voting Conservative net other factors is 7 percentage points greater (p = .05) in constituencies that experience a casualty.
Aggregate-level results largely confirm our individual-level findings. We present three sets of results in Table 2. We begin with a simple bivariate regression between the occurrence of deaths since 2006 and Conservative support in the 2008 election, controlling for vote share in the 2006 election. In Model 2, we add in a fixed effect for the province of Newfoundland and Labrador. In Model 3, we add in a series of demographic covariates observed at the census level. Election outcomes regularly covary with constituency-level characteristics (Carty and Eagles, Reference Carty and Eagles2005) and other local characteristics (Allen Stevens et al., Reference Allen Stevens, Islam, de Geus, Goldberg, McAndrews, Mierke-Zatwarnicki, Loewen and Rubenson2019). While our first estimates suggest no effect and our second estimates suggest an effect with statistical uncertainty, our third set of results suggest that the experience of casualties in a constituency increased support for the government's candidate by 1.69 percentage points over their 2006 performance (p = .03).
Table 2 War Deaths and Aggregate-Level Change in Support for Government Candidates, 2006–2008

Note: The dependent variable is the percentage point change in the Conservative party vote at the district level between the 2006 and 2008 federal elections; cell entries are OLS coefficients and p value; p values in parentheses.
These results rely, in part, on demographic correlates. However, two comments are warranted. First, the results are almost certainly enough to reject the hypothesis that war deaths decrease support of the governing party. Second, they are largely consistent with the results we have uncovered at the individual level. In one country and in one election, at least, it appears that war deaths over a sustained period of time increased support for the governing party.
4. A Replication with 2011 Election Data
At least one popular account of the relationship between war deaths and government support (Hibbs, Reference Hibbs2000) argues that politicians are punished only for wars of discretion. In the case of the then Conservative government in Canada, they inherited the war in Afghanistan from the previous Liberal government. Accordingly, any deaths in the period running up to the 2008 election could be reasonably attributed to the previous Liberal government, including their decision to move Canadian troops from Kabul to a much more dangerous theatre in Kandahar.Footnote 6 However, in the period following this, the Conservative government made an explicit choice to maintain forces in Afghanistan. As such, while punishment may have been avoided in 2008, it should not be easily escaped in 2011. However, we again fail to uncover evidence of voters punishing the incumbents, instead finding weak evidence for reward. We present our results in Tables 3 and 4.
Table 3 War Deaths and Individual-Level Support for Government Candidates in 2011

Note: The dependent variable is Conservative party vote in the 2008 Federal election; cell entries are coefficients and p value from an OLS regression with clustering on the electoral district; p values in parentheses.
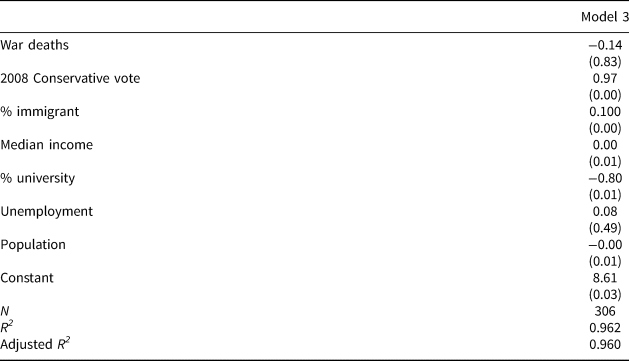
Table 4 War Deaths and Aggregate-Level Change in Support for Government Candidates, 2008–2011

Note: The dependent variable is the percentage point change in the Conservative party vote at the district level between the 2006 and 2008 federal elections; cell entries are OLS coefficients and p value; p values in parentheses.
Table 3 replicates our individual-level results. Our replication estimates suggest that the linear probability of voting for a Conservative candidate is 10 percentage points (p = .00) higher for those who live in constituencies that experienced a death than those who did not. When we include other relevant controls, the estimated effect is 7 percentage points (p = .03).
Our aggregate results can be found in Table 4. Our estimates range from a 0.68 percentage point increase in our model controlling for past vote share and Newfoundland and Labrador districts, to 1.21 percentage points (p = .15) with more extensive controls. Nonetheless, we can estimate the probability that the true effect is negative. A conventional F test of the likelihood of different values on the deaths coefficient estimates that the probability that the true effect of deaths is −.5 percentage points, or more negative, is .04. The probability that the effect of a death is −1 percentage points, or more negative, is .01. Finally, the probability that the true effect of a death is −2 percentage points, or more negative, appears infinitesimal at >.000.Footnote 7
5. Robustness Checks
Our findings are subject to potentially serious unobserved heterogeneity. It may be the same constituencies that are likely to send soldiers to war are those that are naturally more inclined to increase support for the Conservative party. To explore whether unobserved variables are driving both war deaths and increases in incumbent support, we re-estimate our models with deaths after the election (Tables 5 and 6).
Table 5 Individual-Level Robustness Checks with Deaths since 2008 Election

Note: The dependent variable is Conservative party vote in the 2008 Federal election; cell entries are coefficients and p value from an OLS regression with clustering on the electoral district; p values in parentheses.
Table 6 Aggregate-Level Robustness Check with Deaths since 2008 Election

Note: The dependent variable is the percentage point change in the Conservative party vote at the district level between the 2006 and 2008 federal elections; cell entries are OLS coefficients and p value; p values in parentheses.
The logic here is that if war deaths and increased support for Conservative candidates are both correlated with some unobserved characteristic of electoral districts, there should also be a correlation between increased vote share and deaths after the election (see Healy et al., Reference Healy, Malhotra and Mo2010, for a similar placebo test). The attribution of effects to war deaths in our data would thus be incorrect. However, as we show in Tables 5 and 6, we find no significant relationship between deaths after the election and growth in Conservative support in the election.
The point estimate for this variable is negative in all the aggregate models and never approaches conventional levels of significance. At the individual level, the point estimates are positive but feature very large p values (.84 in Model 1 and .51 in Model 2). Accordingly, the results reported in section 3 above do not appear to be due to unobserved heterogeneity.
We have also confirmed our 2008 individual-level results in a matching framework. We used a nearest-neighbour matching algorithm that matched on vote in 2006, gender, year of birth and partisan identification. The results (Table 7) suggest a large increase in the linear probability of voting Conservative when in a constituency that has experienced war deaths. The average treatment effect of a war death is some 9.1 percentage points (p = .014). This is largely consistent with the results presented above in section 3.
Table 7 Individual-Level Matching Estimates

Note: Nearest-neighbour propensity score matching, matched on vote in 2006, gender, year of birth, and partisan Identification. There is only one match per observation.
6. Conclusion
Conventional wisdom, as well as much previous research, holds that incumbents are affected negatively by war deaths; that is, as casualties increase, support for the war effort and support for government incumbents decrease. This is sometimes considered a constraint on the ability of leaders to wage war. The specific case of voters punishing incumbents for war casualties can be thought of as an instance of the more general proposition that in democracies voters hold incumbents responsible for the negative outcomes of policy choices. This is a central assumption in the theory and the empirical study of representative democracy (Fiorina, Reference Fiorina1981) but one that has come under sustained scrutiny more recently (Achen and Bartels, Reference Achen and Bartels2017; Healy et al., Reference Healy, Malhotra and Mo2010). Understanding how war deaths are punished or not, then, has important implications for a large set of questions in political science.
In this article, we demonstrate that the experience of local war deaths is associated with greater incumbent voting in Canadian electoral districts. Indeed, we have demonstrated that the finding emerges at an individual level in two successive elections. The pattern is also evident at the constituency level. Moreover, by leveraging the exogenous timing of deaths, we have demonstrated that this increase is not likely attributable to unobserved differences between individuals or constituencies being jointly correlated with the incidence of deaths and the likelihood of voting for the incumbent party.
It is an open question why we observe these positive effects. We advance for discussion two possible explanations. It could be, in keeping with the findings of Fletcher and Hove (Reference Fletcher and Hove2012), that while casualties are associated with sorrow, they also evoke pride in respondents. Such pride increases support for military engagement over peacekeeping. It might also be expected to increase the support of leaders who seek to “own” the issue of support for the military and military interventions (but see Soroka et al., Reference Soroka, Loewen, Fournier and Rubenson2016). Certainly, this characterized Stephen Harper's position vis-à-vis his opponents. We think this is broadly consistent with “rally round the flag” effects. Better understanding how deaths were portrayed in the media and experienced locally is key to examining this possibility, as are survey measures that might directly tap such emotional responses. Second, it may well be that our observations reflect leadership priming effects, in one time and place. Because Stephen Harper took an ownership position on Afghanistan, it may be that deaths increased Conservative vote share by increasing the importance of leadership considerations in districts that experienced a death. Both of these possibilities offer avenues for future research.
Three important questions are left open by the literature on the effects of war casualties on incumbent support: (1) How do war deaths decrease support? (2) Which deaths matter? (3) Do these effects travel beyond the United States? In this article, we have focused on the latter two questions. Our results indicate scant support for the proposition that war deaths decrease the probability of voting for the government candidate. Indeed, we show that voters living in constituencies experiencing a war death were more likely to vote for the governing party.
The findings reported here from the Canadian case present an empirical puzzle in two senses. First, local support for government party candidates was increasing with local casualties while national support for the mission in Afghanistan was declining. Second, the Canadian results presented here are inconsistent with those found in similar studies in the United States. Both of these speak to the first question above—that of how war deaths affect opinion and voting behaviour. At the very least, our findings indicate, contrary to previous work, that voters do not always punish government candidates for war deaths. They may even increase support for incumbents.
Appendix
Models with Province Fixed Effects
Table A1 War Deaths and Individual-Level Support for Government Candidates in 2008
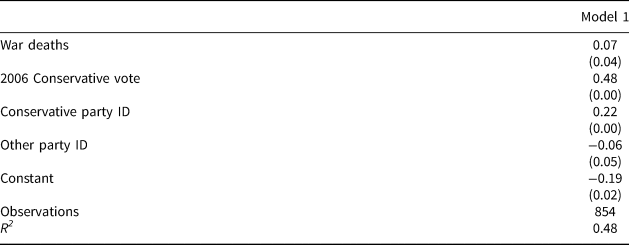
Table A2 War Deaths and Aggregate-Level Change in Support for Government Candidates, 2006–2008
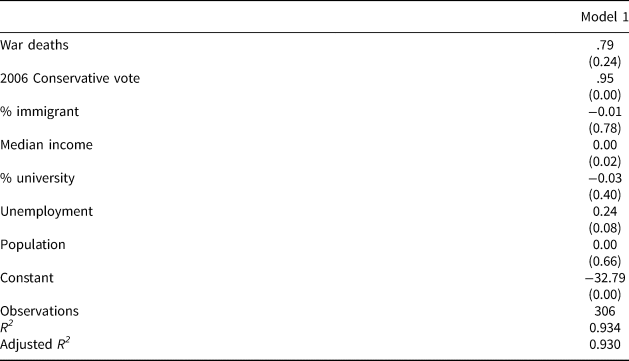
Table A3 War Deaths and Individual-Level Support for Government Candidates in 2011
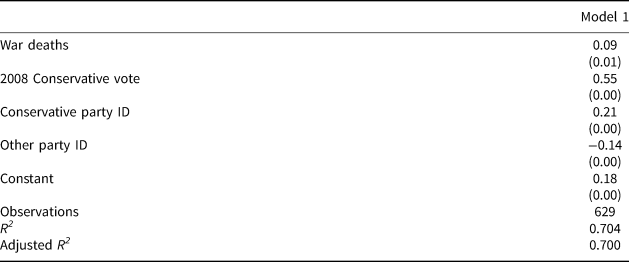
Table A4 War Deaths and Aggregate-Level Change in Support for Government Candidates, 2008–2011