


INTRODUCTION
Natural systems are characterised by seasonal and interannual variability. The Arctic region has witnessed strong environmental changes especially in the last two decades (Isaksen and others, Reference Isaksen2016; Osuch and Wawrzyniak, Reference Osuch and Wawrzyniak2017). One of the major concerns about warming observed in the Arctic is its impact on snowfall and snow cover. In the high Arctic on the Svalbard Archipelago, air temperature, precipitation, strong winds, and winter thaws are the factors that mostly influence snow cover (Callaghan and others, Reference Callaghan2011). In this area, temporal variations of seasonal snow cover, and the duration and timing of snow accumulation and snowmelt induce feedbacks on many environmental components, and are crucial factors in the yearly cycle of land ecosystems (Bindoff and others, Reference Bindoff, Stocker, Qin, Plattner, Tignor, Allen, Boschung, Nauels, Xia, Bex and Midgley2013).
Detailed descriptions of the most significant snow-related research conducted in Svalbard have been presented by Winther and others (Reference Winther2003), and more recently by van Pelt and others (Reference Van Pelt2016). Extensive data quantifying snow conditions have been collected in recent decades. Snow monitoring data come from many sources, including meteorological stations, glacier mass-balance stakes, snow pit profiling, ice core measurements, radar profiles and modern remote-sensing methods such as satellite imagery (Armstrong and Brun, Reference Armstrong and Brun2008; van Pelt and others, Reference Van Pelt2016). Point measurements remain the main available source of information throughout the year in polar areas where limited daylight in winter and high average percentage of cloud cover hamper the usage of other modern optical techniques.
Snow depth is currently measured at a few meteorological stations in Svalbard: Hornsund Polish Polar Station, Barentsburg, Longyearbyen and Ny-Ålesund. The available time series are short from statistical point of view, and contain many discontinuities and inhomogeneities due to changes of station locations, and potentially, changes occurring in the neighbourhood of the stations that are not associated with climate (such as human activity). Due to data availability and data inhomogeneity the analysis was carried out over the period 1 August 1984–31 July 2016. Snow depth observations at Longyearbyen are available for two periods: 1 August 1984–31 March 1994 and 1 August 2008–31 July 2016, with the amount of missing data higher than 45% in the analysed period. The most incomplete record is at Ny-Ålesund where missing data constitute more than 81% of the studied period. This dataset is available only beginning in August 2008. The analysis in this study was therefore carried out for Hornsund and Barentsburg only. In Svalbard, local-scale snow accumulation is governed by wind, topography, snow drift redistribution, and sublimation (van Pelt and others, Reference Van Pelt2016). These factors together with sparsely spatially distributed observations make it difficult to use point observations of snow depth to produce a broader representation and identification of trends in snow cover.
Snow depth observations from in situ measurements remain highly valuable for studying the local-scale development of snow cover and were studied in Spitsbergen by Mietus (Reference Mietus1991), Winther and others (Reference Winther, Bruland, Sand, Killingtveit and Marechal1998), Bruland and others (Reference Bruland, Sand and Kilingtveit2001), Bruland and others (Reference Bruland, Liston, Vonk, Sand and Killingtveit2004), Luks and others (Reference Luks, Osuch and Romanowicz2011), Marsz and Styszyńska (Reference Marsz and Styszyńska2013), Aas and others (Reference Aas2016). These papers usually present results for a single station for short periods of time. Van Pelt and others (Reference Van Pelt2016) presented multidecadal snow conditions in Svalbard in years 1961–2012 using simulations from the SnowModel snowpack model and the HIRLAM regional climate model.
In light of the significance of snow cover, it is important to understand interannual snow depth variations. The main objective of this study is to diagnose, detect, and understand the temporal patterns in snow depth including onset and disappearance date, snow-cover duration and maximum depth using in situ observations from two meteorological stations located along western Spitsbergen. In particular, we focus on the analysis in changes of seasonal variation of snow depth. For this purpose the newly proposed tool ‘Moving Average over Shifting Horizon’ (MASH; Anghileri and others, Reference Anghileri, Pianosi and Soncini-Sessa2014) was applied. Application of the MASH method allows for reduction of day-to-day variability of snow depth, improving our ability to conduct trend analysis at finer (e.g. weekly or daily) timescales. The MASH method was supplemented by trend analysis using the Mann–Kendall method.
In addition, we compare the temporal variability of snow depth and four snow-cover indicators between the two stations with the longest time series of snow depth in Spitsbergen. This approach provides a direct and detailed view of what the in situ observations and point measurements can tell us about trends in snow cover on Spitsbergen.
STUDY AREA AND DATA
The main dataset used in this analysis includes daily data from two meteorological sites located in Spitsbergen in the European part of the Arctic (Fig. 1). The Polish Polar Station Hornsund (77°00′N, 15°33′E) is situated at Hornsundfjord in the SW of Spitsbergen at 10 m. a.s.l. The Russian Barentsburg station (78°04′N, 14°13′E) is located at Grønfjorden at 74 m a.s.l. Both stations are operating within World Meteorological Organization (WMO) with numbers 01003 (Hornsund) and 20107 (Barentsburg), and point measurements of snow are conducted similarly at both stations. Depth measurements of snow cover on the ground are taken with a snow ruler, which is pushed down through the snow to the ground surface. A number of measurements are taken and averaged at each observing station since the snow cover drifts and is redistributed by wind.

Fig. 1. Study area.
Snow depth measurements have been conducted at a meteorological station in the Russian settlement Barentsburg located 2.5 km to the north of Green Harbour since 1933. Although the meteorological measurements began then, on 1 February 1984 the meteorological site was moved to a new location. The measurements have been continued there until present, so for the purpose of this paper the dataset beginning in August 1984 was used. Data have been downloaded from aisori.meteo.ru/ClimateR/.
At the Hornsund meteorological site managed by the Institute of Geophysics, Polish Academy of Sciences, snow depth has been monitored at the same points by Polish expeditions since August 1982. Snow depth is calculated from a mean of three snow stakes. The meteorological site has been placed at the same location since 1978. The station is situated some 100 m to the west from the main building of the station. Redevelopment of the main building in 2004, when a northern wing was added, is a potential factor that could influence measurements. However, we find no significant step change in snow depth after 2004, suggesting that this event had a minimal effect on the measurements.
The available time series of snow depth for Barentsburg and Hornsund are presented in Fig. 2. A complete dataset without any gaps is available only for the Hornsund station. In the case of Barentsburg, data gaps occur in time series; the percentage of missing data in the analysed period is ~6%. These gaps also occur in the air temperature and precipitation time series. To complete the missing data, simple correlation analysis was performed. It was found that time series at Barentsburg and Hornsund are significantly correlated with each other, with a Pearson correlation coefficient of 0.97 for air temperature and 0.77 for snow depth. In the case of precipitation, a higher correlation with the Barentsburg time series was found for the data series from Longyearbyen (0.40) than with the time series from Hornsund (0.38). Therefore data gaps in Barentsburg time series were completed by regression with Hornsund (air temperature and snow depth) and Longyearbyen (precipitation). In case of snow cover, the dependence between time series from Hornsund and Barentsburg was parametrised using relatively simple rational function with three parameters (snowBAR = (p1 × snowHOR + p2)/(snowHOR + q1)), which gives good fit.

Fig. 2. Available time series of snow depth for Spitsbergen. Blue and red colours denote observed time series, while green colour denotes reconstructed snow depth time series at Barentsburg using data from Hornsund.
Methods
Analysing changes in seasonality for daily resolved measurements is difficult due to interannual variability of time series as well as the influence of local variables that hamper the analysis. Following the studies of Anghileri and others (Reference Anghileri, Pianosi and Soncini-Sessa2014) and Osuch and Wawrzyniak (Reference Osuch and Wawrzyniak2017) for the analysis of seasonality at daily time step we applied 2-D data filtering to the time series data. That ‘Moving Average over Shifting Horizon’ method allows for the filtering out of local physical relationships and additional sources of climatic variability. So far this method has been applied to daily flows (Anghileri and others, Reference Anghileri, Pianosi and Soncini-Sessa2014), mean daily air temperature and daily precipitation totals (Osuch and Wawrzyniak, Reference Osuch and Wawrzyniak2017). A schematic illustrating the MASH method is presented in Fig. 3. In this approach, the data are arranged in a 2-D matrix where in each row are data for the same Julian day from different years, and in each column are data from all days of the same year. In the second step, the data are averaged in two dimensions as described below.

Fig. 3. A schematic of the MASH method illustrating a moving average using MASH for parameters Y = 7 and w = 5. In this example, the data are averaged over 11 days (2w + 1) and 7 years (Y) as shown by the grey rectangle at left.
The averaging procedure is represented in Fig. 3. The rectangle at left represents the 2-D moving window over which averaging is conducted for each day of each year. The size of this rectangle is characterised by two parameters: w and Y. The first parameter (w) denotes the number of days used for averaging, while the second parameter (Y) is related to the averaging over years. In a result of averaging, a matrix of filtered data is obtained.
 $${\rm MASH} = \left[ {\matrix{ {\mu _{1,1}} & {\mu _{1,2}} & \ldots & {\mu _{1,N_h}} \cr {\mu _{2,1}} & {\mu _{2,2}} & \ldots & {\mu _{2,N_h}} \cr \ldots & \ldots & \ldots & \ldots \cr {\mu _{365,1}} & {\mu _{365,2}} & \ldots & {\mu _{365,N_h}} \cr}} \right]$$
where the average daily values for each day and year are calculated from the following equation:
 $$\mu _{t,h} = \mathop {mean}\limits_{y \in [h,h + Y - 1]} \left[ {\mathop {mean}\limits_{d \in [t - w,t + w]} (x_{d,y} )} \right]$$
where x d,y is the observation on the d th day of the y th year of the time series, w and Y are parameters of MASH that describe the averaging window.
The second dimension of the resulting MASH matrix (N h ) depends on the number of original years (N y ) and on the parameter Y.
 $$N_h = N_y - Y + 1$$
The values of Y and w strongly influence the resulting time series and estimated trends (Osuch and Wawrzyniak, Reference Osuch and Wawrzyniak2017). Applying small w values does not filter out short-term variability, but preserves seasonal variability, while very large w values could also filter out seasonal variations. Similar effects are visible with changes of the parameter Y. The higher the value of parameter Y (the length of the averaging horizon), the shorter the smoothed time series are. Following the outcomes of Osuch and Wawrzyniak (Reference Osuch and Wawrzyniak2017) and Luks and others (Reference Luks, Osuch and Romanowicz2011) the optimal parameters w = 15 and Y = 7 were selected for the MASH method. These parameters were selected by the error and trial method in order to preserve seasonal variability of snow depth and to filter out short-term variability. The choice of these parameters strongly depends on the dynamics of the variable under study. In the study of Osuch and Wawrzyniak (Reference Osuch and Wawrzyniak2017), we presented analysis of an influence of these two parameters on the estimated trends in air temperature. The outcomes for original and smoothed time series with a small window (w smaller than 5) are characterised by the presence of sharp peaks as a result of large day-to-day variability. The results of trend analysis for time series filtered by MASH procedure with larger window are much smoother.
We focus on the analysis of interannual changes of snow depth more than snow pack evolution in a particular year. The analysis was performed for the hydrological year defined as the period from 1 August of current year to 31 July of the following year, denoting the 32 hydrological years from 1 August 1984 to 31 July 2016 by the year of their start.
For the estimation of the tendency of changes in filtered daily snow depth, trend analysis using the Mann–Kendall method (Mann, Reference Mann1945; Kendall, Reference Kendall1975) was applied. The magnitude of the trend was estimated using the method of Sen (Reference Sen1968).
RESULTS
Trends in snow-cover indicators
The temporal variability of the four snow-cover indicators snow onset date, snow disappearance date, snow-cover duration and maximum snow depth over 32 years for Barentsburg and Hornsund stations is presented in Fig. 4. The missing data in the aforementioned series makes the analysis difficult therefore the analyses were carried out for reconstructed time series where gaps were completed by the regression with Hornsund data. The reconstructed indicators are shown by circles.

Fig. 4. Temporal variability of snow-cover indicators: (a) snow onset date, (b) snow disappearance date, (c) snow-cover duration and (d) maximum snow depth within the hydrological year at Barentsburg and Hornsund. Trends are estimated using Sen's method. Dash-dotted trend lines denote statistically significant trends at the 0.05 level, while a dotted line indicates a trend that is not statistically significant. Circles represent reconstructed data using regression.
It can be seen that the outcome of the trend analysis for the four indicators depend on the station. Results for Barentsburg are characterised by lack of statistically significant changes for all four variables. The sign of the trend in snow onset date is positive (+1.6 days decade−1) indicating a later appearance of snow cover. An opposite situation was found for snow disappearance date (−1.5 days decade−1), snow-cover duration (−4.6 days decade−1), and maximum snow depth (−2.5 cm decade−1), where the sign of the trend is negative.
In case of Hornsund a later appearance (+2.6 days decade−1) and earlier termination of snow cover (−4.0 days decade−1) were found, resulting in decrease of snow-cover duration (−10.0 days decade−1). At Hornsund station the maximum snow depth was found to be decreasing at a rate of −5.7 cm decade−1. The estimated trends in snow disappearance date, snow-cover duration and maximum snow depth at Hornsund station are statistically significant at the 0.05 level.
Seasonality trends in snow depth
Snow depth seasonality at two stations, Barentsburg and Hornsund, was analysed using the MASH method. Figures 5 and 6 show the smoothed time series of snow depth at these stations. The colour scale represents the snow depth, the X-axis denotes moving horizons (averaged over 7 years), and the Y-axis represents days of the hydrological year. The original time series covers the period N y = 32 hydrological years, from 1984/85 to 2015/16, and therefore, the MASH matrix is composed of N h = 26 horizons.
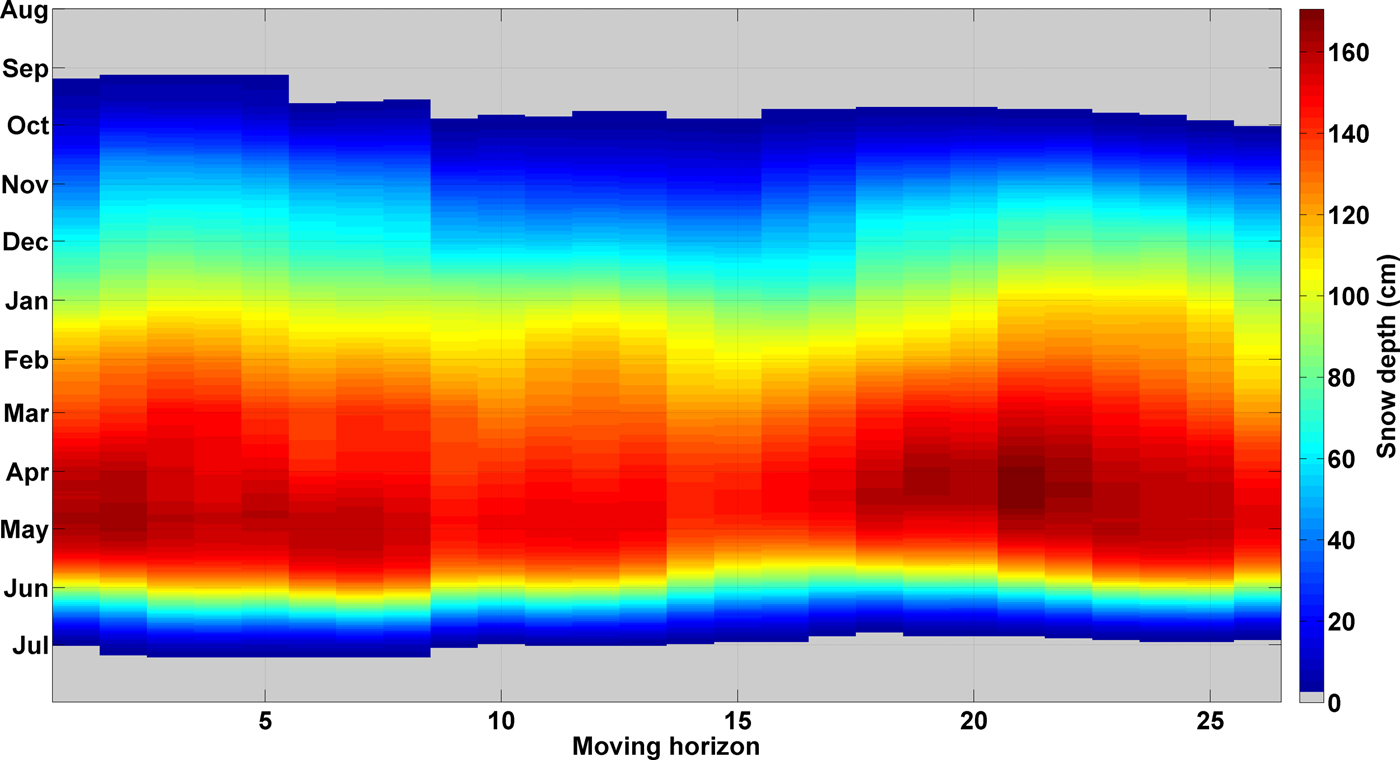
Fig. 5. Temporal variability of snow depth at Barentsburg station for hydrological seasons 1984/85–2015/16. The colour scale represents snow depth averaged over 31 days and 7 years.
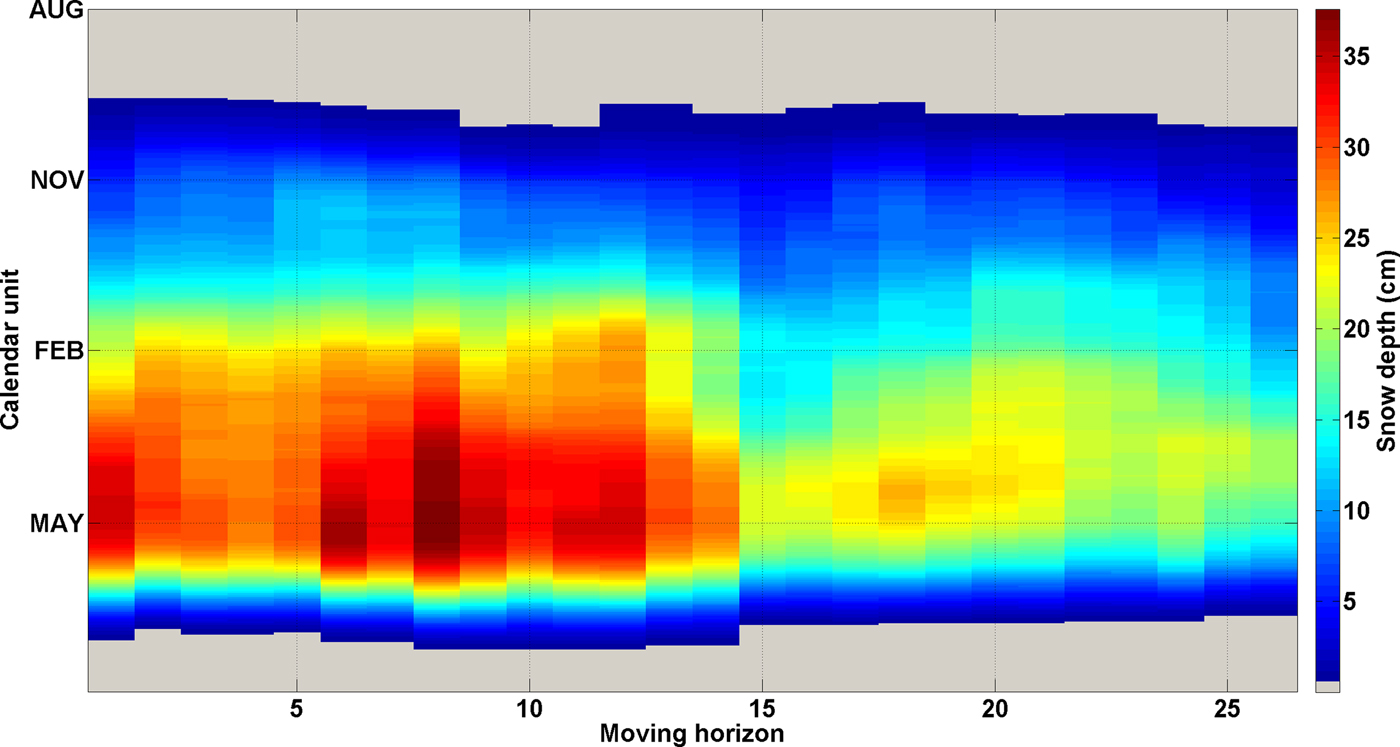
Fig. 6. Temporal variability of snow depth at the Hornsund station for hydrological seasons 1984/85–2015/16. The colour scale represents snow depth averaged over 31 days and 7 years.
At Barentsburg a consistency in the results is visible despite small changes in snow depth over time. In the case of results for Hornsund station, changes in data are visible. The outcomes up to horizon 14 (hydrological year 1997/98) are characterised by higher values of snow depth. After horizon 15 (hydrological year 1998/99), snow depth is lower on average and snow accumulation periods are shorter. A comparison of the outcomes for Barentsburg and Hornsund indicates differences in interannual variability of snow depth at these stations. Initially we surmised that the step change in time series from Hornsund did not result from the natural variability of the series and was caused by a change in the surroundings of the meteorological site or change of position of the point measurements at the meteorological site. A detailed investigation of meteorological yearbooks and personal contact with meteorological observers excluded these causes of change. A similar tendency of changes in snow depth, a step change around year 2000, was presented by Theakstone (Reference Theakstone2013) for high-altitude stations in Norway. Marty (Reference Marty2008) presented a significant step-like decrease in snow-cover duration at the end of the 1980s for multiple stations in Switzerland.
Annual runs of snow depth at Barentsburg and Hornsund are presented in Figs 7 and 8, respectively. In this case, lines represent snow depth averaged over 7 years at a particular location. Blue lines represent older horizons while red lines more recent horizons. Changes in annual runs of snow depth are visible (later snow onset date and earlier snow disappearance date).

Fig. 7. Visual representation of the MASH results for daily snow depth at Barentsburg station. Original time series covers the period N y = 32 snow seasons, from 1984/85 to 2015/16; therefore, MASH is composed of N h = 26 horizons. Each series represents a 7-year average of daily snow depth beginning in the year indicated.

Fig. 8. Visual representation of the MASH results for daily snow depth at the Hornsund station. The original time series covers the period N y = 32 snow seasons, from 1984/85 to 2015/16; therefore, MASH is composed of N h = 26 horizons. Each series represents a 7-year average of daily snow depth beginning in the year indicated.
In case of Hornsund station (Fig. 8), significant temporal changes are visible. The outcomes for recent horizons represented by red lines indicate that snow cover is appearing later and disappearing earlier. Furthermore snow cover is over a dozen centimetres thinner from January till May than it was in the 1980s and 1990s. In addition, changes to the date of maximum snow depth occurrence are also visible. In the 1980s and 1990s, the maximum snow depth was measured in May. Recently it is measured in March and April.
In order to better understand the magnitude of trends during different parts of the hydrological year, the data averaged over 7 years and 31 days were subjected to a trend analysis using the Mann–Kendall method. Figure 9 shows changes in snow depth at Barentsburg and Hornsund for the period 1 August 1984–31 July 2016. Statistically significant changes at the 0.05 level are represented by the blue (Barentsburg) and green (Hornsund) lines. The results for both stations are similar for August, September, first part of October, second part of May and June when statistically significant decreases of snow depth were estimated. In the remaining period, there are differences in outcomes between stations. The results for Barentsburg from second part of October till mid-May are characterised by the lack of a trend while for Hornsund statistically significant decreases in snow depth were estimated. The largest changes of snow depth at Hornsund occurred in May, which corresponds to the maximum snow depth date for the 1980s and 1990s. At Barentsburg the largest changes in snow depth occurred in June.
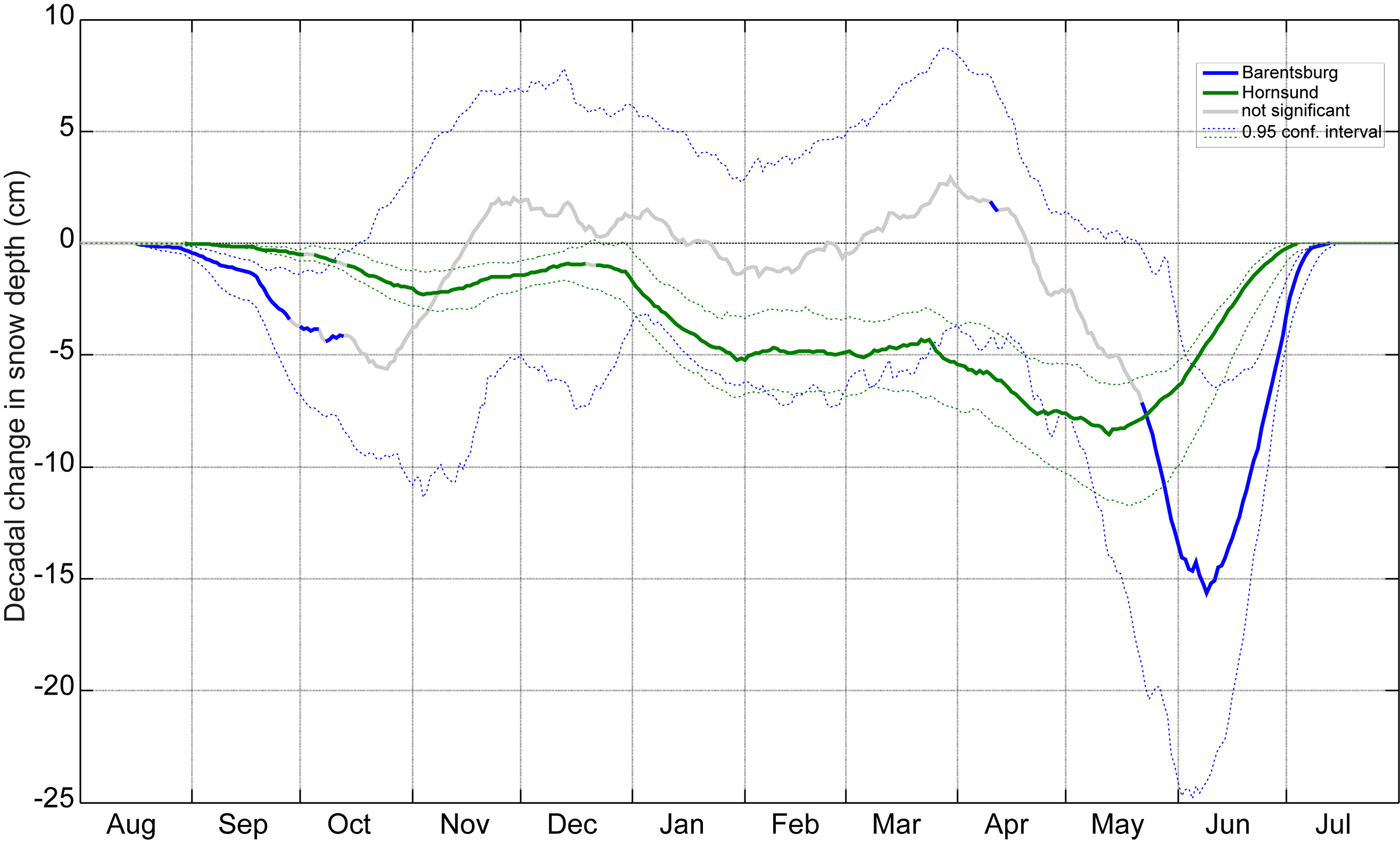
Fig. 9. Comparison of the estimated trends in daily snow depth (change per decade) at Barentsburg and Hornsund meteorological stations for the period 1 August 1984–31 July 2016. The results were obtained using the MASH-filtered data.
These differences of trend analysis outcomes can be explained by the changes in air temperature and precipitation that are presented in the next sections. Another potential factor is difference in snow depth at both sites. However, absolute changes in snow depth are similar as air temperature increases almost homogenously at both sites. Additional factors such as turbulent fluxes, snow density and shift of precipitation phase from solid to liquid should be taken into account in the explanation of complex relationship between snowpack behaviour and meteorological conditions.
Air temperature
To explain differences in estimated trends between stations an analysis of daily air temperature and total precipitation were performed. Temporal variability of daily air temperature at Barentsburg and Hornsund smoothed by the MASH method is shown in Fig. 10. Similar tendencies were found for both sites. The largest changes of air temperature occur during the cold period from October till the end of February. A shift in the timing of the coldest period is also observed. The lowest air temperatures of the year are observed recently in March and April, whereas in the 1980s and 1990s, lowest air temperatures occurred in December and January. For the explanation of different trends in snow depth and snow onset date between stations very important are the differences in air temperature at the end of September/beginning of October as visible in Fig. 10. In that period in the 1980s and 1990s, air temperature was negative, while recently is slightly positive at Hornsund. Onset of the freezing period is delayed by more than 2 weeks. Prolongation of period with positive temperatures has direct impact on snow and precipitation at Hornsund. In contrast, there are no such changes at Barentsburg, where air temperature at the end of September remains negative.
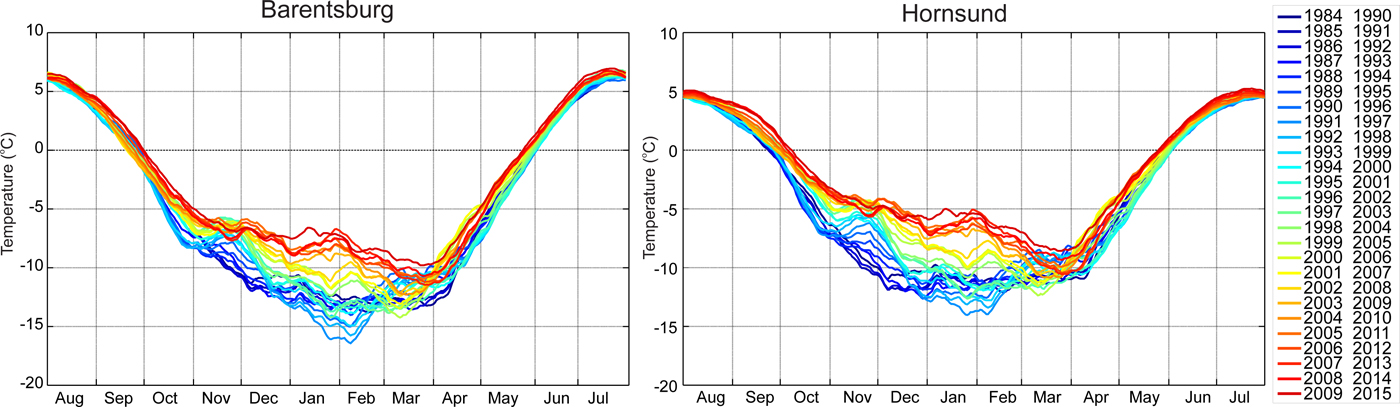
Fig. 10. Visual representation of the MASH results for daily air temperature at Barentsburg and Hornsund stations. Original time series cover the period N y = 32 snow seasons, from 1984/85 to 2015/16; therefore, MASH is composed of N h = 26 horizons. Each series represents a 7-year average of daily air temperature beginning in the year indicated.
The outcomes of trend analysis in daily air temperature averaged over 31 days and 7 years for Barentsburg and Hornsund are presented in Fig. 11. Similar trends are clearly visible at both stations. A statistically significant increase in daily air temperature was found almost throughout the year, except in part of March at Hornsund and in part of September at Barentsburg. In December, January and February changes higher than 2 °C decade−1 were estimated for both stations.
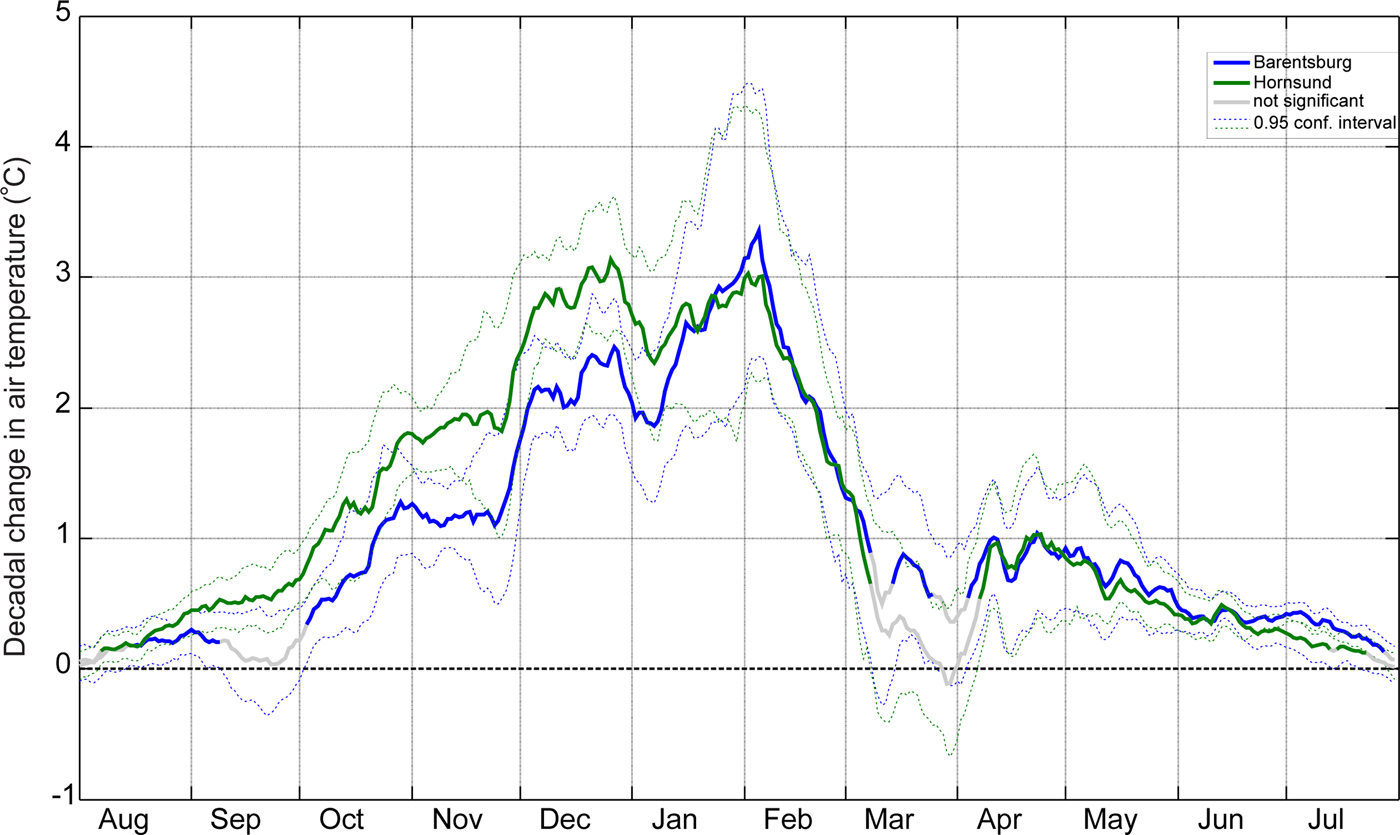
Fig. 11. Comparison of the estimated trends in daily air temperatures (change per decade) at Barentsburg and Hornsund meteorological stations for the period 1 August 1984–31 July 2016. The results were obtained for the MASH-filtered data.
A comparison of estimated trends between Barentsburg and Hornsund indicates that larger increases in air temperature occurred at Hornsund (green line) than at Barentsburg (blue line) in September, November, October, December and first half of January. In other months, the estimates of changes for both stations are similar.
Precipitation
A comparison of MASH-smoothed annual runs of daily precipitation for the 1 August 1984 to 31 July 2016 period at Barentsburg and Hornsund stations is presented in Fig. 12. Dark blue lines represent observations from the 1980s and 1990s, while red lines indicate more recent data. In both cases (Barentsburg and Hornsund), changes in seasonality of precipitation are visible. However, there are differences between stations. At Barentsburg station the maximum precipitation is observed recently at the end of October, while at Hornsund the maximum occurs in September. In addition, these maxima are larger for Hornsund (3.5 mm) than Barentsburg (3 mm). Daily sums of precipitation smaller than 1 mm are observed in August, May, June and July at Barentsburg and at the end of November, in the second part of March, and during April, May and June at Hornsund.
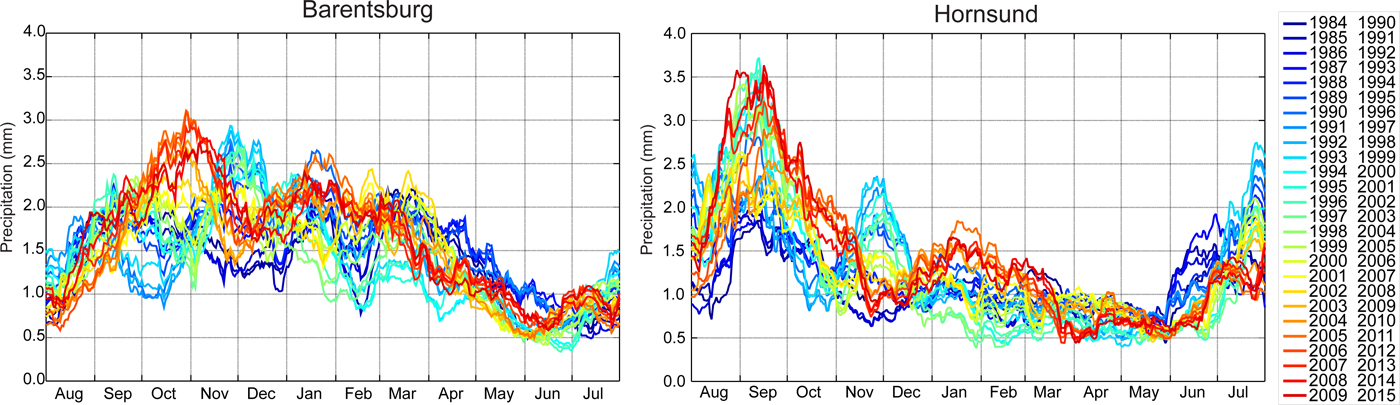
Fig. 12. Visual representation of the MASH results for daily total precipitation at Barentsburg and Hornsund stations. The original time series covers the period N y = 32 snow seasons, from 1984/85 to 2015/16; therefore, MASH is composed of N h = 26 horizons. Each series represents a 7-year average of daily total precipitation beginning in the year indicated.
For the explanation of the different trends of snow depth, joint analysis of precipitation and air temperature are very important. The maximum precipitation in recent years at Hornsund is observed in September, which in combination with air temperature above the freezing point leads to increase of precipitation in liquid form (rain, rain and snow mixed). In case of Barentsburg, the maximum precipitation is observed later (in the end of October), when air temperature is below zero.
The results of trend analysis for daily totals of precipitation averaged by MASH are presented in Fig. 13. In this case, differences between stations were found. In August and September, a high positive trend was estimated only for the Hornsund station. The outcomes for Barentsburg indicate decreases in precipitation or lack of trend. In October, a statistically significant positive trend was found for both stations. Increases in daily total precipitation are visible in the second part of December and first part of January. An opposite tendency, a decrease in precipitation, was estimated for April and May in Barentsburg. As precipitation in that period (April and May) is in the solid form (snowfall), the changes in precipitation result in decrease of snow depth during this period.

Fig. 13. Comparison of the estimated trends in daily total precipitation (change per decade) at Barentsburg and Hornsund meteorological stations for the period 1 August 1984–31 July 2016. The results were obtained for the MASH-filtered data.
The estimated tendencies of changes in air temperature and precipitation can explain changes in snow cover. Increases in air temperature assessed at both stations results in later development and shorter duration of snow cover. Despite a positive trend in precipitation at Hornsund in the period from second part of September through the first part of November, a negative trend in snow depth was estimated.
We attribute this contradicting trend to the observed increase in air temperature, which should directly impact the phase of precipitation. Indeed, in recent years we observed more liquid or mixed precipitations in autumn during such longer periods with positive air temperatures (data not shown).
Effectiveness of the MASH method
The effectiveness of the MASH method was tested by analysis of correlation coefficients for snow depth, air temperature and precipitation between stations. This also allowed the spatial coherence of the data between stations to be studied. Pearson correlation coefficients (PCC) for the original and filtered data, are presented in Table 1. The outcomes for original and filtered time series indicate statistically significant relationships at 0.05 level. In the case of snow depth, original data obtained PCC value amounts 0.7713. The results for filtered data are characterised by higher value of PCC that is equal to 0.9364. Increases in values of correlation coefficients for filtered data are also visible for air temperature. In this case, PCC value is higher than 0.99 indicating almost perfect correlation. The result for precipitation time series is slightly lower for filtered data and amounts 0.3786.
Table 1. Pearson correlation coefficients for the comparison of time series (of snow depth, air temperature and precipitation) for Barentsburg and Hornsund stations for the 1 August 1984 to 31 July 2016 period, for original and MASH-filtered data
CONCLUSIONS
This study examined the inter- and intra-annual variability of snow depth at two arctic meteorological sites in Barentsburg and Hornsund during 32 hydrological years from 1 August 1984 to 31 July 2016. For that purpose, we used the novel MASH method, combined with the Mann–Kendall method for trend estimation. A proper application of MASH allows one to detect the changes in the data filtering out the effects of short-term variation of variables.
The results for Barentsburg and Hornsund are similar for August, September, first part of October, second part of May and June, when statistically significant decreases of snow depth were estimated. The results for Barentsburg from second part of October till mid-May are characterised by the lack of a trend while for Hornsund a decrease of snow depth was estimated. The highest amount of snow cover thinning at Hornsund occurred in May, which corresponds to an earlier occurrence of maximum snow depth. These differences in the estimated tendencies were explained with the help of the results of a trend analysis on air temperature and precipitation. A statistically significant increase in daily air temperature was found almost throughout the year, except in part of March at Hornsund and in part of September at Barentsburg. The largest changes of air temperature (more than 2 °C decade−1) occur during the cold period from December till February at both stations. Onset of the freezing period is delayed by more than 2 weeks at Hornsund.
The results of trend analysis for daily totals of precipitation differ from those obtained for air temperature. There are few periods with statistically significant changes and there are differences between stations. The highest increase in precipitation totals are noted in early August and in September at Hornsund. The outcomes for Barentsburg indicate slight decrease in precipitation or lack of trend in these months. In October, a statistically significant positive trend was found for both stations. An opposite tendency, a decrease in precipitation, was estimated for April and May in Barentsburg. Changes in air temperature in combination with precipitation play a crucial role in development of snow cover and can explain trends of its indicators.
The analyses included temporal variability of the snow onset date, snow disappearance date, snow-cover duration and its maximum depth. The results of the assessment depend on location although some similarities were detected. Similar tendencies of changes were found for Hornsund and Barentsburg in case of snow onset date, snow disappearance date, snow-cover duration and maximum snow depth. However these changes are statistically significant only for the Hornsund station. These results correspond to the findings of van Pelt and others (Reference Van Pelt2016) where statistically significant trends were detected in snow onset date in response to autumn warming as well as in earlier melt onset. However, there are differences in maximum snow depth that results from different period under study.
In situ measurements of snow depth in Spitsbergen are rare. The data are available only from a few sites and only one station (Hornsund) has a daily snow depth data series with no gaps. The homogeneity of these time series is limited, as a result of missed observations and probable local changes in neighbourhood of stations (e.g. new buildings) that may influence the time series. A comparison of the longest snow-cover monitoring series in Spitsbergen from Barentsburg and Hornsund indicates differences in interannual variability of snow depth at these stations. A similar tendency of changes in snow depth like in Hornsund, a step change around year 2000, was presented by Theakstone (Reference Theakstone2013) for high-altitude stations in Norway. Marty (Reference Marty2008) presented a significant step-like decrease in snow-cover duration at the end of the 1980s for multiple stations in Switzerland. Further investigations and snowpack modelling are required to explain these differences and simulate future changes in snow-cover dynamics in Spitsbergen.
ACKNOWLEDGEMENTS
The study was supported from the funds of the Leading National Research Centre (KNOW) received by the Centre for Polar Studies for the period 2014–18 and the Polish National Science Centre through grant no. 2013/09/N/ST10/04105: Impact of climate change on snow cover and hydrological regime of polar non-glaciated catchment. This work was partially supported within statutory activities no. 3841/E-41/S/2017 of the Ministry of Science and Higher Education of Poland and would not have been possible without the access to valuable data from the Polish Polar Station Hornsund and the portal aisori.meteo.ru/ClimateR. We thank two anonymous reviewers and AoG Scientific Editor Charles Fierz for their constructive comments that helped improve the quality of the paper and to clarify the text. We are very grateful to Patrick Alexander for improving the English.


 Open access