


1. Introduction
Granular materials are complex systems that can exhibit liquid-like behaviour under agitation. Examples are gas bubbles in gas–solid-fluidized beds (Davidson, Harrison & Carvalho Reference Davidson, Harrison and Carvalho1977), breaking waves in granular shear layers (Goldfarb, Glasser & Shinbrot Reference Goldfarb, Glasser and Shinbrot2002), gas–solid fingering patterns akin to Rayleigh–Taylor instabilities (Vinningland et al. Reference Vinningland, Johnsen, Flekkøy, Toussaint and Måløy2007) and condensation-like droplet formation of particles on tapped plates (Duran Reference Duran2001). Very recently, McLaren et al. (Reference McLaren, Kovar, Penn, Müller and Boyce2019) have observed further liquid-like phenomena in binary granular materials that are subjected to simultaneous vibration and aeration. When a cluster composed of particles with diameter  $d_c$ and density
  $\rho _c$ is immersed in a bed of particles of different diameter
  $d_b$ and density
  $\rho _b$, the cluster forms a coherent structure rising similar to a gas bubble in a liquid. Such clusters have been termed ‘granular bubbles’ (see figure 1b) and have been observed to form for
  $d_c/d_b > 1$ and
  $\rho _c/\rho _b <1$ albeit in the absence of surface tension at the cluster interface. Conversely, for
  $d_c/d_b <1$ and
  $\rho _c/\rho _b > 1$ the cluster (termed a ‘granular droplet’) sinks and splits similar to a droplet of dense liquid falling in a miscible but lighter liquid. Despite some similarities with their fluid analogues, the mechanism driving granular bubbles and droplets must differ appreciably from their liquid counterparts as granular materials readily solidify under pressure and lose their fluidity due to frictional forces. McLaren et al. (Reference McLaren, Kovar, Penn, Müller and Boyce2019) have argued that a granular bubble rises for
  $d_c > d_b$ as gas required to fluidize the granular material is drawn into the bubble, counteracting gravity through an increased drag. On the other hand, a granular droplet sinks for
  $d_c < d_b$ as gas bypasses the droplet. As the work of McLaren et al. (Reference McLaren, Kovar, Penn, Müller and Boyce2019) was largely experimental, relying on only two different ratios for
  $d_c/d_b$ and
  $\rho _c/\rho _b$, there is still very little understanding of the underlying physics of these new phenomena. Here, we derive an analytical model that predicts the neutral buoyancy limit of a granular cluster allowing the construction of a regime map. This regime map reveals the existence of three additional, previously unreported, regimes.

Figure 1. (a) Numerical set-up: bulk particles (black,  $d_b = 1.16\ \text {mm}$ and
  $\rho _b = 6000\ \text {kg}\ \text {m}^{-3}$) are filled to a height
  $H$ in a container of width
  $W$ and depth
  $T$. Granular cluster particles (white) are initialized as a square cuboid (
 $W_c = 30$ mm) that is immersed in the bulk phase. The bed is subjected to a vertical, sinusoidal vibration (
 $A = 1\ \text {mm}$ and
  $f = 10\ \text {Hz}$) and an upwards gas flow
  $U = 1.13\ \text {m}\ \text {s}^{-1}$ with
  $\rho _g = 1.2\ \text {kg}\ \text {m}^{-3}$ and
  $\nu = 1.5\times 10^{-5}\ \text {m}^{2}\ \text {s}^{-1}$. (b) Time series of a rising granular bubble formed by granular cluster particles (
 $d_c = 1.45\ \text {mm}$ and
  $\rho _c = 3000\ \text {kg}\ \text {m}^{-3}$). The images show a central cut out of the bed with a width of
  $0.375W$ and height
  $H$.
$H$.
2. Numerical set-up
A critical assessment of the hypothesis of McLaren et al. (Reference McLaren, Kovar, Penn, Müller and Boyce2019) concerning the transition between rising and sinking granular clusters requires quantitative information on the gas flow near a cluster. However, this information is not easily accessible by experiments due to the opaque nature of granular matter. To this end, computational fluid dynamics coupled to a discrete element method (CFD-DEM) was applied to simulate a pseudo-two-dimensional vibro-gas-fluidized bed using cfdemCoupling  $^{\circledR}$ (Kloss et al. Reference Kloss, Goniva, Hager, Amberger and Pirker2012). Details on the CFD-DEM model and the implemented equations can be found in Appendix A.
The gas flow field was calculated in cubic volume elements of 5 mm edge length using the built-in finite volume method solver of cfdemCoupling  $^{\circledR}$ (Kloss et al. Reference Kloss, Goniva, Hager, Amberger and Pirker2012). The boundary conditions used in the CFD are summarized in table 1. Due to the coarse resolution of the CFD mesh, a full-slip boundary condition was implemented between solid walls and the gas phase (Beetstra, van der Hoef & Kuipers Reference Beetstra, van der Hoef and Kuipers2007; Li et al. Reference Li, Gopalakrishnan, Garg and Shahnam2012; Li, Zhang & Hernández-Jiménez Reference Li, Zhang and Hernández-Jiménez2016). However, the frictional and collisional contacts between the particles and the walls are fully resolved in the DEM. Studies of Zenit, Hunt & Brennen (Reference Zenit, Hunt and Brennen1997) and Berzi & Fraccarollo (Reference Berzi and Fraccarollo2015) have shown that particle collisions in inertia-dominated suspensions cause velocity and pressure fluctuations in the interstitial fluid that affect in turn the prevailing stresses and the effective viscosity of the fluid. In our work, the occurring fluid velocity fluctuations due to particle collisions are expected to be of the order of the magnitude of the peak particle velocities (that are
  ${\sim }0.1\ {\rm m}\ {\rm s}^{-1}$), however, the interstitial gas velocity is approximately 30 times faster on average. Thus, we expect the drag force to dominate over local fluid forces due the collision-induced velocity fluctuations. As the local void fraction
  $\epsilon$ is fairly constant throughout the entire particle packing, viscous stresses from local flow compressibility are expected to be small and only shear stresses for the fluid stress tensor were used in (A4). Moreover, in our simulations, the fluid density
  $\rho _g$ is low compared with the solid density of the particles. Thus, further fluid–particle interaction forces such as the added mass effect are minor and have been neglected (Sommerfeld Reference Sommerfeld2018).
Table 1. Boundary conditions used in the CFD part.

The numerical set-up of the vibro-gas-fluidized bed resembled the experiments of McLaren et al. (Reference McLaren, Kovar, Penn, Müller and Boyce2019), see figure 1(a). Specifically, a box of width  $W = 200\ \text {mm}$ and thickness
  $T = 10\ \text {mm}$ was filled up to a height of
  $H=250$ mm with a polydisperse mixture of spherical particles, referred to as the bulk phase. The bulk particles had a density
  $\rho _b = 6000\ \text {kg}\ \text {m}^{-3}$ and a mean diameter
  $d_b = 1.16\ \text {mm}$. Polydispersity was introduced to reduce crystallization effects of the packing (Pusey Reference Pusey1987). To this end, 60 mass-% of the bulk particles had the nominal diameter
  $d_b$ and 20 mass-% were attributed each to a particle size equal to
  $0.9d_b$ and
  $1.1d_b$, respectively. Inside the bulk phase, a square cuboid of width
  $W_c = 30\ \text {mm}$ and depth
  $T$ was cut out and filled with spherical particles of mean diameter
  $d_c$ and density
  $\rho _c$ (referred to as the granular cluster). The cluster particles followed the same polydispersity scheme as the bulk particles. The lower edge of the cluster was 30 mm above the bottom of the bed. Details on the DEM particle properties are found in table 2.
Table 2. Particle properties used in the DEM part.

In the present study, we reduced the coefficient of restitution  $e$ of the particles to 0.3 in order to speed up the simulations. However, a parameter study varying
  $e$ showed that a variation of
  $e$ in the range 0.1–0.95 has no significant influence on the evolution of granular bubbles, see Appendix E. At the bottom of the bed, an upwards gas flow with a superficial velocity
  $U = 1.13\ \text {m}\ \text {s}^{-1}$, density
  $\rho _g = 1.2\ \text {kg}\ \text {m}^{-3}$ and viscosity
  $\nu = 1.5\times 10^{-5} \text {m}^{2}\ \text {s}^{-1}$ entered the bed. The value of
  $U$ was equal to the minimum fluidization velocity of the bulk particles (
 $U_{mf,b}$), i.e. the velocity at which the drag force balances the weight of the bulk particles in the gravitational field
  $g = 9.81 \ \text {m}\ \text {s}^{-2}$ (Kunii & Levenspiel Reference Kunii and Levenspiel1991). Fluidization reduced frictional forces between the bulk particles, a key requirement for granular clusters being able to rise/sink. During the simulations, the box was subjected to a vertical, sinusoidal vibration with an amplitude
  $A = 1\ \text {mm}$ and frequency
  $f = 10\ \text {Hz}$. Applying vibration aids the creation of a mobilized state of the granular material and reduces the emergence of gas bubbles that otherwise would arise if the particles were fluidized by gas alone (McLaren et al. Reference McLaren, Kovar, Penn, Müller and Boyce2019, Reference McLaren, Metzger, Boyce and Müller2021). This allowed the evolution of the granular clusters to be unimpaired by the presence and motion of large gas bubbles. Importantly, applying only vibration without gas fluidization did not establish any convective flow patterns in the bulk phase and lead to an immobile granular cluster.
3. Experimental set-up
In an effort to validate the regimes found in numerical simulations, additional experiments were performed matching the numerical set-up. To this end, a series of granular clusters was prepared in a pseudo-two-dimensional vibro-gas-fluidized bed made of acrylic glass sheets. The inner dimensions of the bed were  $W=200$ mm and
  $T=10$ mm. Analogue to the procedure described in Metzger et al. (Reference Metzger, McLaren, Pinzello, Conzelmann, Boyce and Müller2022), a granular cluster with
  $W_c=30$ mm was initialized in a bed of bulk particles, ensuring a configuration as shown in figure 1(a). The height of the granular bed was set to
  $H=250$ mm. Table 3 lists all combinations of bulk and cluster particles that have been used in the experiments. During the experiments, a shaker (Labworks Inc., ET-139) vertically vibrated the fluidized bed at identical conditions used in the simulations, i.e.
  $A=1$ mm,
  $f=10$ Hz and
  $\varGamma =0.4$. A flow of pressurized air was used to fluidize the granular material at incipient fluidization conditions, i.e.
  $U/U_{mf,b} = 1$. The gas flow was controlled by a mass flow controller (Bronkhorst AG, F-202AV) and passed through a humidifier before entering the fluidized bed. Humidification of the fluidizing gas mitigated the build-up of electrostatic charges on the granular material. Additionally, the bulk materials were treated with anti-static spray (Electrolube, ASA250). Neither humidification nor anti-static coating led to the formation of liquid bridges such that the granular material maintained its free-flowing properties. The emergence of a granular cluster was recorded with a digital camera (Canon, EOS 77D) at a frame rate of 50 Hz. Each experiment listed in table 3 was repeated three times.
Table 3. Combination of bulk particles (index  $b$) and cluster particles (index
  $c$) used in the experiments. All experiments were performed with vertical vibration (
 $A=1$ mm,
  $f=10$ Hz,
  $\varGamma =0.4$) and at incipient fluidization (
 $U/U_{mf,b}=1$). The particles were sieved and the
  $\pm$ sign indicates the upper and lower bounds of the particle size. The values of
  $d^{*}=d_c/d_b$,
  $\Delta \rho ^{*}=(\rho _c-\rho _g)(\rho _b-\rho _g)^{-1}$ and
  $Re_b=Ud_b/\nu$ were calculated based on the mean particle diameters and the nominal solid densities.

4. Derivation of the analytic gas shift model
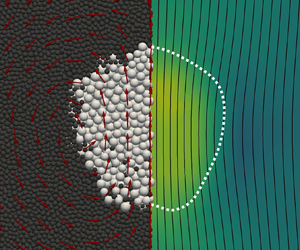
First, we evaluate numerically the effect of a granular cluster on the gas flow field. Figures 2(a) and 2(b) display the gas flow in the vicinity and inside a granular cluster for two values of the relative particle diameter
 \begin{equation} d^{*} = d_c/d_b. \end{equation}
The black curves represent the gas streamlines and the background shows the dimensionless magnitude of the gas velocity  $U^{*} = u/U$, where
  $u$ is the magnitude of the local superficial gas velocity. For
  $d^{*} = 1.5$, the streamlines concentrate inside the granular bubble and
  $U^{*}$ is higher in the cluster than in the surrounding bulk phase, i.e. gas flows preferentially through the granular cluster. For
  $d^{*} = 0.5$ the situation inverts. Such flow characteristics have been expected by Gilbertson & Eames (Reference Gilbertson and Eames2001) and McLaren et al. (Reference McLaren, Kovar, Penn, Müller and Boyce2019) due to an increased/reduced permeability with increasing/reduced particle size (Kozeny Reference Kozeny1927; Carman Reference Carman1937; Ergun Reference Ergun1952). The flow heterogeneity that is caused by the redirection of gas into or around a granular cluster will be referred to as ‘gas shift’ in the following. This gas shift is key to explaining the rising and sinking of granular bubbles and droplets and hence has to be incorporated in any predictive analytical model.

Figure 2. Heterogeneous gas flow near a square-shaped granular cluster of width  $W_c = 30\ \text {mm}$. (a,b) Simulated gas flow with
  $Re_b = Ud_b/\nu = 88.75$ through a packing with
  $d^{*} = 1.5$ and 0.5, respectively. The white boxes mark the edge of the granular cluster and the black curves show the gas streamlines. Here,
  $U^{*}$ is given by the background colour. (c) Decomposition of
  $U$ into
  $u_c$ (cluster) and
  $u_b$ (bulk phase) according to (4.2) and (4.4). (d) The value of
  $U^{*}$ along the horizontal line through the centre of a granular cluster with, respectively,
  $d^{*} = 1.5$ (blue) and
  $d^{*} = 0.5$ (red). Solid lines plot the Eulerian–Lagrangian simulation results; dashed lines plot the solutions of the analytical model.
In order to quantify the gas shift, we derive an analytical model for the gas flow around the granular cluster. For the model we apply a horizontal cut through the centre of the granular cluster that divides the bed into two regions: the cluster of dimensionless width  $W^{*} = W_c/W$ and the bulk phase of dimensionless width
  $(1-W^{*})$, as shown in figure 2(c). The gas that enters the bed is decomposed into two parallel flows through these two regions. Gas is assumed to flow with a uniform dimensionless velocity
  $U_c^{*} = u_c/U$ and
  $U_b^{*} = u_b/U$ through the cluster and bulk phase, respectively. Due to its low velocity, the gas flow is assumed to be incompressible and the continuity equation reads
 \begin{equation} 1 = (1-W^{*} ) U_b^{*}+W^{*} U_c^{*}. \end{equation}
Figures 2(a) and 2(b) show parallel and equally spaced streamlines below and above the granular cluster, i.e. no horizontal pressure gradients exist in these regions. This implies that the gas flow through the cluster is driven by the same vertical pressure drop as the flow through the adjacent bulk phase. Ergun's equation (Ergun Reference Ergun1952) is used to quantify the pressure drop  $\Delta p$ across a height
  $L$ of cluster or bulk phase particles
 \begin{equation} \frac{\Delta p_i}{L}=\frac{150\mu_g}{d_i^{2}}\frac{(1-\epsilon_i)^{2}}{\epsilon_i^{3}}u_i+\frac{1.75\rho_g}{d_i}\frac{1-\epsilon_i}{\epsilon_i^{3}} u_i^{2}, \end{equation}
where index  $i = [b,c]$ denotes the bulk or cluster phase, respectively, and
  $\mu _g = \nu \rho _g$ is the dynamic gas viscosity. Equating
  $\Delta p_c/L = \Delta p_b /L$ and rewriting the equation in a non-dimensional form yields a correlation between
  $U_b^{*}$,
  $U_c^{*}$,
  $d^{*}$, the void fraction
  $\epsilon$ and the Reynolds number of the bulk phase
  $Re_b = Ud_b/\nu$, see Appendix B for the full derivation. According to our computational simulations,
  $\epsilon$ is very uniform in the bed (
 $\epsilon \approx 0.4$) for a large range of
  $d_c$ and
  $d_b$ provided that the coefficients of friction of the bulk and cluster particles are identical. Given these boundary conditions, we obtain
 \begin{equation} 0=\left(U_b^{*}-\frac{U_c^{*}}{d^{*^{2}}}\right)+\frac{Re_b}{k}\left(U_b^{*^{2}}-\frac{U_c^{*^{2}}}{d^{*}} \right), \end{equation}
with  $k = 85.7(1-\epsilon ) \approx 51.42$. When
  $\mu _b$ and
  $\mu _c$ differ substantially, the assumption of a uniform void fraction
  $\epsilon$ is no longer satisfied. This case is described in Appendix D. In the following, only cases with identical coefficients of friction are considered. Combining (4.2) and (4.4) allows us to determine
  $U_c^{*}$ and
  $U_b^{*}$ as a function of
  $Re_b$,
  $d^{*}$ and
  $W^{*}$. Figure 2(d) compares the values of
  $U^{*}$ along a horizontal line through the centre of a cluster obtained by the Eulerian–Lagrangian simulation (solid lines) with the analytical model (dashed lines). For both values of
  $d^{*}$, the analytical model gives an accurate quantitative prediction of the average gas velocity inside the granular cluster and the bulk phase, although not all local effects (e.g. wall effects at
  $|x/W| = 0.5$ or local depletion/accumulation of gas flow in the bulk phase for
  $0.075\leqslant |x/W|\leqslant 0.16$ due to the gas shift) are captured in the analytical model. Based on this finding,
  $U_c^{*}$ can be used as a quantitative measure for the gas shift as
  $U_c^{*}>1$ indicates an increased gas flow inside the granular cluster compared with the inlet gas velocity
  $U$. Inversely,
  $U_c^{*} <1$ denotes a reduced gas flow in the cluster. A further evidence for the validity of the analytical gas shift model is presented in figure 3(a) plotting
  $U_c^{*}$ vs
  $d^{*}$. Here, the predictions of the gas shift model agree very well with the results of the Eulerian–Lagrangian simulations (
 $W^{*} = 0.15$). The analytical model further indicates that
  $U_c^{*}$ depends on the dimensionless width of the cluster
  $W^{*}$. An increase in
  $W^{*}$ yields higher values of
  $U_c^{*}$ for
  $d^{*} < 1$ and lower values for
  $d^{*} > 1$. This is because, for a fixed
  $W$, an increasing width of the granular cluster reduces the size of the bulk phase from which gas is withdrawn (
 $d^{*} > 1$) or into which additional gas is shifted (
 $d^{*} < 1$): thus,
  $U_c^{*} \rightarrow 1$ for
  $W^{*} \rightarrow 1$. Inversely,
  $U_c^{*}$ approaches a finite value for
  $W^{*}\rightarrow 0$. This solution represents the maximal obtainable gas shift to/from an infinitely small cluster for a given
  $d^{*}$ and
  $Re_b$.

Figure 3. (a) Gas shift ( $U^{*}_c$) occurring in granular clusters of particle size
  $d^{*}$ as predicted by (4.2) and (4.4) for a series of widths
  $W^{*}$. Triangles (
 $\vartriangle$) represent the results of the Eulerian–Lagrangian simulations for
  $U_c^{*}$ with
  $W^{*} = 0.15$. (b) Neutral buoyancy limits predicted for granular clusters of varying
  $W^{*}$ (4.2), (4.4) and (5.2) with
  $\Delta \rho ^{*} = (\rho _c -\rho _g)(\rho _b - \rho _g )^{-1}$. Both panels (a,b) use
  $Re_b = 88.75$ and
  ${Ar}_b = 3.40\times 10^{5}$.
5. Derivation of the neutral buoyancy limit
As the analytical model is able to accurately predict the gas shift to/from the granular cluster to the bulk phase, we address next the question of under which circumstances a granular cluster rises or sinks. In our model we use two assumptions: first, the inlet gas velocity  $U$ is set to the minimum fluidization velocity of the bulk particles
  $U_{mf,b }$, i.e. the velocity of the gas flow required to induce a drag force that equals the weight of the particles. Here,
  $U_{mf,i}$ is determined from a force balance equating the pressure drop across the packing (4.3) with the weight of the packing per cross-sectional area such that
 \begin{equation} \frac{\Delta p_i}{L} =\frac{150\rho_g\nu}{d_i^{2}}\frac{(1-\epsilon)^{2}}{\epsilon^{3}}U_{mf,i}+ \frac{1.75\rho_g}{d_i}\frac{1-\epsilon}{\epsilon^{3}} U_{mf,i}^{2} = (1-\epsilon)(\rho_i -\rho_g)g, \end{equation}
where  $i = [b, c]$ (Kunii & Levenspiel Reference Kunii and Levenspiel1991). Rearranging the right-hand sides and introducing the Reynolds number
  $Re_{mf,i}=d_i U_{mf,i} \nu ^{-1}$ and the Archimedes number
  ${Ar}_i = d_i^{3}(\rho _i-\rho _g)(\rho _g\nu ^{2})^{-1}$ yields
 \begin{equation} \frac{1.75}{\epsilon^{3}}Re_{mf,i}^{2}+ \frac{150(1-\epsilon)}{\epsilon^{3}} Re_{mf,i} = {Ar}_i. \end{equation}
Thus, for constant  $\epsilon$ and
  $\nu$,
  $Re_{mf,b}$ and
  $U_{mf,b}$ are only functions of
  ${Ar}_b$ and
  $d_b$. Applying this assumption to the bulk particles (
 $\rho _b = 6000\ \text {kg}\ \text {m}^{-3}$,
  $d_b = 1.16\ \text {mm}$,
  $\epsilon = 0.4$) and air (
 $\rho _g = 1.2\ \text {kg}\ \text {m}^{-3}$,
  $\nu = 1.5\times 10^{-5}\ \text {m}^{2}\ \text {s}^{-1}$) yields
  $U = U_{mf,b} = 1.13\ \text {m}\ \text {s}^{-1}$.
Secondly, we assume that the rising/sinking of a cluster is driven by the degree of fluidization of the cluster particles due to the gas flow. This assumption is based on findings by Liu et al. (Reference Liu, Wang, Wu and Jia2010) and Li et al. (Reference Li, Wu, Rehman, Wang, Zhang and Xie2017a,Reference Li, Wu, Zhang and Wangb, Reference Li, Wu, Zhang and Wang2019) who have studied size separation in binary granular materials that have been subjected to combined vibration and fluidizing gas flow. Their research revealed a competition between vibration-induced size separation as well known from the Brazil nut effect (Rosato et al. Reference Rosato, Strandburg, Prinz and Swendsen1987; Knight, Jaeger & Nagel Reference Knight, Jaeger and Nagel1993; Huerta & Ruiz-Suárez Reference Huerta and Ruiz-Suárez2004) and its reverse (Hong, Quinn & Luding Reference Hong, Quinn and Luding2001; Jenkins & Yoon Reference Jenkins and Yoon2002; Trujillo, Alam & Herrmann Reference Trujillo, Alam and Herrmann2003; Breu et al. Reference Breu, Ensner, Kruelle and Rehberg2003; Shinbrot Reference Shinbrot2004; Alam, Trujillo & Herrmann Reference Alam, Trujillo and Herrmann2006) and gas-flow-induced size separation due to differences between the drag and gravitational forces acting on the particles. They found that if the gas velocity  $U$ is close to or above the minimum fluidization velocity of a granular material, size separation can be governed by gas flow effects even for strong vibrational accelerations
  $\varGamma = A(2 {\rm \pi}f)^{2}/g > 1$. Under such boundary conditions, binary granular materials segregate according to their
  $U_{mf}$ values with the material of lower
  $U_{mf}$ segregating on top of the material with the higher
  $U_{mf}$. In our studies, we use
  $\varGamma = 0.4$ and
  $U=U_{mf,b}$, i.e. size separation is dominated by gas flow effects. Hence, we hypothesize that a granular bubble rises if the gas flow through the granular bubble gives rise to a drag force that is larger than the particle weight (
 $u_c > U_{mf,c}$) and the granular droplet sinks for
  $u_c < U_{mf,c}$; a granular cluster is neutrally buoyant if
  $u_c = U_{mf,c}$. From the analytical gas shift model we have
  $u_c = U U_c^{*}$ and
  $U_{mf,c}$ can be calculated via (5.2). Although vibration may reduce
  $U_{mf}$ of granular particles for
  $\varGamma \geqslant 1$ (Gupta & Mujumdar Reference Gupta and Mujumdar1980; Mawatari, Tatemoto & Noda Reference Mawatari, Tatemoto and Noda2003) and
  $\varGamma < 1$ (McLaren et al. Reference McLaren, Metzger, Boyce and Müller2021), we assumed that vibration does not affect appreciably the neutral buoyancy limit of the granular cluster because the net drag that leads to the rise of a granular bubble is dominated by the effective gas flow. Small fluctuations in the drag force due to vibration are expected to cancel out over a full vibration cycle. However, the dynamics of a granular material in a vibro-gas-fluidized bed might change once the vibrational acceleration exceeds gravity, i.e. for
  $\varGamma >1$. Hence, to restrict the potential influence of vibration on the emergence of a granular cluster and ensure validity of the previous assumptions, we limit the following derivation to
  $\varGamma < 1$.
With these two assumptions at hand, the neutral buoyancy limit can be calculated as a function of  $d^{*}$,
  $W^{*}$,
  $Re_b$ and
  ${Ar}_b$. Figure 3(b) plots the relative density difference
 \begin{equation} \Delta\rho^{*} = \left(\rho_c -\rho_g\right)\left(\rho_b - \rho_g \right)^{{-}1} \end{equation}
required to establish a neutrally buoyant granular cluster of width  $W^{*}$ as a function of
  $d^{*}$ at constant
  $U$ (later referred to as the ‘neutral buoyancy limit’). We observe that
  $\Delta \rho ^{*}$ decreases monotonically with increasing
  $d^{*}$. For
  $d^{*} < 1$, the density of the cluster particles must be larger than the density of the bulk particles to achieve neutral buoyancy, and vice versa for
  $d^{*} > 1$. The monotonic behaviour is due to the particle size dependence of
  $U_{mf,c}$. This dependence is depicted for
  $W^{*} = 1$, i.e. the entire bed is filled with cluster particles and no gas shift occurs (
 $U_c^{*} = 1$). Here, a constant
  $U$ leads to
  $\Delta \rho ^{*} \rightarrow \infty$ (0) when
  $d^{*} \rightarrow 0$ (
 $\infty$). For
  $W^{*} < 1$, the
  $\Delta \rho ^{*}$-curves increasingly flatten with decreasing
  $W^{*}$ due to the gas shift to/from the granular cluster. As confirmed in Appendix C, the density of the cluster particles must be equal to the density of the bulk particles to be neutrally buoyant for
  $W^{*}\rightarrow 0$ (dashed line in figure 3b). To summarize, our model predicts a granular bubble to rise if
  $\Delta \rho ^{*}$ is below the neutral buoyancy limit for any given
  ${Ar}_b$,
  $Re_b$,
  $W^{*}$ and
  $d^{*}$, otherwise a granular droplet sinks.
6. Construction of a regime map
Using the present analytical model, we constructed a regime map that predicts the rising or sinking of a granular bubble/droplet of a given size  $W^{*}$ (figure 4). In order to test the validity of the regime map, numerical simulations were performed to probe the
  $\Delta \rho ^{*}$-
 $d^{*}$ space for a fixed cluster size of
  $W^{*} = 0.15$,
  $Re_b = 88.75$ and
  ${Ar}_b = 3.40\times 10^{5}$. Examples of such simulations are depicted in the time series shown in the figures 5, 8, 9, 10 and 11. The occurring motion patterns of the different granular clusters simulated were classified and marked in the regime map (figure 4). Five different regimes were identified: rising bubbles, rising fingers, disintegrating bubbles, sinking droplets and stagnant cones. The previous experimental study of McLaren et al. (Reference McLaren, Kovar, Penn, Müller and Boyce2019) has identified only the rising bubble and sinking droplet regimes. As can be seen in the regime map, the first four regimes are in agreement with our neutral buoyancy model and their regime boundaries coincide with the neutral buoyancy limit for
  $W^{*} = 0.15$ and
  $W^{*} = 0$ (i.e.
  $\Delta \rho ^{*} = 1$). Moreover, the experiments summarized in table 3 align with this regime map and agree with the numerical findings. As can be seen in figure 4, the existence of all five regimes can be confirmed by experiments. In the following, the characteristics of the different regimes will be discussed.

Figure 4. Regime map for a granular cluster with  $W^{*} = 0.15$,
  $Re_b = 88.75$ and
  ${Ar}_b = 3.40\times 10^{5}$. The solid and dashed lines are the neutral buoyancy limits for
  $W^{*} = 0.15$ and 0, respectively. The following regimes are observed: sinking droplet (
 $\vartriangle$, blue region), stagnant cone (
 $\triangledown$, purple region), rising finger (
 $\triangleright$, red region), rising bubble (
 $\triangleleft$, yellow region) and disintegrating bubble (
 $\Diamond$, green region). Coloured symbols are the results of the Eulerian–Lagrangian simulations. The grey filled symbols are results of the experiments listed in table 3. The images show a snapshot of the transformation of an initially square-shaped cluster in the respective regime.

Figure 5. Time series of a rising bubble as obtained by (a) simulations and (b) experiments (table 3 A). Both rows show a cluster with  $d^{*}=2$ and
  $\Delta \rho ^{*}=0.9$. Time steps of the images are
  $\Delta t = 0.5$ s for simulations and 1 s for experiments.
6.1. Rising bubble regime
Rising bubbles occur if  $\Delta \rho ^{*}$ is below the neutral buoyancy limit of the cluster for
  $d^{*} \geqslant 1$ or below
  $\Delta \rho ^{*} = 1$ for
  $d^{*} < 1$ (
 $\triangleleft$, yellow region in figure 4). In this region, the cluster particles form a bubble that rises through the bulk phase to the top of the bed, as seen in figure 5. Rising granular bubbles form when the gas velocity in the bubble exceeds the minimum fluidization velocity of the cluster particles and an effective drag pushes the cluster particles upwards.
As can be seen in figure 6(b), the cluster particles within a granular bubble exhibit a circulation flow that resembles vortex structures found in fluid bubbles rising in a denser fluid (Hill & Henrici Reference Hill and Henrici1894; Hadamard Reference Hadamard1911; Rybczynski Reference Rybczynski1911; Batchelor Reference Batchelor2000). Particles from the centre of the bubble move towards its roof, whereas particles close to the side boundaries of the bubble move towards its bottom. At the bubble wake, individual particles detach, forming a tail. The existence of such an internal circulation pattern in granular bubbles points to a fluid-like state of granular matter in and around the bubble. A comparison of the panels of figure 6 reveals that the shape of the bubble and the circulation pattern therein depend on  $\Delta \rho ^{*}$. For small values of
  $\Delta \rho ^{*}$ far away from the neutral buoyancy limit, e.g.
  $\Delta \rho ^{*}=0.4$ in (c), the bubble is spherical cap-shaped and exhibits a pronounced circulation flow. Increasing
  $\Delta \rho ^{*}$ to 0.8 (figure 6b) yields a spherical bubble and a circulation pattern which has striking similarities to Hill's spherical vortex (Hill & Henrici Reference Hill and Henrici1894). Increasing
  $\Delta \rho ^{*}$ further towards the neutral buoyancy limit leads to elongated bubbles with an attenuated inner circulation pattern and a pronounced tail, as can be seen in figure 6(a) and figure 7. This observation raises the question of why a tail is only formed for certain types of granular bubbles. To answer this, we have analysed the number of particles
  $N_{Tail}$ that are found in the tail after a bubble has reached a height of
  $y/H = 0.8$ for various combinations of
  $d^{*}$ and
  $\Delta \rho ^{*}$. Following Nitsche & Batchelor (Reference Nitsche and Batchelor1997), who have studied the break-up of a falling drop containing suspended particles in a liquid, all particles within a vertical distance of
  $1.5W_c$ below the topmost cluster particle are considered to be in the bubble. All other particles are regarded as part of the tail. Figure 7(a–d) shows the division of cluster particles into bubble and tail particles for granular bubbles using
  $d^{*}=1.25$ and
  $\Delta \rho ^{*}=0.4$, 0.7, 0.85, and 0.93, respectively. Again, the size of the tail increases for increasing
  $\Delta \rho ^{*}$. Figure 7(e) displays the ratio of
  $N_{{Tail}}$ to the total number of cluster particles
  $N$ as a function of
  $d^{*}$ and
  $\Delta \rho ^{*}$. It can be seen that, for
  $d^{*}>1$,
  $N_{{Tail}}/N$ is close to zero for small values of
  $\Delta \rho ^{*}$. Once
  $\Delta \rho ^{*}$ exceeds a certain threshold, the number of particles in the tail increases significantly with increasing cluster particle density. This threshold decreases monotonically from 0.8 for
  $d^{*}=1.25$ to 0.4 for
  $d^{*}=2$. Only for
  $d^{*}=2.75$ the threshold seems to be increasing again. For clusters with
  $d^{*}\leqslant 1$ no significant tail is formed at all and
  $N_{{Tail}}/N$ is (close to) zero. A possible explanation for the onset of tailing can be found when inspecting the effective drag acting on the cluster particles. According to Li et al. (Reference Li, Wu, Rehman, Wang, Zhang and Xie2017a), the effective acceleration on a particle in a vibro-gas-fluidized system can be expressed as
  $\Delta a/g= (|\boldsymbol {F}_{d,c}|-mg)/(mg)= 1-(U/U_{mf,c})^{2}$ provided
  $\epsilon$ is constant and drag dominates vibration in particle segregation. Imagine a single particle detaches from a granular bubble, leaves the zone of preferential gas flow and disperses in the bulk phase. This particle is only able to rise if the drag on it exceeds gravity, i.e.
  $\Delta a/g>0$, otherwise it would stay in the tail. Hence the particle would rise if the local superficial gas velocity
  $u$ exceeds the minimum fluidization velocity
  $U_{mf,c}$. Since the detached cluster particle is surrounded by bulk particles only,
  $u$ will be close to the inlet velocity of the fluidized bed
  $U$. Using this information, one can readily plot the effective drag for various diameters
  $d^{*}$ (figure 7f). Indeed, the roots of
  $\Delta a/g=0$ (for a given
  $d^{*}$) predict well the thresholds for tailing found in figure 7(e). However, simulations with
  $d^{*}=2.75$ fall outside this trend. This could be explained by the fact that the cluster particles are fairly large compared with the bulk particles and distort the local packing structure changing in turn the gas flow field. Despite the similarities of a granular bubble with sedimenting particle droplets (Nitsche & Batchelor Reference Nitsche and Batchelor1997), a mathematical relation for the rate of particles leaving the bubble has not yet been found.

Figure 6. Motion of the cluster particles within a rising granular bubble for  $\Delta \rho ^{*} = 0.9$ (a), 0.8 (b) and 0.4 (c). Trajectories of 100 particles are shown in a reference frame moving with the centre of mass of the bubble. The colour grading of the trajectories corresponds to the progressing time with dark violet for a bubble at
  $t(y/H=0.4)$ and bright yellow at
  $t(y/H=0.8)$. The background shows the location of the cluster particles (grey) when the top of the bubble has reached the height
  $y/H =0.8$ in the bed. All results were obtained from simulations with
  $W^{*}=0.15$,
  $Re_b = 88.75$,
  ${Ar}_b=3.40\times 10^{5}$ and
  $d^{*}=1.25$.

Figure 7. Emergence of a particle tail in the wake of a rising granular bubble. Panels (a–d) show granular bubbles as a function of  $\Delta \rho ^{*}$ with
  $d^{*} = 1.25$, when their roof has reached
  $y/H = 0.8$. In analogy to Nitsche & Batchelor (Reference Nitsche and Batchelor1997), all particles within a vertical distance of
  $1.5W_c$ from the topmost particle are considered to be part of the bubble (blue), otherwise the particles are considered to be part of the tail (grey). (e) The number of particles found in the tail
  $N_{Tail}$ normalized by the number of particles initialized in the bubble
  $N$. The value of
  $N_{{Tail}}/N$ depends on
  $d^{*}$ and
  $\Delta \rho ^{*}$. All points are obtained from numerical simulations of bubbles at
  $y/H = 0.8$. The lines are fitted power functions and only guidelines to the eyes. (f) Dependence of the normalized, effective drag of a cluster particle
  $\Delta a/g$ on
  $\Delta \rho ^{*}$ for varying
  $d^{*}$.
  $\Delta a/g= (|\boldsymbol {F}_{d,c}|-mg)/(mg)= 1-(U/U_{mf,c})^{2}$ for constant
  $\epsilon$ and
  $U\geqslant U_{mf,c}$ with
  $U_{mf,c}$ calculated from (5.2).

Figure 8. Time series of a rising finger. (a) Euler–Lagrange simulation of a cluster with  $d^{*}=1.75$,
  $\Delta \rho ^{*}=0.9$ and
  $\Delta t = 2$ s. (b) Experiment (table 3 G) with
  $d^{*}=1.8$,
  $\Delta \rho ^{*}=0.9$ and
  $\Delta t = 8$ s.
6.2. Rising finger regime
The strong tailing of a granular cluster as  $\Delta \rho ^{*}$ approaches the neutral buoyancy limit leads to a change in the motion behaviour of the cluster. Instead of rising as a coherent, spherical collective, the cluster forms an elongated and thinning stream of particles rising in the bulk phase. This change in the motion dynamics indicates the existence of a distinct regime, here referred to as rising fingers. Rising fingers occur for clusters with
  $d^{*} > 1$ and
  $\Delta \rho ^{*}$ between the neutral buoyancy limit and
  $\Delta \rho ^{*} = 1$ (
 $\triangleright$, red region in figure 4). An example for a rising finger is given in figure 8. The finger is thickest for
  $\Delta \rho ^{*}$ close to the neutral buoyancy limit (
 $W^{*} = 0.15$) and becomes thinner as
  $\Delta \rho ^{*}$ approaches unity. The motion of a granular finger is described in two stages: at first, the rising finger elongates quickly, where the lower part of the finger is almost stagnant and only the top part is moving upwards. As the finger becomes thinner, the rise speed of the top part of the finger decays until it almost stops rising. Rising granular fingers seldom reach the top surface of the fluidized bed. Analysis of the gas flow within a rising finger reveals that the initial elongation of a rising finger is driven by an increased gas flow inside the granular finger. After a strong elongation and thinning of the finger, the cluster particles are then propelled by small gas bubbles that form in the top part of the finger. Our analytical model helps explain the emergence of rising fingers: if
  $\Delta \rho ^{*}$ is larger than the neutral buoyancy limit,
  $u_c$ is insufficient to levitate the entire granular cluster. However, decreasing the cluster width increases the gas velocity inside the finger (see figure 3a) such that the cluster particles experience a positive effective drag. Thus, the rising finger is stabilized by its decreasing thickness. During elongation, the width of the finger decreases until the cluster particles stop behaving as a coherent cluster due to their immersion into the bulk phase. As there is still an increased permeability of the packing due to the larger cluster particles, gas flows preferentially along this thin tail forming small gas bubbles at the top of the finger as
  $u$ strongly exceeds
  $U_{mf,b}$ in this region.
6.3. Disintegrating bubble regime
In contrast to the self-stabilized rising fingers, disintegrating bubbles form for  $d^{*} < 1$ and
  $\Delta \rho ^{*}$ between unity and the neutral buoyancy limit (
 $\Diamond$, green region in figure 4). Here, the cluster can rise as a coherent granular bubble, but particle fluctuations and emerging gas bubbles during its rise induce its disintegration as seen in figure 9. According to our model, the granular bubble particles rise because
  $\Delta \rho ^{*}$ is below the neutral buoyancy limit. However, the low
  $U_{mf,c}$ of the cluster particles combined with the low permeability (
 $d^{*}<1$) of the cluster makes this granular bubble an unstable configuration. In the case that a small void is created in the granular cluster due to the vibrations, gas suddenly flows into this highly permeable region of the cluster and increases the gas velocity. The gas flow inflates the size of the void and pushes the cluster particles upwards into the bulk phase. Repetitions of this process lead to a disintegrating bubble. If the cluster particles are sufficiently small compared with the bulk particles, they disperse in the surrounding bulk phase filling the interstitial voids, as seen in figure 9(b).

Figure 9. Time series of a disintegrating bubble. (a) Euler–Lagrange simulation of a cluster with  $d^{*}=0.5$,
  $\Delta \rho ^{*}=1.1$ and
  $\Delta t = 2.4$ s. (b) Experiment (table 3 H) with
  $d^{*}=0.38$,
  $\Delta \rho ^{*}=1.11$ and
  $\Delta t = 6$ s. In the experiment, cluster particles are dark grey, bulk particles are light grey, whereas emerging gas bubbles are black.
6.4. Sinking droplet regime
For values of  $\Delta \rho ^{*}$ significantly larger than unity, a granular droplet sinks (
 $\vartriangle$, blue region in figure 4), as the cluster particles are too heavy to be carried up by the drag exerted by the gas flow. During its descent, the sinking droplet flattens and performs ultimately a binary split (figure 10). The splitting of such a granular droplet is not caused by the cluster's proximity to the bottom of the fluidized bed, but is a property that also exists for larger distances to the confining walls. McLaren et al. (Reference McLaren, Kovar, Penn, Müller and Boyce2019) discovered the splitting of these droplets and a detailed analysis on the mechanism behind the droplet splitting can be found in Metzger et al. (Reference Metzger, McLaren, Pinzello, Conzelmann, Boyce and Müller2022).

Figure 10. Time series of a sinking droplet. (a) Euler–Lagrange simulation of a cluster with  $d^{*}=0.75$,
  $\Delta \rho ^{*}=2.38$ and
  $\Delta t = 1$ s. (b) Experiment (table 3 J) with
  $d^{*}=0.72$,
  $\Delta \rho ^{*}=2.42$ and
  $\Delta t = 2$ s.
6.5. Stagnant cone regime
Although the analytical model predicts that all droplets with  $d^{*} > 1$ and
  $\Delta \rho ^{*}>1$ sink, there is a region for
  $\Delta \rho ^{*}\geqslant 1$ and
  $d^{*} > 1$, where droplets become stagnant and develop a conical shape, termed the stagnant cone (
 $\triangledown$, purple region in figure 4). The lower limit of the stagnant cone regime is at
  $\Delta \rho ^{*} = 1$ and the upper limit increases with increasing
  $d^{*}$. As the stagnant cone particles are too heavy to be neutrally buoyant (
 $\Delta \rho ^{*}>1$), the cluster acts as an additional load and inhibits fluidization of the bulk particles underneath the cluster. However, the net gravitational force of the cluster cannot overcome the interparticle friction in this unfluidized bulk region and thus the cluster remains stagnant. The formation of a cone (figure 11) can be explained by small fluctuations in the local gas velocity due to bed vibration. These fluctuations lead to a temporary fluidization of the cluster particles at the top of the cluster, such that they rearrange to an incipient granular finger. However, the fluctuations cannot maintain fluidization conditions for an extended duration of time, i.e. the cluster particles rest on top of the granular cluster. For
  $\Delta \rho ^{*}\rightarrow 1$, the cone sharpens further until it finally merges into a rising finger for
  $\Delta \rho ^{*}=1$.

Figure 11. Time series of a stagnant cone. (a) Euler–Lagrange simulation of a cluster with  $d^{*}=1.75$,
  $\Delta \rho ^{*}=1.2$ and
  $\Delta t = 4$ s. (b) Experiment (table 3 F) with
  $d^{*}=1.57$,
  $\Delta \rho ^{*}=1.16$ and
  $\Delta t = 60$ s.
6.6. Further considerations
We have performed additional numerical Eulerian–Lagrangian simulations in which we varied the cluster width and were able to confirm the validity of the neutral buoyancy limit for a series of  $W^{*} = [0.1, 0.15, 0.3, 0.4]$. However, the derivation of our model requires
  $d_c/W_c \ll 1$ to allow for enough particles in the granular cluster to justify the use of Ergun's equation (Ergun Reference Ergun1952). Also, our model is most accurate for
  $0.4 < d^{*} < 2.5$, as outside these limits small particles percolate into the interstitial voids of the larger particles and change the permeability of the cluster packing.
7. Conclusion
We have investigated the physics controlling the motion of a granular cluster in a pseudo-two-dimensional vibro-gas-fluidized bed. A granular cluster is an agglomeration of granular particles of certain size and density that is submersed in a bulk of particles with different particle size and/or density. When fluidized by combining vibration and gas flow, the granular cluster either rises coherently to the freeboard of the bed (granular bubble) or sinks to the bottom of the bed (granular droplet) depending on the relative size and relative density of the cluster particles and the bulk particles (McLaren et al. Reference McLaren, Kovar, Penn, Müller and Boyce2019). This work investigated the transition between rising granular bubbles and sinking granular droplets and identified the conditions required to form neutrally buoyant granular clusters. Eulerian–Lagrangian simulations revealed the existence of a gas flow heterogeneity in the proximity of a granular cluster, where gas flows preferentially through regions of larger particles due to their increased permeability. This shift in the gas flow pattern (into or out of the granular cluster) affects locally the degree of fluidization of the particles in and around the cluster and in turn significantly influences the motion of the granular cluster itself. Based on a dimensionless gas shift model, we proposed an analytical model predicting the neutral buoyancy limit of a granular cluster assuming that under this condition the local gas velocity matches the minimum fluidization velocity  $U_{mf,c}$ of the cluster particles. If the gas velocity is higher or lower than
  $U_{mf,c}$, the cluster rises or sinks, respectively. Finally, a dimensionless regime map was compiled and tested against both extensive Eulerian–Lagrangian simulations and experiments. This regime map correctly predicts the regimes of rising bubbles and sinking droplets and revealed three distinct, previously unreported, regimes in the transition region: rising fingers, disintegrating bubbles and stagnant cones.
Funding
This work was supported by the Swiss National Science Foundation (grant number 200020_ 182692).
Declaration of interests
The authors report no conflict of interest.
Data availability statement
The data that support the findings of this study are available from the corresponding author upon request. This publication was created as part of NCCR Catalysis (grant number 180544), a National Centre of Competence in Research funded by the Swiss National Science Foundation.
Appendix A. Model equations implemented in the CFD-DEM
DEM was proposed initially by Cundall & Strack (Reference Cundall and Strack1979) and uses a Lagrangian description of the particle phase. The trajectories of the individual particles are determined by the action of interparticle contact forces  $\boldsymbol {F}_{c,j}$, torques
  $\boldsymbol {M}_{c,j}$, gravity
  $\boldsymbol {g}$ and the drag force
  $\boldsymbol {F}_{d,j}$ exerted by the fluid flow around the particles (Tsuji, Kawaguchi & Tanaka Reference Tsuji, Kawaguchi and Tanaka1993; Zhou et al. Reference Zhou, Kuang, Chu and Yu2010). Momentum equations for the translational and rotational motion were solved for each particle
  $j$ of mass
  $m_j$ and diameter
  $d_j$ viz.
 $$\begin{gather} m_j\frac{\mathrm{d}^{2}\boldsymbol{x}_j}{\mathrm{d} t^{2}} = \boldsymbol{F}_{c,j}+\boldsymbol{F}_{d,j} +m_j\boldsymbol{g}, \end{gather}$$
 $$\begin{gather}\frac{1}{10}m_jd_j^{2} \frac{\mathrm{d}{\boldsymbol{\omega}}_j}{\mathrm{d}t}=\boldsymbol{M}_{c,j}. \end{gather}$$
Here,  $\boldsymbol {x}_j$ denotes the position and
  $\boldsymbol {\omega }_j$ the angular velocity of the particle. Details on the implemented contact laws for
  $\boldsymbol {F}_{c,j}$ and
  $\boldsymbol {M}_{c,j}$ are described by Kloss et al. (Reference Kloss, Goniva, Hager, Amberger and Pirker2012). The gas flow (CFD, Eulerian description) was modelled by an incompressible, two-phase formulation of the Navier–Stokes equations including a term
  $\boldsymbol {R}$ to capture the momentum exchange between the gas phase and the suspended particles (Zhou et al. Reference Zhou, Kuang, Chu and Yu2010)
 $$\begin{gather} \frac{\partial \epsilon}{\partial t} +\boldsymbol{\nabla}\boldsymbol{{\cdot}} \left( \epsilon \boldsymbol{u}\right) = 0, \end{gather}$$
 $$\begin{gather}\frac{\partial \left(\epsilon\boldsymbol{u}\right)}{\partial t} +\boldsymbol{\nabla}\boldsymbol{{\cdot}}\left( \epsilon \boldsymbol{u}\boldsymbol{u}\right) ={-}\epsilon \frac{\boldsymbol{\nabla} p}{\rho_g} - \frac{\boldsymbol{R}}{\rho_g} + \epsilon \nu \nabla^{2} \boldsymbol{u} + \epsilon \boldsymbol{g}, \end{gather}$$
where  $\boldsymbol {u}$ is the gas velocity,
  $p$ is the gas pressure,
  $\rho _g$ is the gas density,
  $\nu$ is the viscosity and
  $\epsilon$ is the local void fraction. Here,
  $\epsilon$ was determined from the positions of the particles using the ‘divided void fraction model’ implemented in cfdemCoupling
  $^{\circledR}$ (Kloss et al. Reference Kloss, Goniva, Hager, Amberger and Pirker2012). The momentum exchange
  $\boldsymbol {R}$ between the fluid and the particles inside a finite volume element
  $\Delta V$ was calculated as
 \begin{equation} \boldsymbol{R} = \frac{\varSigma_{j = 1}^{n} \boldsymbol{F}_{d,j}}{\Delta V}. \end{equation}
Here, the drag force  $\boldsymbol {F}_{d,j}$ was described by the Koch–Hill model (Koch & Hill Reference Koch and Hill2001; van Buijtenen et al. Reference van Buijtenen, van Dijk, Deen, Kuipers, Leadbeater and Parker2011) as implemented in cfdemCoupling
  $^{\circledR}$ using the following relations:
 $$\begin{gather} \boldsymbol{F}_{d,j} = \frac{\rm \pi}{6} d_j^{3} \beta_j (\boldsymbol{u}-\boldsymbol{u}_{p,j}), \end{gather}$$
 $$\begin{gather}\beta_j = \frac{18\nu \rho_g \epsilon}{d_j^{2}} F, \end{gather}$$
 $$\begin{gather}F = \epsilon\left(F_0+\tfrac{1}{2}F_3 Re_p\right), \end{gather}$$
 $$\begin{gather}F_0 = \begin{cases} \dfrac{1+3\sqrt{\dfrac{\epsilon_p}{2}}+\dfrac{135}{64}\epsilon_p \ln{(\epsilon_p)}+16.14\epsilon_p}{1+0.681\epsilon_p-8.48\epsilon_p^{2}+8.16\epsilon_p^{3}}, & \text{if $\epsilon_p <0.4$}\\[3pt] \dfrac{10\epsilon_p}{\epsilon^{3}} & \text{if $\epsilon_p \geqslant 0.4$} \end{cases} \end{gather}$$
 $$\begin{gather}F_3 = 0.0673+0.212\epsilon_p+\frac{0.0232}{\epsilon^{5}}, \end{gather}$$
with  $\boldsymbol {u}_{p,j}$ the velocity of particle
  $j$. The local particle volume fraction
  $\epsilon _p$ was calculated as
  $1 = \epsilon _p +\epsilon$ and the particle-based Reynolds number
  $Re_p$ is defined as
  $Re_p = {d_j\epsilon | \boldsymbol {u}-\boldsymbol {u}_{p,j} |}/{\nu }$.
Appendix B. Derivation of the gas shift model
The continuity equation of an incompressible gas flow of constant flow rate  $Q = U W T$ that splits into two parallel flows is given by
 \begin{equation} Q/T = U W = (1-W_c ) u_b + W_c u_c. \end{equation}
Division by  $U W$ and introduction of
  $U_c^{*} = u_c/U$,
  $U_b^{*} = u_b/U$ and
  $W^{*} = W_c/W$ yields
 \begin{equation} 1 = (1-W^{*}) U_b^{*}+W^{*} U_c^{*}. \end{equation}
The pressure drop of a flow through a packing of height  $L$ is given by (Ergun Reference Ergun1952)
 \begin{equation} \frac{\Delta p_i}{L}=\frac{150\mu_g}{d_i^{2}}\frac{(1-\epsilon_i)^{2}}{\epsilon_i^{3}}u_i+\frac{1.75\rho_g}{d_i}\frac{1-\epsilon_i}{\epsilon_i^{3}} u_i^{2}, \end{equation}
where index  $i = [b,c]$ denotes the bulk phase and the cluster phase (i.e. granular droplet/bubble), respectively, and
  $\mu _g = \nu \rho _g$ represents the dynamic gas viscosity. As
  $\Delta p_b/L = \Delta p_c/L$ and
  $\epsilon _b = \epsilon _c = \epsilon$, equating the pressure drop relations of the bulk and the cluster phase yields
 \begin{equation} 0= \left(u_b-\frac{u_c}{(d_c/d_b)^{2}}\right) +\frac{1.75d_b}{150(1-\epsilon)\nu} \left( u_b^{2}-\frac{u_c^{2}}{d_c/d_b }\right). \end{equation}
Now, we substitute  $U_c^{*} = u_c/U$,
  $U_b^{*} = u_b/U$,
  $d^{*} = d_c/d_b$,
  $k = 150(1-\epsilon )/1.75$ and
  $Re_b = Ud_b/\nu$ to form dimensionless groups giving
 \begin{equation} 0=\left(U_b^{*}-\frac{U_c^{*}}{d^{*^{2}}} \right)+\frac{Re_b}{k} \left(U_b^{*^{2}}-\frac{U_c^{*^{2}}}{d^{*}} \right). \end{equation}
The combination of (B2) and (B5) determines the values of  $U_c^{*}$ and
  $U_b^{*}$ for given
  $d^{*}$,
  $W^{*}$ and
  $Re_b$.
Appendix C. Proof that  $\Delta \rho ^{*} = 1$ for $W^{*} \rightarrow 0$


The starting point of the neutral buoyancy limit for an infinitely small cluster ( $W^{*} \rightarrow 0$) is the determination of the gas shift in/around the granular bubble/droplet. The continuity equation reads
  $U_b^{*} = 1$ and the pressure relation yields
 \begin{equation} 0=\left( 1-\frac{U_c^{*}}{d^{*^{2}}} \right) +\frac{Re_b}{k} \left(1-\frac{U_c^{*^{2}}}{d^{*}} \right). \end{equation}
This expression is a quadratic equation that is solved for  $U_c^{*}$ with the positive solution
 \begin{equation} U_c^{*}={-}\left(2k\,Re_b d^{*} \right)^{{-}1}+\sqrt{\left(2k\,Re_b d^{*} \right)^{{-}2}+d^{*}\left(k\,Re_b\right)^{{-}1}+d^{*} }. \end{equation}
Next, the minimum fluidization velocity of each particle type is determined by (Kunii & Levenspiel Reference Kunii and Levenspiel1991)
 \begin{equation} \frac{1.75}{\epsilon^{3}}\left( \frac{d_i U_{mf,i}}{\nu}\right)^{2}+ \frac{150(1-\epsilon)}{\epsilon^{3}} \left( \frac{d_i U_{mf,i}}{\nu} \right) = \frac{d_i^{3}(\rho_i -\rho_g)g}{\rho_g \nu^{2}}, \end{equation}
where we define  ${Ar}_i = {d_i^{3}(\rho _i -\rho _g)g}/(\rho _g \nu ^{2})$,
  $Re_i = {d_i U_{mf,i}}/{\nu }$ and
  $i = [b, c]$, i.e.
 \begin{equation} \frac{1.75}{\epsilon^{3}} Re_i^{2}+ \frac{150(1-\epsilon)}{\epsilon^{3}} Re_i = {Ar}_i. \end{equation}
For  $i = c$, this equation yields, by substituting
  $Re_c = Re_b d^{*} U_c^{*}$,
 \begin{equation} \frac{1.75}{\epsilon^{3}} Re_b^{2} \left(d^{*} U_c^{*} \right)^{2} + \frac{150(1-\epsilon)}{\epsilon^{3}} Re_b d^{*} U_c^{*} = {Ar}_c. \end{equation}
Next, the definition of  $k$ is inserted into (C2) and the result is then substituted into (C5). Simplifying the expression results in
 \begin{equation} d^{*^{3}} \left[\frac{1.75}{\epsilon^{3}} Re_b^{2}+ \frac{150(1-\epsilon)}{\epsilon^{3}} Re_b \right] = {Ar}_c. \end{equation}
The bracketed term in (C6) can be replaced by  ${Ar}_b$, yielding
 \begin{equation} d^{*^{3}} {Ar}_b= {Ar}_c. \end{equation}
Finally, re-substitution of the  ${Ar}_i$ definition and defining the relative density ratio to be
 \begin{equation} \Delta \rho^{*} = \frac{\rho_c -\rho_g}{\rho_b-\rho_g} \end{equation}
leads to
 \begin{equation} \rho_b-\rho_g = \rho_c - \rho_g \leftrightarrow \Delta \rho^{*} = 1. \end{equation}
Appendix D. Effect of particle friction on the gas shift
Deriving (4.4), we assumed a constant local void fraction of  $\epsilon \approx 0.4$ for both the granular cluster and its surrounding bulk. For spherical particles of comparable particle size distribution this is only fulfilled if the cluster particles and the bulk particles have similar coefficients of friction. Once the coefficient of friction of the cluster particles
  $\mu _c$ differs significantly from the coefficient of friction of the bulk particles
  $\mu _b$, both particle types create packings of different void fraction. According to Ergun's equation (Ergun Reference Ergun1952), this leads to changes in the local permeability and influences the gas shift. To demonstrate the effect of void fraction on the dynamics of a granular cluster, additional simulation with
  $d^{*} = 1$ and
  $\Delta \rho ^{*} = 1$ have been performed only changing the coefficient of friction of the cluster particles
  $\mu _c$ from 0 to 1 while
  $\mu _b$ was held constant at 0.15. This approach allowed us to initialize clusters of varying cluster void fraction
  $\epsilon _c$. Except for the coefficient of friction, the cluster and bulk particles were identical. As can be seen in figure 12(e), the local void fraction
  $\epsilon _c$ in the cluster is higher than the average void fraction of the bulk phase
  $\langle \epsilon _b\rangle$, i.e.
 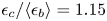 $\epsilon _c/\langle \epsilon _b\rangle = 1.15$, for
  $\mu _c = 1$. On the other hand, for
  $\mu _c = 0$,
 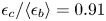 $\epsilon _c/\langle \epsilon _b\rangle = 0.91$, see figure 12(a). Due to these disturbances in the local void fraction, the fluidizing gas flows preferentially into the cluster (
 $U_c^{*}>1$) for
  $\mu _c = 1$ and around the cluster (
 $U_c^{*}<1$) for
  $\mu _c = 0$. As expected, for
  $\mu _c = 0.15$, no gas channelling occurs, see figure 12(c). The local increase/depletion of gas flow in the cluster leads to a condition in which the cluster particles are exposed to a gas velocity above/below
  $U_{mf,c}$ and thus rise/sink, respectively. Accordingly, the granular cluster stretches and rises for
  $\mu _c = 1$, flattens and sinks for
  $\mu _c = 0$, and does not deform significantly for
  $\mu _c = 0.15$, as can be seen in figure 12(b,d,f). This finding supports our argument of neutral buoyancy for clusters that fulfil the condition
  $u_c = U_{mf,c}$. In addition, we see that the assumption of homogeneous void fraction is only fulfilled for beds containing particles of equal coefficients of friction. As the majority of our study was performed with
 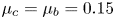 $\mu _c = \mu _b = 0.15$, the effect of particle friction on the void fraction was neglected, justifying the simplification made in (4.4).

Figure 12. Influence of the coefficient of friction of the cluster particles  $\mu _c$ on the evolution of a granular cluster with
  $d^{*} = 1$ and
  $\Delta \rho ^{*} = 1$. Panels (a,c,e) show the value of
  $U^{*}$ (red solid line) and
  $\epsilon / \langle \epsilon _b\rangle$ (blue dashed line) along a horizontal line through the centre of a granular cluster with
  $\mu _c=0$, 0.15 and 1, respectively. The black dotted lines represent the edges of the cluster at
 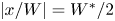 $\lvert x/W \rvert = W^{*}/2$. Panels (b,d,f) show the respectively forming granular clusters (dark grey), immersed in the bulk (light grey particles), after
  $t = 8\ \text {s}$ of vibro-gas-fluidization. The red rectangle marks the initial position of the granular cluster at
  $t = 0\ \text {s}$. All results were obtained from simulations with
  $Re_b = 88.75$,
  ${Ar}_b= 3.4\times 10^{5}$ and
  $\mu _b = 0.15$.
Appendix E. Effect of the coefficient of restitution on the motion of a granular bubble
Additional simulations have been performed to evaluate the effect of the coefficient of restitution  $e$ on the rise behaviour of a granular bubble. Varying
  $e$ in a wide range from 0.1 to 0.95, we found only negligible influence of the value of
  $e$ on the evolution of a granular bubble, as can be seen in figure 13. With increasing
  $e$, the rise of a granular bubble starts earlier, e.g. for
  $e = 0.95$ (d) the motion sets in before
  $t = 1.5$ s, whereas for
  $e = 0.1$ (a) no significant motion can be seen until
  $t = 3$ s. This is because the duration of the start-up phase until the entire bed is mobilized by vibration increases for decreasing
  $e$ due to an increased rate of energy dissipation. However, the time required for the granular bubble to reach the top of the bed does not change significantly with
  $e$. Moreover, the shape of the rising bubble is hardly influenced by the value of
  $e$, as can be seen in figure 13. Thus, the use of a comparatively low value
  $e=0.3$ to speed up the simulations is justifiable.

Figure 13. Effect of the coefficient of restitution  $e$ of the particles on the evolution of a granular bubble with
  $d^{*} = 1.5$ and
  $\Delta \rho ^{*} = 0.417$. The coefficient of restitution increases from 0.1 (a) to 0.95 (d). Each column shows a snapshot of the granular bubble at the indicated time
  $t$ after starting the vibro-gas-fluidization. Cluster particles are white, bulk particles are black. All results were obtained from simulations with
  $Re_b = 88.75$,
  ${Ar}_b= 3.4\times 10^{5}$ and
  $\mu _b = 0.15$.


 Open access