


State of the Jan Mayen Glaciers
The 1959 and 1961 University of London Jan Mayen and Beerenberg Expeditions have reported a new advance of most of the island’s glaciers, estimated to date from about 1954 and to have accelerated since 1959. Measurements were concentrated on the southern glacier, Sørbreen, which has its origin in the ice fields on the upper part of the mountain outside the crater. This is the most accessible of the Jan Mayen glaciers and has been most frequently reported on in the past. Previous observations are summarized in Table I.
Table I. Variations of Sorbreen, Jan Mayen

Eruptions of the volcano may have disturbed the glaciers a century and more ago, and must be considered if only to dismiss them as regards any significant interference with the response of the glaciers to the changing climate. The island is elongated in a north-east to south-west direction, the volcano Beerenberg (2,277 m.) occupying the north-eastern end and being 15 km. broad at sea-level; a low-lying neck in the middle of the island joins this mountain to another piece of mountainous terrain forming the south-western end of Jan Mayen, which is almost 60 km. long. The isthmus, on or near which the weather station has always been situated since it began in 1921, has been built up materially by lava flows since the island was first known in the early seventeenth century, and a small off-lying isle has become joined on at this point. Eruptions were observed in 1732 (only fire and ash for 28 hours), 1746 and 1818. Continued activity was indicated by steam issuing from the south-western end in 1882–83, though abnormal heat flow at this point would not affect the glaciers. The eruption in 1818 may have melted some of the ice observed by Scoresby the year before, but it was not a great eruption and from the position of the erupting point any effect on the glaciers was probably negligible.
Scoresby revisited the island in 1834, but no noteworthy change in the glaciers seems to have been reported; the lack of sea ice anywhere in the vicinity in thatyear was the remarkable feature. The island was visited again in July 1856 by Lord Dufferin who found it heavily beset by the sea ice: from his difficulty in getting ashore at any point—his first approach was evidently opposite Sørbreen though he tried all the eastern and northern sides—and his account of “seven enormous glaciers roll[-ing] down into the sea” it appears that the ice cover on Beerenberg was probably greater than either in 1817 or 1876. Lord Dufferin’s is the only known observation from this period which probably contained the climax of the glaciation.
Retreat of the glacier snouts had certainly begun by 1882, a time when some deficiency of precipitation is more likely to have been responsible than change of temperature, since it was a cold epoch with much sea ice. After 1882 there was a great retreat, in which rising temperatures must ultimately have played some part. This was followed by some advance in the cold decade 1910–19 to a stand around 1920 which has left ice-cored moraines (though some of these are being absorbed by the now advancing ice). The advance to the 1920 stand may be associated partly with increased precipitation in the decade of vigorous atmospheric circulation and cyclonic activity about fifteen years earlier—cf. the precipitation curves for Bode and Teigarhorn in Figure 3 and the circulation maps for 1900–09 in Lamb and Johnson (Reference Lamb and Johnson1959, Reference Lamb and Johnson1961). By 1938 (Reference JenningsJennings, 1948) the glaciers were in rapid retreat and this continued through (or after) the cold years 1940–42. There was a few months’ interruption of weather observations on Jan Mayen in 1940–42, occasioned by the war. It can, however, be accepted that these years of the great European winters were particularly cold years at Jan Mayen and probably elsewhere in the Norwegian sector of the Arctic (Reference Hesselberg, Johannessen and SutcliffeHesselberg and Johannessen, 1958). There was also a change of observing site 5–6 km. across to the north-west shore of the isthmus, which appears unimportant in relation to the scale of the mountain to the north-east of both sites and the magnitude of the trend towards greater precipitation.
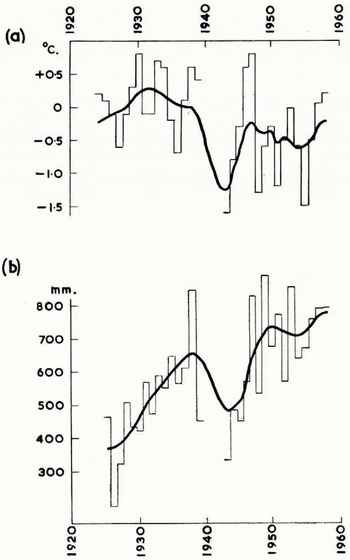
Fig. 1. Trends at Jan Mayen. (a) Temperature. (b) Precipitation. Bold curves, smoothed. Narrow line indicates yearly values

Fig. 2. Upper air temperature and thickness (height difference) of the 1,000–500 millibar layer over Jan Mayen, annual mean values

Fig. 3. Annual precipitation totals. Bold curves, smoothed. Narrow line indicates yearly values. Years with missing months have been omitted
The 1961 observations showed features characteristic of an advancing glacier. The snout had not only advanced but had thickened and the terminal ice wall had increased in height. The breadth of the glacier had also increased. Surface flow rates measured by lines of stakes set up across the glacier at altitudes about 100, 300 and 900 m. increased with height (being respectively 4.6, 6.9 and 32.8 cm./day over the summer season mid June to mid-August).
Temperature and Precipitation at Jan Mayen
In Figure 1 the yearly average surface temperature and total precipitation figures for Jan Mayen have been smoothed by a [4-] [4] smoothing function, namely the operator
where Y n stands for the value for the year n and Y n−1 for the value for the year before n and so on. Values for the individual years are shown by a narrow line. In this the change of site of the observing station during the war has been ignored on the grounds that there was no semblance of effects likely to be attributable to it, nor was the change such that for topographical reasons any obvious effects (except perhaps on winds from the north-east) would be expected. In the period 1941 to 1948 there were several further slight changes of site believed trivial in relation to the magnitudes of the trends appearing in the Jan Mayen temperature and precipitation series. Values are plotted against year n in Figure 1.
The trend of annual mean surface temperature at Jan Mayen since the 1920’s is in close agreement with the trend of indices of the vigour of the general atmospheric circulation over the North Atlantic (Reference Lamb and JohnsonLamb and Johnson, 1959, Reference Lamb and Johnson1961). It is to be expected that epochs of maximum vigour of the atmospheric circulation should coincide with least cold conditions in the Arctic, owing to the increased exchange with other latitudes. Maximum strength of the surface winds in and around Greenland, Spitsbergen and the seas north of Iceland around 1930–38, followed by less frequent gales there since and increasing windiness south of Iceland, is also apparent from the wind observations at land stations and from ships at sea (Reference LambLamb, 1957). It is also known that the sea ice was being driven out of the central Arctic in the 1930’s and melting off east Greenland at rates unmatched before or since in the years of which we have any adequate record.
There was no further fall of temperature at Jan Mayen from the 1940’s to the 1950’s, the two decade means being inappreciably different from each other. In this, however, Jan Mayen appears as a somewhat localized exception to a general cooling of the Arctic surface temperatures by 1° C. or rather more from the 1940’s to 1950’s (Reference MitchellMitchell, 1961, Reference Mitchellin press), which has produced symptoms of a modest increase of the sea ice—cf. figures for overall area of the ice and its incidence at the coast of Iceland given by Lamb and Johnson (Reference Lamb and Johnson1959, p. 124).
The net fall of annual mean surface temperature at Jan Mayen from +0.06° C. in the warmest decade 1927–36 to −0.35° C. in the latest decade 1952–61, though slight, is statistically significant at about the 3 per cent level (Student’s t-test). 1955 was decidedly colder than any year in the warmest decade and 1952, 1954 and 1959 were all comparable with the two coldest years of the time around 1930.
Changes of upper air temperature over Jan Mayen are examined in Figure 2. Actual annual mean temperatures observed over Jan Mayen at the 850, 700 and 500 mb. levels are only shown from 1955, taken from Monthly Climatic Data for the World (U.S. Weather Bureau). 1,000–500 mb. thickness values can, however, be carried back to 1947 (top two curves in Figure 2) by interpolation from the isopleths drawn on the charts of the British and German weather services, based upon the network of radio-sonde ascents in Greenland, Iceland and Europe. The topmost curve (Fig. 2) shows the result of a [4-] [4] smoothing of the annual thickness values seen in the graph just below it. A change of 20 m. in 1,000–500 mb. thickness corresponds to a 1° C. change in the mean temperature of the air column. It must be admitted that the apparent rising trend of upper air temperatures over the years available is small, amounting to something less than a degree Celsius, and cannot be verified as beyond the limits of observational inhomogeneities. Few, if any, trends of upper air temperature over the Arctic have so far been published. This first fragment of evidence, if real, may represent a somewhat local peculiarity of Jan Mayen—as in the case of the surface temperatures which remained steady or slightly rising there from the 1940’s to the 1950’s. The evidence is important in the present connection, however, as indicating that the beginnings of advance in the Jan Mayen glaciers, particularly at the higher levels, are unlikely to be attributable to a down-turn of the temperatures prevailing.
From Figure 1 (b) it does appear that there should be some noticeable results from the great increase of precipitation at Jan Mayen, amounting to nearly 100 per cent since the 1920’s, with possibly some contributory effect attributable to the slight fall of temperature away from the level of 1930. Both, however, imply a lag of about 15 years in the response of the Sørbre snout to changes of atmospheric conditions, unless we are to attribute a decisive and surely inordinate importance to the individual cold years since 1940–43, viz. 1948 and 1955, both of which were dry by comparison with the recent average (1948 T m −1.2° C., R 535 mm.; 1955 Tm −1.5° C., R 672 mm.). The change of precipitation from the earliest decade to the latest appears highly significant in the statistical sense (0.1 per cent level passed, Student’s t-test).
Precipitation Changes at Different Places in this Sector of the Arctic and Sub-Arctic
The magnitude of the rainfall changes in this region accompanying the better-known changes of temperature and circulation regime in the Arctic does not seem to have come to notice hitherto in the meteorological literature. The percentage changes at several of the stations discussed below exceed the greatest changes known to the authors to have been reported in other parts of the world.
Figure 3 shows the rainfall curves for Jan Mayen (lat. 71° N., long. 8° W.); Bodø, Norway (lat. 67° N., long. 14° E.); Angmagssalik, south-east Greenland (lat. 65 5° N., long. 37.5° W.); Stykkisholm, west Iceland (lat. 65° N., long. 22.5° W.); Teigarhorn, east Iceland (lat. 64.5° N., long. 14° W.) and Thorshavn (Hejvig), Faeroe Islands (lat. 62° N., long. 6.5° W.)—a selection of places around the Norwegian/Greenland Sea and north-eastern Atlantic, taken from World Weather Records and the Danish and Norwegian Year Books, and chosen in the belief that the known changes of site are unlikely in these cases to have produced effects comparable in magnitude with the large trends indicated in the region. Unfortunately no curve covering a sufficiently long period of years can be shown for Spitsbergen or points north of Angmagssalik in east Greenland because of short or broken records and changes of site. All the curves have been smoothed as in Figure 1.
It seems possible to explain many of the features of these precipitation trends by reference to changes in prevailing depression tracks and wind directions indicated by the circulation studies of Lamb and Johnson (Reference Lamb and Johnson1959, Reference Lamb and Johnson1961), Reference PetterssenPetterssen (1949) and others. The period of generally low rainfall in the region around 1910–20 was a time when the Atlantic cyclonic activity tended to keep away to the south-west of Iceland or near south Greenland, as indicated by the exceptional case of Angmagssalik where this meant more onshore winds and precipitation was correspondingly high. Precipitation increased after 1920 at all the other places examined, as cyclonic activity became more vigorous and spread farther north, up to the 1930’s or early 1940’s. At its climax this trend probably introduced a tendency for some decrease of rainfall at the Faeroe Islands in the southernmost part of the region examined, because of less frequent depressions in their vicinity. The particularly sharp decline of precipitation in eastern Iceland after the mid-1930’s may partly be due to lee effect, increasingly frequent westerly winds accompanying depressions centred well to the north. Precipitation at Spitsbergen certainly increased up to 1940, though some dry years in the early 1930’s produced a marked oscillation. It seems probable that these variations corresponded fairly well with the frequency of depressions near Spitsbergen. Since the late 1940’s many of these trends have reversed: this too corresponds with a marked new trend of the circulation patterns with the depressions more frequently following southern tracks near the Faeroe Islands and east Iceland.
The continued slight upward trend of precipitation amount at Jan Mayen appears as an enigma in the light of this latest circulation development. At the same time as the depressions have reverted to more southern tracks average atmospheric pressure has risen and northerly wind components have increased in frequency. (Yearly mean pressure values for 1951–60 were above the 1900–39 normal by 3.0 mb. in central Greenland at lat. 70° N., long. 40° W. and by 0.9 mb. at Jan Mayen.) One possible explanation of the precipitation is that moisture content in the warm airmass involved in frontal rain- and snowfall has probably continued to increase, as the secular rise of sea temperature has continued east of Iceland and in the eastern part of the Norwegian Sea or no more than levelled off in the very latest years (see, for instance, Reference RollRoll (1961) and values for the Norwegian weather ship station M (lat. 66° N., long. 2° E.)).
Precipitation is fairly well distributed around the year at all the places here represented but with a distinct maximum in the six months September to February—at Jan Mayen these months account for about two-thirds of the annual total. Variations of the Jan Mayen glaciers over the whole period of observation since 1817 show some inverse correspondence with the pressure level at Trondheim, particularly in December, January and February, which suggests that prevalence of low pressure over the Norwegian Sea and concomitant frequency of cyclonic snowfall has perhaps been the most important control of these glaciers over all this time. This is not an unambiguous index, however, since periods of unusually high pressure at Trondheim must usually be accompanied by an excess of southerly winds over the Norwegian Sea and warm air advection at Jan Mayen. Figure 4 illustrates the trend of pressure at Trondheim in the months named in this paragraph.

Fig. 4. Mean sea-level pressure at Trondheim (lat. 63.4° N., long. 10.5° E.)
Conditions at Spitsbergen
For comparison, Figure 5 shows the changes of prevailing temperature in summer and winter at Isfjord Radio Station, Vestspitsbergen (lat. 78° 04′ N., long. 13° 38′ E.) by five-year mean departures from the 1912–30 period average. This was the method of presenting a homogeneous observation series adopted by Reference Hesselberg, Johannessen and SutcliffeHesselberg and Johannessen (1958), and their figures have been brought up to date using data broadcast under World Meteorological Organization arrangements in monthly CLIMAT messages and Monthly Climatic Data for the World (U.S. Weather Bureau).

Fig. 5. Spitsbergen (Isfjord Radio): departures of average temperature for the summer (June, July, August) and winter (December, January, February) from the average for 1912–30 (5-yr. mean departures)
The slight reversal of the annual temperature trend since the 1930’s so far affects only winter and spring; the most recent summers and autumns have ranked with or near the warmest. Nevertheless, the former general retreat of Spitsbergen glaciers is believed to have greatly slowed down in the last few years, and one or two glaciers have shown signs of advance since 1957 (Reference KosibaKosiba, 1960). It does not seem likely that the colder winters and springs would produce a reversal of the glacier regime.
There are no indications of recent increase of precipitation at Spitsbergen, though the matter cannot be studied satisfactorily because of changes of observing station in 1930 and 1934 and several years’ break in the series in the war. The figures for the observing stations near the west coast suggest a material reduction of the annual precipitation totals since the peak amounts measured in the late 1920’s and 1936–40. The average yearly totals measured at the Grønfjord site (lat. 78° 21′ N., long. 14° 14′ E.) in 1921–29 were 27 per cent, in 1926–29 49 per cent, above the [912–20 figure; and at the present site the average yearly totals measured in 1936–40 were 48 per cent above the 1947–58 figure. However, on a rugged island with mountains up to 1,400 m. high and where winds with easterly components prevail, the trend of precipitation measured at just one part of the west coast is clearly an insufficient guide to variations in the moisture supply to the glaciers.
Evidently the position at Spitsbergen cannot be resolved as yet. The relevant precipitation trend over the mountains may in reality be not so unlike that at Jan Mayen. It is established that the percentage changes of equivalent rainfall on the west coast since 1912–20 have been of as striking magnitude as at Jan Mayen, though in the case of Spitsbergen changes in frequency of east winds, and hence of the orographic effect, must play a significant part as well as changes of frequency of depressions in the vicinity.
Changes of prevailing wind direction at the Isfjord Radio station, Spitsbergen do indicate fewer cyclones in the highest latitudes since 1935–40. Comparisons are complicated by the adoption of thirty-degree sectors instead of octants for wind-direction statistics since 1949; this can, however, be overcome by quoting only ratios of the frequencies of easterly and westerly or northerly and southerly components as is done in Table II. The figures are for the whole year.
Table II. Winds at Isfjord Radio, Spitsbergen

Clearly the increased frequency of easterly winds since the war implies that the sharp decrease of precipitation on the west coast may not have been accompanied by such a great decrease, or even by any decrease at all, in the precipitation on the east side or over the Spitsbergen mountains.
These are points that might usefully be investigated by glaciological techniques on the ice in the interior of the island of Vestspitsbergen.
Periodicities in the Precipitation Over the Jan Mayen Region
The precipitation changes were examined for possible traces of periodicities. This is an aspect of meteorological variations which has seldom proved rewarding. Among the reasons are, first, that few of the agencies responsible, and perhaps only those changes in the energy supply which are produced by the regular astronomical motions of Earth and Sun, etc., really approximate to the form of a sine wave; secondly, that such periodicities as have been found seldom account for more than a small fraction of the variations occurring. For the latter reason, the discovery of a periodic variation does not usually solve the problem of forecasting. Where so much obscurity exists, there is a prospect that discoveries of further suggested periodicities will not be made much use of. Periodogram analysis of the curves here presented did in fact suggest several periodicities with indications of regular phase differences between different parts of the region, but in no case was it possible to establish the validity of the periodicity beyond argument. Most interest attaches to indications of a 2.2-year period in the precipitation at Jan Mayen, which is possibly statistically significant, though the main grounds for believing in the probable existence of a physical cause are to be found in indications of an apparent periodicity of just this length (26 months) in several sorts of atmospheric circulation phenomena in widely separated parts of the world (Reference BerlageBerlage, 1957; Reference EbdonEbdon, 1961; Reference Veryard and EbdonVeryard and Ebdon, 1961).
Conclusion
From these investigations it is clear that, whilst the Jan Mayen glaciers are sensitive to both temperature and precipitation changes, the latter have probably been the more important over the last 150 years. There appears to have been an upward secular trend of temperature and precipitation associated with increased cyclonic activity in the northern parts of the Norwegian Sea, especially when the late 1920’s and 1930’s are compared with any other time since at least 1850–70. However, at Jan Mayen precipitation has continued to increase since the 1930’s for reasons which cannot be completely established but are probably related to higher sea temperatures than formerly to the east and south. The percentage changes of precipitation since about 1920 are very great, and the present advance of the glaciers on Jan Mayen is probably an exceptionally near approach to an ideal case of a reversal entirely attributable to the precipitation trend.
Acknowledgement
The first two authors who were on the staff of the Meteorological Office at the time the work reported here was done wish to thank the Director-General of the Meteorological Office for facilities used and for permission to publish this article.


