


Introduction
Several studies have shown that depression is strongly related to impaired cognition (Rock, Roiser, Riedel, & Blackwell, Reference Rock, Roiser, Riedel and Blackwell2014). Around two-thirds of individuals with depression experience impaired cognitive functioning (Rock et al., Reference Rock, Roiser, Riedel and Blackwell2014), and studies in patients with clinical depression have shown that cognitive deficits persist despite remission of depressive symptoms (Koenig, Bhalla, & Butters, Reference Koenig, Bhalla and Butters2014; Köhler, Thomas, Barnett, & O'Brien, Reference Köhler, Thomas, Barnett and O'Brien2010). Several prospective cohort studies suggest that individuals with depression show accelerated cognitive decline and have a two times higher risk for Alzheimer's disease (AD) and three times higher risk for vascular dementia (Mourao, Mansur, Malloy-Diniz, Castro Costa, & Diniz, Reference Mourao, Mansur, Malloy-Diniz, Castro Costa and Diniz2016).
Underlying mechanisms that are involved in the etiology of dementia such as brain atrophy (Pini et al., Reference Pini, Pievani, Bocchetta, Altomare, Bosco, Cavedo and Frisoni2016) and cerebral small vessel disease (CSVD) (O'Brien & Thomas, Reference O'Brien and Thomas2015) have also been linked to depression. Volume reductions in total gray matter (GM) (Tudorascu et al., Reference Tudorascu, Rosano, Venkatraman, MacCloud, Harris, Yaffe and Aizenstein2014), the hippocampus (Tittmann et al., Reference Tittmann, Günther, Sacher, Himmerich, Villringer, Hegerl and Schönknecht2014), and several prefrontal regions (Tittmann et al., Reference Tittmann, Günther, Sacher, Himmerich, Villringer, Hegerl and Schönknecht2014), were reported to be associated with depression. Studies have also shown that depression is related to markers of CSVD, including white matter hyperintensities (WMH), lacunar infarcts, and cerebral microbleeds (van Agtmaal, Houben, Pouwer, Stehouwer, & Schram, Reference van Agtmaal, Houben, Pouwer, Stehouwer and Schram2017). Small clinical studies have demonstrated that these cerebral changes are related to cognitive functioning in memory, executive functions, and processing speed in patients with depression (Hickie et al., Reference Hickie, Naismith, Ward, Turner, Scott, Mitchell and Parker2005; Köhler et al., Reference Köhler, Thomas, Lloyd, Barber, Almeida and O'Brien2010; O'Brien, Lloyd, McKeith, Gholkar, & Ferrier, Reference O'Brien, Lloyd, McKeith, Gholkar and Ferrier2004; Sheline et al., Reference Sheline, Price, Vaishnavi, Mintun, Barch, Epstein and Schechtman2008). However, studies generally were small and confined to the more severely depressed spectrum such as inpatients, hence there is a lack of population-based cohort studies that generalize findings to the wider population with depression. Furthermore, most studies only corrected for a limited number of confounders (Hickie et al., Reference Hickie, Naismith, Ward, Turner, Scott, Mitchell and Parker2005; Köhler et al., Reference Köhler, Thomas, Lloyd, Barber, Almeida and O'Brien2010; O'Brien et al., Reference O'Brien, Lloyd, McKeith, Gholkar and Ferrier2004; Sheline et al., Reference Sheline, Price, Vaishnavi, Mintun, Barch, Epstein and Schechtman2008) and associations found could be spurious; studies mostly included a limited number of brain markers (Hickie et al., Reference Hickie, Naismith, Ward, Turner, Scott, Mitchell and Parker2005; O'Brien et al., Reference O'Brien, Lloyd, McKeith, Gholkar and Ferrier2004), which might have resulted in less sensitivity; and studies were often performed in elderly populations (>59 years) (Köhler et al., Reference Köhler, Thomas, Lloyd, Barber, Almeida and O'Brien2010; O'Brien et al., Reference O'Brien, Lloyd, McKeith, Gholkar and Ferrier2004; Sheline et al., Reference Sheline, Price, Vaishnavi, Mintun, Barch, Epstein and Schechtman2008), while the development of structural brain damage may already start at middle age (Jernigan et al., Reference Jernigan, Archibald, Fennema-Notestine, Gamst, Stout, Bonner and Hesselink2001).
Therefore, the aim of this study is to investigate the association between depression, brain volume (white matter (WM), GM), markers of generalized atrophy (cerebrospinal fluid (CSF) volume) and CSVD (WMH, lacunar infarcts, and cerebral microbleeds), cognitive impairment and functioning (memory, information processing speed, and executive function & attention). In addition, we assess whether markers of brain atrophy and CSVD mediate the association between depression and cognition. Previous studies that related structural brain abnormalities to depression and cognition mainly included elderly populations, and sex differences are found in both MDD (WHO, 2017) and structural brain abnormalities (Ruigrok et al., Reference Ruigrok, Salimi-Khorshidi, Lai, Baron-Cohen, Lombardo, Tait and Suckling2014). Furthermore, it has been shown that type 2 diabetes mellitus (T2DM) is associated with MDD (Roy & Lloyd, Reference Roy and Lloyd2012), cognitive functioning (Reijmer, van den Berg, Ruis, Jaap Kappelle, & Biessels, Reference Reijmer, van den Berg, Ruis, Jaap Kappelle and Biessels2010), and structural brain abnormalities (Vergoossen, Jansen, Backes, & Schram, Reference Vergoossen, Jansen, Backes and Schram2020). Because of this, we tested whether associations differed according to sex, age, and T2DM status in a cohort enriched for T2DM. We hypothesized that depression is associated with worse cognitive functioning and that these associations are partly explained by markers of brain atrophy and CSVD. In addition, we expected that the associations are similar between the individuals with and without T2DM.
Method
Study population and design
We used cross-sectional data from the Maastricht study, an observational population-based cohort study. The rationale and methodology have been described previously (Schram et al., Reference Schram, Sep, van der Kallen, Dagnelie, Koster, Schaper and Stehouwer2014). In brief, the study focuses on the etiology, pathophysiology, complications, and comorbidities of T2DM, heart disease, and other chronic conditions, and is characterized by an extensive phenotyping approach. Eligible for participation were all individuals aged between 40 and 75 years and living in the southern part of the Netherlands. Participants were recruited through mass media campaigns, the municipal registries, and the regional Diabetes Patient Registry via mailings. Recruitment was stratified according to known T2DM status, with an oversampling of individuals with T2DM, for reasons of efficiency. Fig. 1 shows the flowchart of the study population. Baseline surveys were completed between November 2010 and January 2018. From the initial 7689 participants, depression and cognitive functioning data was available in n = 7066 participants. Magnetic resonance imaging (MRI) measurements were implemented from December 2013 onwards until February 2017 and were available in 4734 participants. We performed complete case analyses in which 4734 participants were included in the key analyses and 4698 participants in the fully adjusted analyses. All participants gave written informed consent.
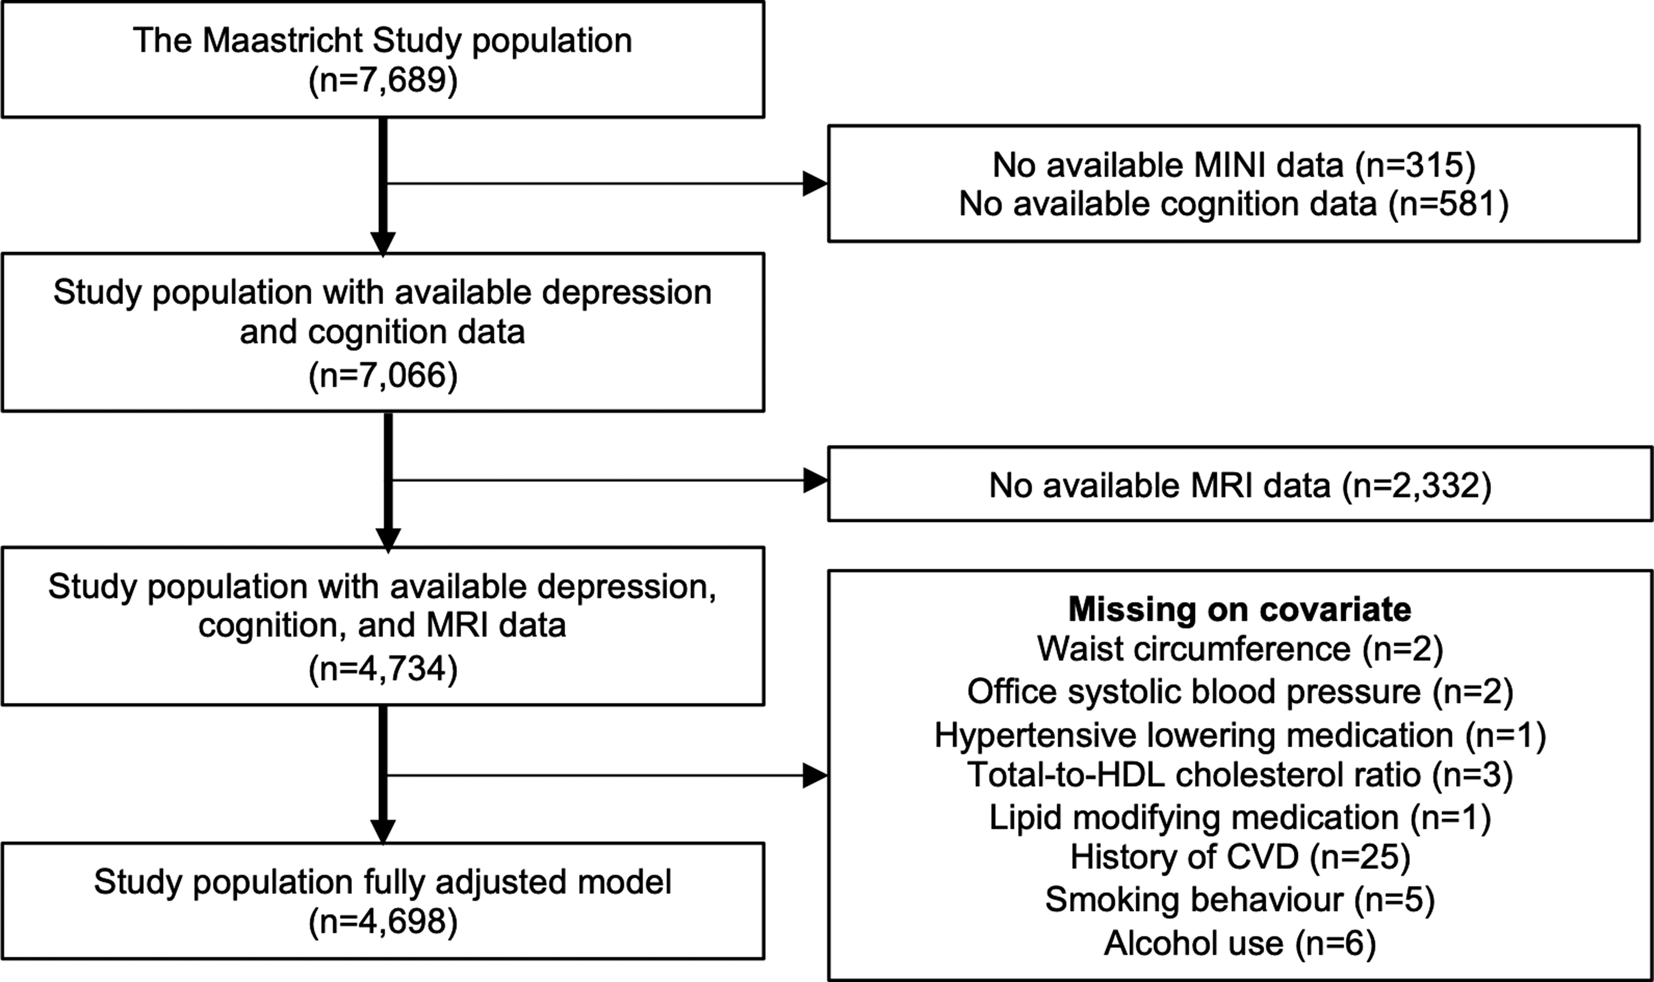
Fig. 1. Flowchart of the study population. MINI indicates Mini-International Neuropsychiatric Interview; MRI, magnetic resonance imaging; HDL, high-density lipoprotein; CVD, cardiovascular disease.
Major depressive disorder
Current and lifetime episodes of major depressive disorder (MDD) were assessed by the Mini-International Neuropsychiatric Interview (MINI) (Sheehan et al., Reference Sheehan, Lecrubier, Sheehan, Amorim, Janavs, Weiller, Dunbar and Dunbar1998). The MINI is a short diagnostic structured interview used to assess the presence of MDD in the preceding 2 weeks, in line with the DSM-IV (Diagnostic and Statistical Manual of Mental Disorders, Fourth Edition). MDD is diagnosed if participants had (1) one core symptom (i.e. depressed mood or loss of interest) and at least four other symptoms of depression (i.e. significant weight change of change in appetite, insomnia or hypersomnia, psychomotor agitation or retardation, fatigue or loss of energy, guilt or worthlessness, diminished ability to think or concentrate or indecisiveness, and suicidal thoughts or plans), or (2) two core symptoms and at least three other symptoms, for a period of more than 2 weeks. The MINI was conducted by trained staff members.
Cognitive performance
Cognitive performance was assessed by a concise (30-min) neuropsychological test battery (Schram et al., Reference Schram, Sep, van der Kallen, Dagnelie, Koster, Schaper and Stehouwer2014). For conceptual clarity, test scores were standardized and divided into three cognitive domains (memory function, information processing speed, and executive function & attention). Briefly, memory function was evaluated using the Verbal Learning Test (Van Der Elst, Van Boxtel, Van Breukelen, & Jolles, Reference Van Der Elst, Van Boxtel, Van Breukelen and Jolles2005), and a memory domain score was derived by calculating the average of total immediate and delayed recall standardized scores. An information processing speed domain score was derived from standardized scores of the Stroop Color-Word Test Parts I and II (Van der Elst, Van Boxtel, Van Breukelen, & Jolles, Reference Van der Elst, Van Boxtel, Van Breukelen and Jolles2006c), the Concept Shifting Test Parts A and B (Van der Elst, Van Boxtel, Van Breukelen, & Jolles, Reference Van der Elst, Van Boxtel, Van Breukelen and Jolles2006a), and the Letter-Digit Substitution Test (Van der Elst, van Boxtel, van Breukelen, & Jolles, Reference Van der Elst, van Boxtel, van Breukelen and Jolles2006b). The executive function & attention domain score was calculated the average of the Stroop Color-Word Test Part III and the Concept Shifting Test Part C. If necessary, individual test scores were log-transformed to reduce the skewness of distributions and/or inverted so that higher scores indicated better cognitive performance. In addition, participants were categorized as cognitively impaired (yes/no) based on a regression-based normalization procedure per test that predicted expected scores for each individual given their age, sex, and level of education from a published normative sample (Van Der Elst et al., Reference Van Der Elst, Van Boxtel, Van Breukelen and Jolles2005, Reference Van der Elst, Van Boxtel, Van Breukelen and Jolles2006a, Reference Van der Elst, van Boxtel, van Breukelen and Jollesb, Reference Van der Elst, Van Boxtel, Van Breukelen and Jollesc). The difference between observed and expected scores and their standard deviation were used to calculate z-scores, which were then averaged per domain and re-standardized. Individuals performing less than −1.5 standard deviations below their norm-based expected score in any domain were categorized as having a significant cognitive impairment (CogImp).
Brain magnetic resonance imaging
Brain MRI was performed on a 3 T MRI scanner (MAGNETOM Prismafit Syngo MR D13D; Siemens Healthcare, Erlangen, Germany) by use of a 64-element head coil for parallel imaging, as previously described (Li et al., Reference Li, Schram, Sorensen, Agtmaal, Berendschot, Webers and Houben2020). The MRI protocol consists of a 3D T1-weighted sequence (TR/TE/TI2300/2.98/900 ms, 1.00 mm cubic voxel, 176 continuous slices, matrix size of 240 × 250 and reconstructed matrix size of 512 × 512), a T2-weighted fluid-attenuated inversion recovery (TR/TE/TI 5000/394/1800 ms, 0.98 × 0.98 × 1.26 mm3 acquisition voxel and 0.49 × 0.49 × 1.00 mm3 reconstructed voxel, 176 continuous slices, acquisition matrix size of 250 × 250 and reconstructed matrix size of 512 × 512), and a gradient recalled echo pulse sequence with susceptibility-weighted imaging. The protocols for MRI acquisition and analysis are in line with current STRIVE V2 imaging standards (Wardlaw et al., Reference Wardlaw, Smith, Biessels, Cordonnier, Fazekas, Frayne and Dichgans2013).
T1 images and T2-weighted fluid-attenuated inversion recovery images were analysed by use of an ISO-13485:2012-certified, automated method (De Boer et al., Reference De Boer, Vrooman, Van Der Lijn, Vernooij, Ikram, Van Der Lugt and Niessen2009; Vrooman et al., Reference Vrooman, Cocosco, van der Lijn, Stokking, Ikram, Vernooij and Niessen2007). T1-weighted images were segmented into WM, GM, and CSF, volumes (1 voxel = 1.00 mm3 = 0.001 ml). Intracranial volume was calculated as the sum of WM (including WMH volume), GM, and CSF volume. Volumes of WM, GM, CSF, and intracranial volume were standardized.
T1 images and T2-weighted fluid-attenuated inversion recovery images were used to quantify deep, periventricular, and total WMH volume. Periventricular WMH were automatically defined as WMH <3 mm, and deep cortical WMH as WMH ⩾ 3 mm from the CSF volume. WMH volumes were log-transformed and standardized. In addition, WMH were visually rated with the Fazekas scale (Fazekas, Chawluk, Alavi, Hurtig, & Zimmerman, Reference Fazekas, Chawluk, Alavi, Hurtig and Zimmerman1987). The location and the number of lacunar infarcts are manually rated on T2 and fluid-attenuated inversion recovery images and defined as focal lesions of ⩾3 mm and <15 mm in size with a similar signal intensity as CSF on all sequences and a hyperintense rim (Wardlaw et al., Reference Wardlaw, Smith, Biessels, Cordonnier, Fazekas, Frayne and Dichgans2013). The location and the number of cerebral microbleeds are manually rated on 3D T2* gradient recalled echo-weighted imaging with susceptibility-weighted imaging by use of the Microbleed Anatomical Rating Scale (Gregoire et al., Reference Gregoire, Chaudhary, Brown, Yousry, Kallis, Jager and Werring2009) and defined as focal lesions of ⩾2 mm and ⩽10 mm in size with a hypointense signal on T2* gradient recalled echo and susceptibility-weighted images (Wardlaw et al., Reference Wardlaw, Smith, Biessels, Cordonnier, Fazekas, Frayne and Dichgans2013). Lacunar infarcts and cerebral microbleeds were rated manually by three neuroradiologists. The intraclass correlation coefficient for the three raters based on 50 randomly selected scans was 0.84 (0.74; 0.91) and 0.83 (0.72; 0.90) for the presence of lacunar infarcts and cerebral microbleeds, respectively. Presence of CSVD was defined as (1) presence of lacunar infarct, (2) presence of cerebral microbleeds, and/or (3) Fazekas score ⩾2.
Because MRI assessment did not always take place at the same time as the baseline assessment for logistic reasons, we adjusted for MRI lag time, i.e. the time between baseline assessment and MRI assessment.
General characteristics and covariates
General characteristics and covariates were measured as described elsewhere (Schram et al., Reference Schram, Sep, van der Kallen, Dagnelie, Koster, Schaper and Stehouwer2014). Educational level (low, intermediate, high), partner status (partner/no partner), history of cardiovascular diseases (CVD), smoking status (never, current, former), alcohol consumption (none, low, high), physical activity, and Mediterranean diet score were assessed by questionnaires (Schram et al., Reference Schram, Sep, van der Kallen, Dagnelie, Koster, Schaper and Stehouwer2014). We measured height, weight, waist circumference, blood pressure (measured in office and via ambulatory 24-h blood pressure monitoring at home (WatchBP03; Microlife AG, Widnau, Switzerland)), serum creatinine, 24-h urinary albumin excretion (twice), and plasma lipid profile as described elsewhere (Schram et al., Reference Schram, Sep, van der Kallen, Dagnelie, Koster, Schaper and Stehouwer2014). Estimated glomerular filtration rate (eGFR; in ml/min/1.73 m2) was calculated with the Chronic Kidney Disease Epidemiology Collaboration equation based on both serum creatinine and serum cystatin C (Martens et al., Reference Martens, Henry, Houben, van der Kallen, Kroon, Schalkwijk and Stehouwer2016). Medication use was assessed in a medication interview where the generic name, dose, and frequency were registered. To determine T2DM status, all participants (except those who used insulin) underwent an oral glucose tolerance test (OGTT) after an overnight fast as previously described (Schram et al., Reference Schram, Sep, van der Kallen, Dagnelie, Koster, Schaper and Stehouwer2014). T2DM was defined according to the World Health Organization (2006) criteria (fasting blood glucose ⩾7.0 mmol/l or a 2-h post-load blood glucose ⩾11.1 mmol/l or used oral glucose-lowering medication or insulin) (WHO, 2006).
Statistical analyses
All statistical analyses were performed by use of the Statistical Package for Social Sciences (version 25.0; IBM, Chicago, IL, USA), Stata (version 13; StataCorp LLC, College Station, TX, USA), and Mplus (version 8.4; Muthén & Muthén, Los Angeles, CA, USA). To assess associations of MDD with cognitive functioning and MRI markers, we used multiple linear and logistic regression analyses reporting the unstandardized regression coefficient B and the odds ratio (OR), respectively, with their 95% confidence interval (CI). The associations were adjusted for potential confounders: model 1 included MDD (for cognitive outcome measures) or MDD + MRI time lag (for categorical MRI outcome measures) or MDD + MRI time lag + intracranial volume (for MRI volume-outcome measures); model 2 additionally adjusted for age, sex and educational level; model 3 additionally adjusted for T2DM (because of oversampling); model 4 additionally adjusted for waist circumference, office systolic blood pressure, hypertensive medication, total-to-high-density lipoprotein cholesterol ratio, lipid-modifying medication, and history of CVD, and model 5 additionally adjusted for smoking behavior and alcohol use. Model 3 was considered the main model. Models 4 and 5 were tested separately as covariates might well be on the causal pathway with potential overcorrection (Schisterman, Cole, & Platt, Reference Schisterman, Cole and Platt2009). We also tested the interactions of MDD with age, sex, and T2DM on cognitive functioning and the brain markers. These interactions were first tested in main model 3, and later in models 4 and 5 that may include variables that are on the causal pathway. To test for mediation of the association between depression and cognition by brain markers, structural equation modeling was used to decompose total effects of depression into direct and indirect effects using maximum likelihood estimation for continuous and mean and variance corrected weighted least squares robust estimation for categorical dependent variables. Also, these analyses were performed in main model 3, as models 4 and 5 may include variables that might be on the causal pathway. A two-sided p value <0.05 was considered statistically significant.
Results
General characteristics of the study population
Table 1 shows the general characteristics of the study population (n = 4734), stratified for MDD status. Participants had a mean age of 59.1 ± 8.6 years and 50.2% were women. Participants with MDD were less educated and had a worse cardiometabolic risk profile compared to participants without MDD. Participants without MINI and cognition data (n = 623) were significantly older, were more often men, had a lower level of education, a worse cardiometabolic risk profile, more often T2DM, lower cognitive functioning scores, smaller brain volumes, and larger volumes of WMH than participants with MINI and cognition data. Participants without MRI data (n = 2332) were significantly older, had a lower level of education, a worse cardiometabolic risk profile, more often T2DM, a higher depressive symptoms score, and lower cognitive functioning scores as compared to participants with MRI data (data not shown).
Table 1. General characteristics study population according to depression status

Data are presented as means ± standard deviation (s.d.), number (%) or median [interquartile range], and evaluated using independent t tests, Mann–Whitney U tests or χ2 tests. PHQ-9 indicates 9 item Patient Health Questionnaire; BP, blood pressure; HDL, high-density lipoprotein; eGFR, estimated glomerular filtration rate; CVD, cardiovascular disease; CSVD, cerebral small vessel disease; HbA1c, glycated hemoglobin A1c; WMH, white matter hyperintensities.
Association between MDD and cognitive functioning
Table 2 shows the association between MDD and cognitive functioning. MDD was associated with higher odds of CogImp [OR = 1.60(1.06;2.40)] after full adjustment for demographic, cardiovascular, and lifestyle risk factors (model 5). Furthermore, MDD was associated with lower scores in information processing speed [B = −0.18(−0.28;−0.08)] and executive functioning & attention [B = −0.13(−0.25;−0.02)], but not with memory [B = −0.02(−0.15;0.11)] in model 5. We did not find interactions of MDD with age, sex, or T2DM on CogImp or cognitive domain scores (online Supplementary Table 1 S1).
Table 2. Associations of major depressive disorder with different domains of cognitive functioning
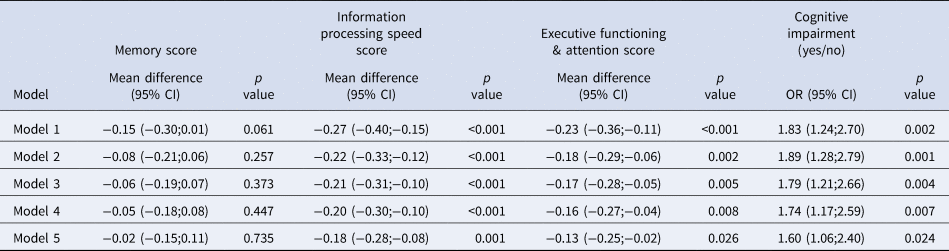
n = 4734. Major depressive disorder cases n = 151. Regression results are presented as mean difference or odds ratio (OR) with 95% confidence intervals (95% CI). CI indicates confidence interval; OR, odds ratio.
Model 1: crude.
Model 2: adjusted for age, sex, and educational level.
Model 3: additionally adjusted for type 2 diabetes mellitus.
Model 4: additionally adjusted for waist circumference, office systolic blood pressure, hypertensive medication, total/high-density cholesterol ratio, lipid-modifying medication, and history of cardiovascular disease (n = 4701).
Model 5: additionally adjusted for smoking behavior and alcohol use (n = 4698).
Association between MDD and markers of brain atrophy and CSVD
Table 3 shows the associations between MDD and markers of brain atrophy and CSVD. MDD was not associated with WM volume [B = 0.00(−0.08;0.07)], GM volume [B = −0.01(−0.09;0.06)], or CSF volume [B = 0.02(−0.08;0.12)], after adjustment for demographic risk factors (model 2). MDD was associated with larger WMH volume [B = 0.16(0.02 to 0.30)] after adjustment for demographic risk factors (model 2), but not after additional adjustment for T2DM in model 3 [B = 0.14(0.00;0.28)]. However, the association between MDD and periventricular WMH volume remained significant after additional adjustment for T2DM in model 3 [B = 0.15(0.01;0.29)], and became non-significant after additional adjustment for potentially mediating cardiovascular risk factors in model 4 [B = 0.14(0.00;0.28)]. MDD was not associated with deep cortical WMH volume [B = 0.11(−0.03;0.26)] or presence of CSVD [OR = 1.32(0.91;1.91)] after adjustment for demographic risk factors in model 2.
Table 3. Associations of major depressive disorder with markers of brain atrophy and cerebral small vessel disease
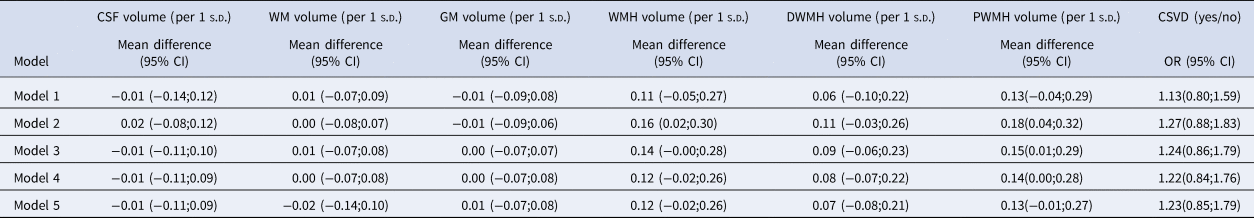
n = 4734. Major depressive disorder cases n = 151. Regression results are presented as mean difference or odds ratio (OR) with 95% confidence intervals (95% CI). CSF indicates cerebrospinal fluid; WM, white matter; GM, gray matter; s.d., standard deviation; WMH, white matter hyperintensity; DWMH, deep cortical white matter hyperintensities; PWMH, periventricular white matter hyperintensities; CSVD, cerebral small vessel disease.
Model 1: adjusted for intracranial volume (except CSVD composite score) and MRI lag time.
Model 2: additionally adjusted for age, sex, and educational level.
Model 3: additionally adjusted for type 2 diabetes mellitus.
Model 4: additionally adjusted for waist circumference, office systolic blood pressure, hypertensive medication, total/high-density cholesterol ratio, lipid-modifying medication, and history of cardiovascular disease (n = 4701).
Model 5: additionally adjusted for smoking behavior and alcohol use (n = 4698).
Next, we tested whether the above associations differ by age, sex and T2DM in model 3 (online Supplementary Table S2). We found an interaction of MDD with age for WM volume in model 3 (p = 0.029), suggesting MDD is associated with a larger WM volume in older participants only. The interaction attenuated and became non-significant in model 4 (p = 0.082), which could be attributed to differences in blood pressure between young and old individuals with MDD. Next, an interaction of MDD with age for GM existed in model 3 (p = 0.013) which remained statistically significant in model 5 (p = 0.023). Results of stratified analyses were suggestive for an association between MDD and lower GM volume in older participants [⩾65 years, model 3: B = −0.12(−0.29;0.06)], while no association was observed in younger participants [<65 years, model 3: B = 0.03(−0.05;0.10)]. However, results in the older age group were statistically non-significant. Finally, we found an interaction of MDD with T2DM on CSVD score in model 3 (p = 0.026) which remained statistically significant in the fully adjusted model 5 (p = 0.023). Stratified analyses of model 5 showed that MDD was associated with the presence of CSVD in participants without T2DM [OR = 1.65(1.06;2.56)], but not in participants with T2DM [OR = 0.68(0.34;1.38)]. In the former, MDD was also significantly associated with WHM volume [B = 0.17(0.01;0.34)] and periventricular WMH volume [B = 0.18(0.01;0.35)] in model 3, but not after adjustment for cardiovascular and lifestyle factors.
Mediation analyses of the association between MDD, CSVD, and cognition
In the above results, we only found an association between MDD and markers of CSVD in the subpopulation without T2DM. Therefore, only mediation analyses in the subpopulation without T2DM are shown in Table 4. Mediation analyses of the total study population are shown in online Supplementary Table S4. There was a modest indirect effect for periventricular WMH [model 2: B = −0.02(−0.03;−0.00)] on memory, in which 20% of the total effect of MDD on memory score could be attributed to its relation with periventricular WMH. Since the total effect itself was not significant itself, this is a marginal association. There were no mediation effects for other cognitive outcomes (Table 4).
Table 4. Decomposed associations of major depressive disorder with different domains of cognitive functioning in the subpopulation without type 2 diabetes
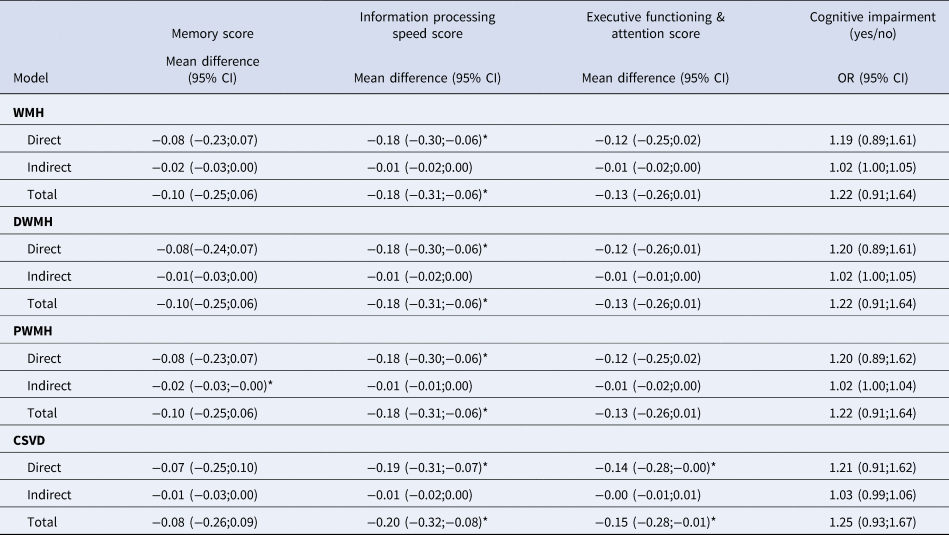
Regression results are decomposed in direct, indirect and total effects and presented as mean difference or odds ratio (OR) with 95% confidence intervals (95% CI). CI indicates confidence interval; OR, odds ratio; MDD, major depressive; WMH, white matter hyperintensities; DWMH, deep cortical white matter hyperintensities; PWMH, periventricular white matter hyperintensities; CSVD, cerebral small vessel disease. Model 2 is adjusted for adjusted for intracranial volume (except CSVD composite score), MRI lag time, age, sex, educational level. n = 3821, MDD cases n = 102. *p < 0.05 (two-sided).
Additional analyses
Results of additional analyses are shown in online Supplementary Tables S5–7. Since more participants had data on cognitive functioning than on MRI, we inspected potential selection bias by including only those with available MRI. Overall, associations between MDD and cognitive functioning were attenuated in the sample with available MRI compared to the full sample analyses (online Supplementary Table S5). Next, we performed several sensitivity analyses. First, to reduce potential misclassification of depression, we (1) additionally adjusted for anti-depressant medication, (2) exclude participants who used anti-depressant medication from the control group, (3) exclude participants with moderate to high depressive symptoms (PHQ-9 score ⩾10) from the control group, and (4) exclude participants without MDD at baseline who did report a lifetime diagnosis of MDD from the control group. Second, we additionally adjusted for physical activity, Mediterranean diet score, and eGFR, which were missing in more participants and therefore not included in the main analyses. Third, we replaced office systolic blood pressure for 24 h systolic blood pressure, waist circumference for BMI, and total-to-HDL cholesterol ratio for triglycerides. All these adjustments did not materially change our results (online Supplementary Table S6). Previous studies that investigated structural brain abnormalities often focused on late-life depression above the age of 60 years (Blazer, Reference Blazer2003). To investigate whether associations between MDD and markers of brain atrophy and CSVD become stronger with age, we tested these associations in several age categories (online Supplementary Table S7). This showed that associations between MDD and markers of brain atrophy and CSVD indeed became stronger with increasing age.
Discussion
In this population-based imaging study, MDD was associated with higher odds of cognitive impairment, and more impaired performance in information processing speed and executive functioning & attention, but not memory. These associations were independent of demographic, cardiovascular, and lifestyle-related risk factors, and were similar in women and men, and in participants with and without T2DM. Contrary to our expectations, MDD was not associated with markers of brain atrophy or CSVD in the total study population. However, MDD was associated with CSVD in participants without T2DM, but this relation could not explain the associations between MDD and cognitive functioning.
Our finding that MDD is associated with generalized cognitive impairment corroborates previous evidence of a relation between depression and cognitive deficits (Rock et al., Reference Rock, Roiser, Riedel and Blackwell2014), and are in line with studies that show that these cognitive deficits are often persistent (Köhler et al., Reference Köhler, Thomas, Lloyd, Barber, Almeida and O'Brien2010) and can increase over time (Mourao et al., Reference Mourao, Mansur, Malloy-Diniz, Castro Costa and Diniz2016). Cognitive impairment persists in 45% of patients even after remission of MDD (Thomas & O'Brien, Reference Thomas and O'Brien2008).
We found participants with MDD and no T2DM had more evidence for CSVD, which mirrors previous findings (van Agtmaal et al., Reference van Agtmaal, Houben, Pouwer, Stehouwer and Schram2017). The association between MDD and total WMH volume was statistically non-significant, while the association between MDD and periventricular WMH volume was statistically significant, after adjustment for demographic risk factors and T2DM. However, the difference in the strength of the association between MDD with respectively total WMH volume and periventricular WMH volume is <7%. In addition, the CIs of these associations are almost identical. The non-significant association with total WMH can be explained by the absence of an association between MDD and deep cortical WMH volume in our study population, which diluted the association between MDD and total WMH volume. Although some studies differentiate between periventricular and deep cortical WMH volume, results of a meta-analysis suggested that this categorical distinction may be arbitrary (DeCarli, Fletcher, Ramey, Harvey, & Jagust, Reference DeCarli, Fletcher, Ramey, Harvey and Jagust2005).
Others also found an association between depression and brain atrophy (Tudorascu et al., Reference Tudorascu, Rosano, Venkatraman, MacCloud, Harris, Yaffe and Aizenstein2014), but studies into whole-brain GM volume have shown mixed results (Tittmann et al., Reference Tittmann, Günther, Sacher, Himmerich, Villringer, Hegerl and Schönknecht2014). More consistent evidence has been found for volume reductions in specific brain areas such as the hippocampus, prefrontal cortex, insula, putamen, amygdala, and anterior cingulate-, prefrontal, and temporal cortex (Tittmann et al., Reference Tittmann, Günther, Sacher, Himmerich, Villringer, Hegerl and Schönknecht2014). Moreover, it has been shown that the effect of depression on frontal and temporal GM volume reductions increases with age (Dotson, Davatzikos, Kraut, & Resnick, Reference Dotson, Davatzikos, Kraut and Resnick2009), for which we found tentative support as the interaction between MDD and age on GM suggested that MDD is more strongly related to lower GM volumes in older age (Tudorascu et al., Reference Tudorascu, Rosano, Venkatraman, MacCloud, Harris, Yaffe and Aizenstein2014). The reduced statistical power in the stratified analyses can explain the non-significant association between MDD and lower GM volume in the older subgroup. It may be that our study population was still too young (mean age 59.1 ± 8.6 years) with limited variation in brain volumes to find an association between MDD and markers of brain atrophy, and consequently, a mediation of brain atrophy on the association between MDD and cognitive impairment as brain volume loss might have been subtle. Our finding that MDD is stronger associated with information processing speed and executive functioning & attention as compared to memory is more in line with an underlying vascular mechanism than a neurodegenerative mechanism involving the hippocampus (Koenig et al., Reference Koenig, Bhalla and Butters2014).
As said, depressed participants without T2DM more often had signs of CSVD. In addition, total WMH and periventricular WHM load were higher. This was partly explained by their worse general vascular health profile since associations with WMH and periventricular WMH became non-significant after adjustment for cardiovascular factors. Previous studies that adjusted for factors such as hypertension also reported modest associations (van Agtmaal et al., Reference van Agtmaal, Houben, Pouwer, Stehouwer and Schram2017). The relatively young age and the general absence of large confluent WHM (Fazekas score ⩾3, n = 37) in our sample may explain the subtler associations. The use of the categorical CSVD variable might have allowed a sharper contrast between those with high and low CSVD burden. As a consequence, associations between MDD and CSVD were comparable with a recent meta-analysis on the presence of significant WMH in MDD (van Agtmaal et al., Reference van Agtmaal, Houben, Pouwer, Stehouwer and Schram2017).
Despite the above associations, neither CSVD nor markers of brain atrophy explained the worse cognitive profile of individuals with MDD in the total sample or among those without T2DM. It is possible that markers of CSVD and cognitive impairment are only related within a subgroup of depression (so-called vascular depression) (Sneed, Rindskopf, Steffens, Krishnan, & Roose, Reference Sneed, Rindskopf, Steffens, Krishnan and Roose2008), but such associations might be diluted at the population-average level. Contrary to our expectation, we did not observe an association between MDD and markers of brain atrophy or CSVD in individuals with T2DM. This might be because vascular burden in T2DM is already high. Although it has been shown that comorbid depression in T2DM is related to the development of macro- and micro-vascular complications (Nouwen et al., Reference Nouwen, Adriaanse, van Dam, Iversen, Viechtbauer, Peyrot and de Groot2019), the presence of MDD might add little to the variation in the observed association with CSVD (van Agtmaal et al., Reference van Agtmaal, Houben, de Wit, Henry, Schaper, Dagnelie and Kroon2018).
Several mechanisms have been suggested to explain the higher risk of cognitive impairment in individuals with MDD. This includes neurobiological effects of depression such as chronically increased cortisol levels and glutamatergic neurotoxicity (Odaka, Adachi, & Numakawa, Reference Odaka, Adachi and Numakawa2017), and decreased in heartrate variability and an increase in platelet activation and pro-inflammatory factors (Carney, Freedland, & Veith, Reference Carney, Freedland and Veith2005). On the other hand, brain atrophy or ischemic damage in affect regulating centers (fronto-subcortical loop) might be a common etiological factor for both MDD and cognitive impairment. In that case, brain markers could be seen as a classical confounder for the association between MDD and cognitive impairment, though reported direct effects of MDD on cognition remained significant in models including the MRI markers. Next, lower GM volumes might be a marker of impending dementia (Thompson et al., Reference Thompson, Hayashi, de Zubicaray, Janke, Rose, Semple and Toga2003) and the association be due to reverse causation. The stronger association in older age groups between MDD and GM seems in line with this, though we would have expected to find associations with intracranial CSF volumes, as a proxy of generalized brain atrophy, in particular. Finally, cognitive impairments might be a state effect of a current depressive episode. Yet, several studies suggest impairments are highly persistent or worsening in depression (Thomas & O'Brien, Reference Thomas and O'Brien2008). Importantly, the above explanations are not mutually exclusive and different pathways might act in different individuals with accumulation and interaction of their effects.
Strengths of our study include its large sample size and population-based design; the oversampling of individuals with T2DM which provides insights of the investigated associations in this population with a high burden of depression (Holt, De Groot, & Golden, Reference Holt, De Groot and Golden2014), cognitive impairment and brain changes; the comparable prevalence rate of depression to other population-based studies; the use of the MINI diagnostic interview to assess MDD; the extensive assessment cognitive functioning by means of a comprehensive neuropsychological test battery with available norm scores to define cognitive impairment; inclusion of a broad range of potential confounders; and the performance of several sensitivity analyses to test the robustness of findings.
This study also has some limitations. First, the data were cross-sectional. Therefore, we cannot exclude reverse causality. Second, the study population was relatively young, with an upper age range of 75 years, and despite the oversampling of T2DM relatively healthy, which may have led to an underestimation of the associations with brain atrophy and CSVD. These effects appear to be more pronounced in older adults, as most studies who found these effects included participants above the age of 65 years. In addition, functional MRI research has linked MDD to abnormal functioning of cognition-related brain networks in individuals with an MDD onset below the age of 50 years (Rayner, Jackson, & Wilson, Reference Rayner, Jackson and Wilson2016). Research into more subtle markers of brain changes, like brain connectivity or functional measures, is therefore recommended for younger populations. Third, we adjusted for a range of potential confounders, but due to the cross-sectional assessment, we could not differentiate between cause and effect. Cardiovascular and lifestyle factors might very well be on the causal pathway from depression to brain changes, especially CSVD. This overadjustment might explain the loss of significant associations in models 4 and 5 in the analyses with WMH and periventricular WMH, and therefore we kept these factors in separate models (Schisterman et al., Reference Schisterman, Cole and Platt2009). Fourth, we performed multiple analyses in which we did not correct for multiple testing. Correction for multiple testing reduces the chance of type 1 error at the cost of increasing the risk for type 2 error. The markers for brain atrophy, CSVD, and cognitive impairment are correlated and based on the same shared risk factors and disease mechanisms. Furthermore, the magnitude of the associations is consistent and associations are directionally similar. Therefore, it is unlikely that our findings are a result of mere chance, against which multiple testing would safeguard. Fifth, we did not find an association between MDD and memory in our study sample with available MRI data, but the fact this association was present in the larger study sample including participants without MRI data suggests that depressed participants with MDD and poor memory were less likely to undergo MRI, leading to selection bias. This likely also applies to other population-imaging studies (Honningsvåg, Linde, Håberg, Stovner, & Hagen, Reference Honningsvåg, Linde, Håberg, Stovner and Hagen2012). Finally, we did not study segmented brain areas to assess region-specific differences such as hippocampal or prefrontal lobar volumes. Most evidence for brain atrophy in depression is found in focal volume loss rather than generalized volume loss (Sheline, Reference Sheline2000).
In a large cohort of community-dwelling participants aged between 40 and 75 years, MDD was associated with overall cognitive impairment and more impaired information processing speed and executive functioning & attention. MDD was further associated with CSVD in participants without T2DM, but this relation was insufficient to explain the associations between MDD and cognitive functioning. Longitudinal studies are needed to establish the mediation of structural brain damage in the development of cognitive impairment and dementia in MDD.
Supplementary material
The supplementary material for this article can be found at https://doi.org/10.1017/S0033291721000222.
Acknowledgements
The researchers are indebted to the participants for their willingness to participate in the study.
Financial support
This study was supported by the European Regional Development Fund via OP-Zuid, the Province of Limburg, the Dutch Ministry of Economic Affairs (grant 31O.041), Stichting De Weijerhorst (Maastricht, the Netherlands), the Pearl String Initiative Diabetes (Amsterdam, the Netherlands), the Cardiovascular Center (CVC, Maastricht, the Netherlands), CARIM School for Cardiovascular Diseases (Maastricht, the Netherlands), CAPHRI Care and Public Health Research Institute (Maastricht, the Netherlands), NUTRIM School for Nutrition and Translational Research in Metabolism (Maastricht, the Netherlands), Stichting Annadal (Maastricht, the Netherlands), Health Foundation Limburg (Maastricht, the Netherlands), and Perimed (Järfalla, Sweden), and unrestricted grants from Janssen-Cilag B.V. (Tilburg, the Netherlands), Novo Nordisk Farma B.V. (Alphen aan den Rijn, the Netherlands), and Sanofi Netherlands B.V. (Gouda, the Netherlands).
Conflict of interest
None.
Ethical standards
The authors assert that all procedures contributing to this work comply with the ethical standards of the relevant national and institutional committees on human experimentation and with the Helsinki Declaration of 1975, as revised in 2008. All procedures involving human subjects were approved by the institutional Medical Ethical Committee (NL31329.068.10) and the Minister of Health, Welfare, and Sports of the Netherlands (Permit 131088-105234-PG).


 Open access