


1. Introduction
Studies of flow past circular cylinders extend from a uniform cylinder to many more complex geometries. A step cylinder is two cylinders with different diameters arranged coaxially with a step between them. The focus of the studies of flow past step cylinders has been the difference between the wake on different parts of the cylinder. Lewis & Gharib (Reference Lewis and Gharib1992) conducted experiments of flow past a step cylinder at Reynolds numbers between 35 and 200 and reported two wake modes: the direct mode at D/d < 1.25 and indirect mode at D/d > 1.55, where D and d are the diameters of the larger and smaller cylinders, respectively. In the direct mode, two distinct shedding frequencies exist in the wake and they interact directly with each other in the interaction region. In the indirect mode, a third vortex shedding frequency lower than the other two shedding frequencies exists in the larger diameter wake. Vallès, Andersson & Jenssen (Reference Vallès, Andersson and Jenssen2002) conducted numerical simulations and presented flow visualization of the vortex linkage and half-loop formation of the direct mode that were observed in experiments. Dunn & Tavoularis (Reference Dunn and Tavoularis2006) conducted further experimental study of flow past a step cylinder at a diameter ratio of d/D = 0.51 and found that the wake was divided into three cells: the L-cell, S-cell and N-cell. Local frequency analysis confirmed that the dominant frequency in the cell boundary regions varied with time. The N-cell is essentially the modulation zone defined by Lewis & Gharib (Reference Lewis and Gharib1992) and the interaction region defined by Morton, Yarusevych & Carvajal-Mariscal (Reference Morton, Yarusevych and Carvajal-Mariscal2009) and Morton et al. (Reference Morton, Yarusevych and Carvajal-Mariscal2009). Morton & Yarusevych (Reference Morton and Yarusevych2014) confirmed that the three cells have constant vortex shedding frequencies for a Reynolds number of 1050 and d/D = 0.5. To some extent, the classification of the cells in the wake is similar to the classification of the wake of a tapered cylinder into many cells with different shedding frequencies (Narasimhamurthy, Andersson & Pettersen Reference Narasimhamurthy, Andersson and Pettersen2009) but with fewer cell numbers. When the step cylinder is placed in a spanwise sheared flow, the length of the N-cell and the vortex shedding frequencies of the cells are affected by the degree of the shearing of the flow (Dunn & Tavoularis Reference Dunn and Tavoularis2011).
Many numerical simulations of flow past step cylinders have also been conducted mainly in the indirect mode because it has more complex flow features than direct mode. Morton & Yarusevych (Reference Morton and Yarusevych2010) conducted numerical simulations at Re = 150 and 300 and d/D = 0.5 to investigate the L-, S- and N-cells. The Reynolds number is defined as  $Re=UD/v$. They found the fluctuations in the downwash velocity was linked to the beat frequency in the N-cell. Furthermore, they found that each N-cell vortex forms at least two filaments that are connected to a S-cell vortex and a subsequent N-cell vortex. The downwash was found to cause the reduction of vortex shedding frequency in the earlier experimental study by Yagita, Kojima & Matsuzaki (Reference Yagita, Kojima and Matsuzaki1984).
Studies on step cylinders have been extended to dual steps recently. Morton & Yarusevych (Reference Morton and Yarusevych2012) conducted experiments of flow past a dual step cylinder (larger diameter at the centre part) at Re = 1050 and d/D = 0.5 and identified four wake regimes depending on the larger cylinder length. Morton, Yarusevych & Scarano (Reference Morton, Yarusevych and Scarano2016) further conducted a particle image velocimetry investigation to visualize the wake pattern of the four wake regimes. Ji et al. (Reference Ji, Yang, Yu, Cui and Srinil2020) conducted numerical simulations of flow past a dual step cylinder with fixed cylinder lengths and reported three vortex shedding modes by varying the diameter ratios. Ji et al. (Reference Ji, Cui, Xu, Yang and Srinil2019) conducted numerical simulations of vortex induced vibration of a dual step cylinder and found the vibration amplitude was reduced compared with a uniform cylinder. In addition, a new wake pattern entitled the ‘out-of-phase vortex shedding’ was found downstream of the smaller cylinder at D/d = 2.
If a uniform cylinder is rotating in a fluid flow with a rotation rate α, defined as the ratio of the rotation speed of the cylinder surface to the free-stream velocity, the vortex street in the wake of the cylinder is similar to a von Kármán vortex street the wake at low rotation rates (α < 2), (Stojković, Breuer & Durst Reference Stojković, Breuer and Durst2002; Pralits, Brandt & Giannetti Reference Pralits, Brandt and Giannetti2010). The vortex shedding in the wake of a rotating cylinder is fully suppressed if the rotation rate is greater than a critical value, which is dependent on the Reynolds number (Badr et al. Reference Badr, Coutanceau, Dennis and Ménard1990; Chew, Cheng & Luo Reference Chew, Cheng and Luo1995; Chou Reference Chou2000). The critical rotation rates for the vortex shedding suppression for Re = 60, 100 and 160 are 1.4, 1.8 and 1.9, respectively (Kang, Choi & Lee Reference Kang, Choi and Lee1999). El Akoury et al. (Reference El Akoury, Braza, Perrin, Harran and Hoarau2008) and Rao et al. (Reference Rao, Thompson, Leweke and Hourigan2013) found that the three-dimensional wake of a rotating cylinder at large rotating rates is significantly different from that of non-rotating cylinder. The three-dimensional study of flow past a rotating cylinder at high rotation rates has a wake with ring-shaped and finger-shaped vortices (Mittal Reference Mittal2004; Munir et al. Reference Munir, Zhao, Wu and Lu2019).
When a step cylinder rotates in a flow, the wake must have combined features of a non-rotating step cylinder and a rotating uniform cylinder. Studies of the effect of the combination of step and rotation on the flow past a cylinder are very limited. Shin (Reference Shin2019) conducted numerical simulations of flow around a rotating step cylinder with d/D = 0.5 at Re = 16 129 and 32 258, and α = 0.5 and 1 (based on the larger cylinder) using the Reynolds-averaged Navier–Stokes equations. It was found that that vortex creation and interaction is affected by the larger cylinder more than the smaller cylinder. In this paper, uniform flow past a rotating step cylinder is studied through three-dimensional direct numerical simulations at Re = 150, d/D = 0.5 and α = 0, 0.5, 1, 2, 3 and 4. Both the Reynolds number and the rotation rate are defined based on the larger cylinder diameter. A small Reynolds number in the laminar flow regime is chosen in order to clearly identify the flow features caused by rotation and step without the effects from turbulence. The diameter ratio of d/D = 0.5 in the indirect mode regime has been used in many studies of the non-rotating cylinder considering it has more complex flow features. With the increase of the rotation rate, the wake goes through three stages: vortex shedding from both cylinder, suppression of vortex shedding from the larger cylinder and suppression of vortex shedding from both cylinders. This paper discusses significantly different wake flow features in these three stages and their effect on the forces on the cylinder.
2. Numerical method
Figure 1 shows a sketch of flow past a rotating step cylinder along its axis with an angular velocity σ. The length and diameter of the larger cylinder are L and D, respectively, and those for smaller cylinder are l and d, respectively. The Reynolds number is defined as Re = UD/ν, where U and ν are the free-stream velocity and kinematic viscosity of the fluid, respectively, and the rotation rate is defined as  $\alpha = 0.5\sigma D/U$. A coordinate system Oxyz is defined with its origin located at the centre of the step, x in the flow direction and z in the spanwise direction. A 60D long, 40D wide and L + l high computational domain is used for the numerical simulations.

Figure 1. Computational domain for flow past a rotating step cylinder with an angular speed σ.
The flow is simulated by solving the non-dimensional three-dimensional Navier–Stokes (NS) equations for incompressible flow
 \begin{gather}\frac{{\partial {u_i}}}{{\partial {x_i}}} = 0,\end{gather}
 \begin{gather}\frac{{\partial {u_i}}}{{\partial t}} + {u_j}\frac{{\partial {u_i}}}{{\partial {x_j}}} ={-} \frac{{\partial p}}{{\partial {x_i}}} + \frac{1}{{Re}}\frac{{{\partial ^2}{u_i}}}{{\partial x_j^2}},\end{gather}
where x 1, x 2 and x 3 represent non-dimensional x-, y- and z-coordinates, respectively, ui is the non-dimensional velocity in the xi-direction and p and t are the non-dimensional pressure and time, respectively. The coordinates, time, velocity and pressure are non-dimensionalized by the larger cylinder diameter and free-stream velocity as:  ${x_i} = {\hat{x}_i}/D$, $t = U\hat{t}/D$, ${u_i} = {\hat{u}_i}/U$ and $p = \hat{p}/(\rho {U^2})$, respectively, where a hat on a variable stands for the dimensional value, and ρ is the density of the fluid. Throughout the paper, all the variables are non-dimensional unless specified otherwise.
At the inlet boundary, the non-dimensional velocity in the x-direction is given as 1. On the outlet boundary, the pressure is zero and the gradient of the velocity in the x-direction is zero. On the surface of the cylinder, a no-slip boundary condition is used, i.e. the flow velocity is same as the velocity of the motion of the cylinder surface. The free-slip boundary condition is employed at the top, bottom and the two side boundaries.
The NS equations are solved by the Petrov–Galerkin finite element method and the computer code developed by Zhao, Cheng & Zhou (Reference Zhao, Cheng and Zhou2009). The computational domain is divided into approximately 14 million and 28 million 8-node linear hexahedral finite elements for L/D = 30 and 100, respectively. Figure 2 shows the computational mesh near the cylinder surface. On the larger and smaller cylinders, the mesh is refined using 40 inflation layers with a growth rate of 1.05. The first layer thickness of the mesh on the cylinder surface is 0.0025. On the edge of the step, the mesh size is 0.0025 both in the radius and spanwise directions. There are 120 finite elements along the circumferential direction of both larger and smaller cylinders. Tian et al. (Reference Tian, Jiang, Pettersen and Andersson2020b), whose numerical model has the same order of accuracy in space as the present model, proved that a mesh size of 0.015 is sufficiently dense for converged results at Re = 150 and d/D = 0.5. The first layer mesh size is much smaller than that used by Tian et al. (Reference Tian, Jiang, Pettersen and Andersson2020b) considering the high rotation rates to be simulated. This smallest mesh size of 0.0025 was found to be sufficiently small for flow past a rotating cylinder at Re = 500 and α = 6 (Munir et al. Reference Munir, Zhao, Wu, Lu and Ning2018). The wall unit of the first layer mesh is defined based on the distance from the wall as  ${y^ + } = {u_t}{\varDelta _1}/\nu $, where ${\varDelta _1}$ is the first layer mesh thickness. The maximum y + on the whole surface of the cylinder is found to be approximately 1 for the largest rotation rate of 4.

Figure 2. Computational mesh near the step. (a) Three-dimensional view of the cylinder surface near the step; (b) two-dimensional view on z = −2 plane on the larger cylinder side.
3. Validation and mesh dependency study
Since the numerical model was developed and validated for the study of uniform and sheared flow past a circular cylinder in Zhao et al. (Reference Zhao, Cheng and Zhou2009), it has been further validated in many papers for complex flow conditions including flow induced vibration of a rotating cylinder (Munir et al. Reference Munir, Zhao, Wu, Lu and Ning2018, Reference Munir, Zhao, Wu and Lu2019) and flow past finite length square cylinders on a boundary layer flow (Zhao, Mamoon & Wu Reference Zhao, Mamoon and Wu2021). In this section, numerical results of flow past a non-rotating step cylinder with Re = 150, d/D = 0.5, l = 15, L = 30 and α = 0 are compared with the numerical results by Tian et al. (Reference Tian, Jiang, Pettersen and Andersson2020a, Reference Tian, Jiang, Pettersen and Andersson2020b). Simulation is conducted for a non-dimensional time of 500 and the averaged flow is obtained by averaging the results over the last 200 non-dimensional time. Figure 3(a) shows the mean velocity distribution along three lines parallel to z on the larger cylinder side, figure 3(b) shows the mean pressure coefficient distribution along a line parallel to z on the larger cylinder side and figure 3(c) shows the mean velocity distribution along a line in front of the smaller cylinder. In this paper, u, v and w are used to represent the velocity in the x-, y- and z-directions, respectively. The pressure coefficient is defined as  ${C_p} = (\hat{p} - {\hat{p}_0})/(0.5\rho {U^2})$, where ${\hat{p}_0}$ is the dimensional pressure of the free stream. An overbar on top of a variable stands for time averaged (mean) value. The good agreement between the present results with those of the other two numerical studies in figure 3 demonstrate the validation of the present numerical simulation for the simulation of flow past a step cylinder. In addition, in the discussion of the numerical results in § 4, the wake flow features for α = 0 found in this study agree with those observed in previous studies.

Figure 3. Comparison between the presents results of the mean velocity and pressure coefficient with other numerical results for Re = 150, d/D = 0.5, l = 15, L = 30 and α = 0. (a) Mean velocity distribution along three vertical lines of (x,y) = (2,0), (3,0) and (5,0) on the larger cylinder side; (b) distribution of the pressure coefficient along the vertical line of (x,y) = (−0.53, 0) on the larger cylinder side; (c) mean velocity distribution along a vertical line of (x,y) = (−0.4,0).
The non-dimensional computation step used in this study is Δt = 0.002. A time step dependency is conducted using a smaller time step of Δt = 0.001. A mesh dependency study is conducted by conducting a numerical simulation using a denser mesh with the first layer element thickness of 0.0015 on the cylinder surface and 132 elements along the circumference of the cylinder. The numbers of elements of the normal mesh and denser mesh are approximately 14 million and 30 million, respectively. The normal mesh is the mesh density used in all the simulations in this paper. Simulation using a smaller time step and a denser mesh is conducted at the largest rotation rate of α = 4. Figures 4(a) and 4(b) shows the distribution of the time-averaged (mean) sectional drag and lift coefficients along the cylinder span. The sectional drag and lift coefficients at a z-location is defined as  ${C_{Ds}}(z) = 2{F_{Ds}}(z)/(\rho D{U^2})$, ${C_{Ls}}(z) = 2{F_{Ls}}(z)/(\rho D{U^2})$, where ${F_{Ds}}(z)$ and ${F_{Ls}}(z)$ are the sectional drag and lift forces per unit length calculated by integrating the pressure and shear stress over the circumference of the cylinder, respectively. The results of the mean sectional drag and lift coefficient from the two meshes and two time steps are very close to each other, except the sectional drag coefficient in the zone between $z ={-} 4.2$ and $- 2.4$. In § 4 of this paper, it can be seen that the flow near this zone is very dynamic and aperiodic. In the mesh dependency study, simulations are conducted for non-dimensional time of 200. The slight difference between the two meshes in this region is because the simulated time is not very long. Figure 4(c) shows the comparison between the mean velocity along the x-axis calculated from the normal and denser meshes. The agreement of the velocities from the two meshes is very good, indicating that the normal mesh is sufficiently dense for capturing the wake flow structures.

Figure 4. (a,b) Mean sectional drag and lift coefficient from different meshes and time steps for Re = 150, α = 4 and L = 30; (c) mean velocity along the x-axis from normal and denser meshes.
4. Numerical results
Simulations were undertaken for two Reynolds numbers Re = 150 and 100, and it is found that the flow characteristics found at Re = 150 are also found at Re = 100. Section 4.1 presents a detailed discussion on the vortex shedding, the flow variation along the cylinder span and the force coefficient at Re = 150, while § 4.2 shows the results for Re = 100 and mainly discuss the difference between the flow features at Re = 150 and 100.
4.1. The case Re = 150
After simulations were first conducted at l = 15 and L = 30, we found that the length of the larger cylinder is insufficient for α = 0, 0.5 and 1 because either the wake vortices still vary along the cylinder span or are not parallel to the larger cylinder near its bottom boundary. Specifically, the length of the newly found cellular zone for α = 0.5 and 1 is approximately 35 to 40 diameters along the larger cylinder span. To ensure the bottom boundary does not have effects on the result and to capture both the cellular zone and the L-cell on the larger cylinders, simulations at these three rotation rates are repeated with L = 100. The small cylinder length of l = 15 is sufficient because the vortices are two-dimensional and parallel to the smaller cylinder near the top end and L = 30 is sufficiently long for α = 2 and above because vortex shedding in the wake of the larger cylinder is supressed.
Numerical results at α = 0 are discussed first to further validate the current model and to illustrate the aspects of the wake that have not been reported before. Since oscillatory fluid forces on the cylinder are the direct results of vortex shedding, one can understand the effects of the step on the vortex shedding by correlating the vortex shedding pattern with the force coefficients.
Figure 5 shows the wake pattern presented by the iso-surfaces of the second eigenvalue λ 2 of velocity tensor function for α = 0 and L = 100. Jeong & Hussain (Reference Jeong and Hussain1995) has proven the accuracy of using λ 2 to identify the vortex cores and presented a detailed method for calculating λ 2. The vortices in the wake of the larger cylinder are aligned obliquely, instead of being parallel to the cylinder, as indicated in the schematic figure 2 in the paper by Dunn & Tavoularis (Reference Dunn and Tavoularis2006), probably because of the difference in the Reynolds number. This well-organized oblique arrangement of wake vortices can only be found when the cylinder length is sufficiently long, and the Reynolds number is in the laminar flow regime. Vortex shedding with oblique wake vortices caused by a disturbance is termed oblique shedding and the vortex shedding with wake vortices parallel to the cylinder is termed parallel shedding (Williamson Reference Williamson1989). Oblique shedding reduces the vortex shedding frequency and significantly affects the integrated total force on the whole larger cylinder span because the phase of vortex shedding varies along the cylinder, which can be demonstrated by the mapping of the sectional lift coefficient on the temporal–spatial plane (tz-plane) in figure 6, where positive and negative sectional lift coefficients are mapped on the tz-plane using green and white colours, respectively. The variation of the phase of the oscillatory lift coefficient along the span of the large cylinder can be proven by the inclined lift coefficient straps in figure 6. The straps of the lift coefficient on the small cylinder (z > 0) are nearly parallel to the z-axis, indicating that the wake vortices are parallel to the cylinder. It can be seen that the inclination of the wake vortices progresses gradually in the negative z-direction and reaches the bottom end of the larger cylinder at approximately t = 650.

Figure 5. Vortex flow pattern represented by the iso-surfaces of  ${\lambda _2} ={-} 0.1$ for Re = 150, L = 100 and α = 0. The red and blue colours represent positive and negative vorticities in the z-direction, respectively. (a) The global view of the wake at t = 735 and (b) close-up views near the step from t = 710 to 737.5.

Figure 6. Mapping of the lift coefficient on the tz-plane for Re = 150, L = 100 and α = 0. The green and white colours on the map represent positive and negative lift coefficients, respectively.
The disconnection of the lift coefficient straps in figure 6 is correlated to the vortex dislocation (VD) at the boundary between the N- and L-cells, and VD causes discontinuity of the phase of the lift coefficient. For example, the disconnection of the lift coefficient straps near t = 725 in figure 6 can be explained by the VD illustrated in figure 5(b). In the rest of this paper, vortices with positive and negative vorticity in the z-direction are referred to as positive and negative vortices, respectively. In figure 5(b), vortices are labelled using a cell name followed by a vortex number. The odd and even vortex numbers represent positive and negative vortices, respectively. For example, N1, N3 and N5, etc. are positive vortices and N2, N4, N6, etc. are negative vortices in N-cells. At t = 710 in figure 5(b), N1 and L1 are one integral vortex but with some bend at the boundary between N- and L-cells. Following N1 and L1, N3 and L3 at t = 717.5 are still connected but the degree of bend becomes strong. At t = 722.5 to 727.5, N5 and L5 dislocate from each other and this VD corresponds to the disconnection of the lift strap at approximately t = 725 in figure 6. After disconnected from L5 at t = 732.5 in figure 5, N5 curls and forms a half-circle, which was defined as a fake loop by Tian et al. (Reference Tian, Jiang, Pettersen and Andersson2017). Afterwards, N6 and L6 disconnect from each other at t = 730 and N7 and L7 disconnect from each other at t = 736. Subsequently, N6 and N7 form a whole loop at t = 735, as indicated in figure 5(b). Tian et al. (Reference Tian, Jiang, Pettersen and Andersson2017) defined this loop as an N–N loop and the half-loop formed by L7 and L9 at t = 737.5 as a half-L–L loop. The loops observed in figure 5 were also presented in the numerical study by Morton & Yarusevych (Reference Morton and Yarusevych2010). The vortex features in figure 5(b) also agree well with those found in previous studies (Tian et al. Reference Tian, Jiang, Pettersen and Andersson2020b). This paper further proved that the well-defined oblique vortex shedding behind the large cylinder that can only be identified when the length if the larger cylinder is L = 100.
The phase difference between different cells is the reason of the VD caused by any disturbance, including a step (Norberg Reference Norberg1994). Tian et al. (Reference Tian, Jiang, Pettersen and Andersson2020b) reported that the phase difference accumulation is the main mechanism of VD between N- and L-cells and used vortex shedding patterns similar to figure 5 to demonstrate the phase difference of vortex shedding. The vortex shedding phase difference causes phase difference between the oscillatory lift coefficients between N- and L-cells. The periodic synchronization and desynchronization between the time histories of the sectional lift coefficients in N- and L-cells shown in figure 7 further proves the periodic occurrence of VD. When the vortex shedding of the two cells desynchronize, for example at t = 725, VD occurs (figure 5 at t = 725) and the lift coefficients of the two cells are out of phase with each other (figure 7). When the lift coefficients of the two cells are in phase with each other, for example at t = 737.5 in figure 7, vortices in the wake of the larger cylinder become continuous without any dislocation at the boundary between N- and L-cells. The periodic desynchronization of the lift coefficient in figure 7 indicates the periodic VD. The periodicity of VD can also be easily identified in figure 6 and its period is found to be approximately 7 vortex shedding periods of the L-cell, which is constant with what was reported by Tian et al. (Reference Tian, Jiang, Pettersen and Andersson2020a).

Figure 7. Periodic synchronization and desynchronization between the lift coefficients at N- and L-cells for Re = 150.
The vortex shedding frequency of the N-cell is found to change in time to allow periodic synchronization vortex shedding between N- and L-cells. The variation of the vortex shedding frequency at α = 0 is proven by the time histories of the Strouhal number in figure 8(a). The Strouhal number is the non-dimensional frequency of the vortex shedding. It is the modulation of amplitude and frequency that cause the temporal variation of the amplitude and frequency, which was also reported by Lewis & Gharib (Reference Lewis and Gharib1992). The instantaneous vortex shedding frequency is defined by the zero-crossing method indicated on the right of figure 8. Dunn & Tavoularis (Reference Dunn and Tavoularis2006) found that the local frequency near the boundary between two cells varies with time. Zhao (Reference Zhao2021) also found when dislocation occurs, both the amplitude of the lift coefficient and vortex shedding frequency very with time. In this study, it is found that the instantaneous vortex shedding frequency also varies with time in the whole N-cell. At α = 0, the Strouhal number at  $z ={-} 0.28$ oscillates between 0.143 and 0.167 periodically in figure 8(a). The maximum Strouhal number of $z ={-} 0.28$ is slightly smaller than the Strouhal number of the L-cell, which is 0.179. Morton & Yarusevych (Reference Morton and Yarusevych2010) presented the beating of flow velocity in the N-cell at Re = 150 and d/D = 0.5, which is similar the beating of the CLS in figure 8. The beating is essentially the periodic slowing down and speeding up of the vortex shedding of the N-cell relative to the L-cell and is correlated with the periodic occurrence and disappearance of dislocation.

Figure 8. Time history of the sectional lift coefficient CLS and the instantaneous Strouhal number with time in two sections in N-cells for Re = 150, α = 0 and 1, respectively. The definition of the instantaneous frequency is defined in the sketch on the right of the figure.
Another feature observed in figure 5(a) is that the inclination of the wake vortices extends towards the free end of the large cylinder gradually. Only after t = 650 do all the wake vortices become fully oblique, and the vortex shedding becomes fully oblique shedding. To quantify the effect of the vortex inclination in the L-cell on the lift coefficient, the variation of the phase angle (φ) of the lift coefficient along the span of the larger cylinder is presented in figure 9. If the lift coefficient on a z-section follows a sinusoidal function with time, it can be represented by  ${C_{LS}}(z,t) = {A_L}(z)\sin (2{\rm \pi} ft + \varphi )$. The phase angle of the lift coefficient of a spanwise location is defined as the phase difference between the lift coefficient at this location and that at the centre of the large cylinder as the reference position. The detailed method for calculating the phase angle using the cross-correlation method was given in Zhao (Reference Zhao2021) and will not be repeated here. The phase in figure 9 varies linearly, except near two ends of the L-cell. If the non-dimensional length of the larger cylinder is L = 100, the gradient of the phase variation is 24.3° per cylinder diameter, indicating that the phase changes 360° after 14.8D, or the lift coefficient repeats after every 14.8D along the N-cell span or if total lift of 14.8D or multiple of 14.8D long L-cell span should be zero.

Figure 9. Variation of the phase of the oscillatory lift coefficient along the L-cell span of the cylinder for Re = 150.
Figure 10 shows the distribution of the standard derivation (SD) and Strouhal number of the sectional lift coefficient on the cylinder span for α = 0, 0.5 and 1. The SDs of the sectional drag and lift coefficients are represented by  ${C^{\prime}_{LD}}$ and ${C^{\prime}_{LS}}$, respectively. In the case where the vortex shedding frequency varies in time, as seen in figure 8, the Strouhal number in figure 10 is the averaged non-dimensional frequency of the lift coefficient ${S_t} = f = 1/\bar{T}$, where $\bar{T}$ is the non-dimensional time-averaged oscillatory period of the lift coefficient; ${S_t}$ is found to be the same as the non-dimensional peak frequency of the fast Fourier transform (FFT) spectrum.

Figure 10. Distribution of the standard deviation of sectional lift coefficient and Strouhal number along the cylinder span for Re = 150 and α = 0; (a) SD lift coefficient, (b) mean drag coefficient, (c) Strouhal number and (d) classification of zones based on Strouhal number.
Comparison between the results of L = 30 and 100 in figure 10 demonstrates that the end effect on the force of the large cylinder at L = 30 is negligibly small within  $- 20 \le z \le 0$ for all the three rotation rates. The results for L = 100 demonstrate that L = 30 is sufficient for the simulation of flow near the step but insufficient to cover the whole part of the larger cylinder where the effect of the step disappears, especially for α = 0.5 and 1. When $z < - 20$, the difference between ${C^{\prime}_{LS}}$ at L = 30 and at L = 100 increases with the decrease of z. In figure 10(d), the cylinder span is divided into three zones with three distinct Strouhal numbers for α = 0 and these three zones are the L-, S- and N-cells, respectively. The nearly constant vortex shedding frequency in every cell agrees with the observation by Morton & Yarusevych (Reference Morton and Yarusevych2014).
The variation of the Strouhal number with z for α = 0.5 and 1 is different from that for α = 0 in the following ways. Fist, the low-frequency N-cell becomes very short at α = 1 and disappears at α = 0.5. Second, an additional cellular zone with frequencies lower than the frequency of the L-cell and higher than the frequency of the N-cell is observed in figure 10(d). In this zone, the wake vortices are divided into a few cells with VD between them, as discussed below. It is defined as the cellular zone because the wake feature is very similar to the cellular vortices in the wake of a tapered cylinder (Narasimhamurthy et al. Reference Narasimhamurthy, Andersson and Pettersen2009), which is also characterized by VD between cells and reduction of vortex shedding frequency. The N-cell is on the large cylinder is in the range  $- 5.3 \le z \le 0$ for α = 0 but reduced to $- 1.5 \le z \le 0$ for α = 1. Figure 10(d) demonstrated that the Strouhal number does not vary along the cylinder span within the N-cell. However, the sectional lift coefficient varies significantly within the N-cell. At α = 0, the variation of the sectional lift coefficient in the L-cell is strong at $z \le 15$ and becomes weak when at $z > 15$. The left boundary of the cellular zone is found to between z = −40 and −35 for α = 0.5 and 1 in figure 10(d).
The strong variation of the lift coefficient and Strouhal number in the long cellular zones for α = 1 and 0.5 shown in figure 10(d) suggests a complex wake in these zones. The iso-surfaces of  ${\lambda _2} ={-} 0.1$ for L = 100 and α = 1 are shown in figure 11 to illustrate the wake pattern of the cellular zone. The vortices in the wake of the larger cylinder are labelled to facilitate the discussion. The vortex street in the wake of the larger cylinder is found to include three zones: a very short N-cell zone, a long cellular zone with many VDs and an L-cell with parallel shedding. The vortex shedding frequency in the N-cell is much lower than other zones, as shown in figure 10(d). However, the length of the N-cell is much shorter than that at α = 0 and is negligibly shorter than the cellular zone. Figure 11 is mainly for showing the flow features in the cellular zone and the N-cell will be discussed through a close-up view near the step in figure 12 after the discussion of figure 11.

Figure 11. Vortex flow pattern in the wake of larger cylinder represented by the iso-surfaces of  ${\lambda _2} ={-} 0.1$ for Re = 150, L = 100 and α = 1. The red and blue colours represent positive and negative vorticities in the z-direction, respectively.

Figure 12. Vortex flow pattern near the step represented by the iso-surfaces of  ${\lambda _2} ={-} 0.1$ for Re = 150, L = 100 and α = 1. The red and blue colours represent positive and negative vorticities in the z-direction, respectively.
In figure 11, the wake in the cellular zone is divided into three cells 1 to 3 with VD between them. The inclined vortices in the cellular zone are in wavy shapes. The flow pattern in the cellular zone resembles the flow visualization of the cellular vortex shedding behind a tapered cylinder presented by Narasimhamurthy et al. (Reference Narasimhamurthy, Andersson and Pettersen2009). The difference is that the cellular zone has finite length in figure 11 for the rotating step cylinder. The wavy vortices with VD are also like the wavy wake vortices of the flow in the wake of a uniform circular that transitions from two-dimensional to three-dimensional as the result of increase of the Reynolds number (Williamson Reference Williamson1996). In figure 11, the cellular zone is divided into three cells and each cell corresponds to a wavelength. At t = 622.5, all the wavy vortices 1 to 6 are continuous but each vortex will be divided into two filaments before dislocation occurs, as is the case for each vortex in the N-cell. At t = 632.5, one filament of vortex 5 in cell 2 starts to link to vortex 7 in cell 3, whose one filament also starts to link to cell 9 in cell 4. At t = 637.5, vortices 7–9 join each other at the boundary between cells 2 and 3 and vortices 9–11 join each other at the boundary between cells 3 and 4. After vortices 5, 7 and 9 dislocate, they are linked to other vortices. At t = 642.5 in figure 11, vortices 9–11 link to each other at the boundary between cells 2 and 3 and vortices 11–13 linked at the boundary between cells 3 and 4 are fully established.
The wake flow pattern downstream of the N-cell at α = 1 shown in figure 12 resembles that at α = 0, but with some slight difference. Vortex dislocation on the top and bottom boundaries of the N-cells can be clearly seen in figure 12. Compared with α = 0, the closed N–N loop was not found in figure 12. Each N–N loop at α = 0 is formed by one negative vortex and one positive vortex that are shed from the two sides of N-cells. When a cylinder is rotating, positive vortices on one side of the cylinder become significantly weaker than the negative vortices on another side (El Akoury et al. Reference El Akoury, Braza, Perrin, Harran and Hoarau2008; Lam Reference Lam2009; Zhao, Cheng & Lu Reference Zhao, Cheng and Lu2014). C-shaped N-loops instead of N–N loops are observed in figure 12 because vortices from one side of the N-cell contribute to the loop formation much more than the vortices from the other side. In addition, the very short length of the N-cell also makes it difficult to form a closed N–N loop. The C-shaped N-loop vortices in figure 12 resemble the hairpin vortices in the wake of a very short cylinder (Yang, Feng & Zhang Reference Yang, Feng and Zhang2022) or a sphere (Nagata et al. Reference Nagata, Nonomura, Takahashi, Mizuno and Fukuda2018). When a rotating sphere is placed in a flow a single-sided harpin vortex street was found (Giacobello, Ooi & Balachandar Reference Giacobello, Ooi and Balachandar2009; Rajamuni, Thompson & Hourigan Reference Rajamuni, Thompson and Hourigan2018). The C-shaped N-loop vortices do not form a hairpin wake vortex street because of the strong influences form the S-cell and L-cell vortices. Although a completed hairpin vortex street was not observed, a series of N-loop vortices are seen at t = 603.75 and 605 in figure 12. The L–L loops are clearly identified in figure 12 and in the same shape as the L–L loop at α = 0 in figure 5.
Figure 13 shows the mapping of the sectional lift coefficient the tz-plane for L = 100 and α = 1. The VD illustrated in figure 12 causes the discontinuity of the lift coefficient straps in figure 13. Based on the intermittent occurrence of the discontinuity of the lift coefficient straps in figure 13, we can deduce that the VD occurs intermittently in the cellular zone instead of periodically like the one on the boundary between the N- and L-cells at α = 0. The number of cells and the boundaries between cells in the cellular zone change. The inclination of the lift coefficient straps in figure 13 indicates that the vortices in the cellular zone are oblique to the cylinder. However, vortices in the L-cell are nearly parallel to the cylinder. It appears that, after each VD area in figure 13, a parallel vortex zone extends towards to the step (z = 0). This observation indicates that VD can correct the alignment angle of wake vortices to make them parallel to the larger cylinder. This is also proved in figure 12 by the fact that vortices are oblique at t = 622.5, but after VD and reorganization at t = 642.5 vortices 9–11–13 are overall parallel to the cylinder although not straight. The VD and reorganization have the function of maintaining a parallel vortex zone in the bottom part of the larger cylinder. The straps of the lift coefficient in the very short N-cell in figure 12 have the same characteristics as that at α = 0 in figure 6, i.e. they disconnect periodically.

Figure 13. Mapping of the sectional lift coefficient on the tz-plane for Re = 150, L = 100 and α = 1. The green and white colours on the map represent positive and negative lift coefficients, respectively.
Figure 14 shows flow patterns near the step for α = 0.5 represented by the iso-surfaces of  ${\lambda _2} ={-} 0.1$. The biggest difference between the flow at α = 0.5 and those at α = 0 and 1 is that the N-cell does not exist. Without the N-cells, vortices in the S- and L-cells interact with each other directly and dislocation occurs at the step position in figure 14. The VD mechanism at the boundary between S- and L-cells resembles the VD that occurred at the boundary between the N- and S-cells at α = 0. At α = 0, the vortices of the N-cell form N–N loops because they are short and dislocation occurs at their both ends, while at α = 0.5, the vortices of the L-cell form half-L–L loops. The vortex shedding of the S-cell is faster than the L-cell, but continuity of vortices at the step occurs whenever the vortex shedding from the larger and smaller cylinders are in phase with each other. Vortices S1-L1 at t = 505 and S5-L3 at t = 520 in figure 14 are examples of continuous vortices.

Figure 14. Vortex flow pattern near the step represented by the iso-surfaces of  ${\lambda _2} ={-} 0.1$ for Re = 150, L = 100 and α = 0.5. The red and blue colours represent positive and negative vorticities in the z-direction, respectively.
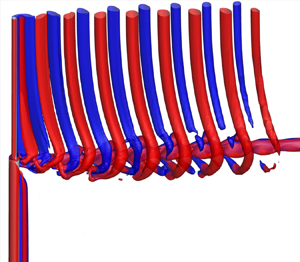
Vortex shedding for flow past a rotating cylinder is suppressed at α = 1.9 for Re = 160 (Kang et al. Reference Kang, Choi and Lee1999; Kang Reference Kang2006) and at approximately α = 2 for Re = 150 (Munir et al. Reference Munir, Zhao, Wu and Lu2019). The Reynolds number for the smaller cylinder is 75 and the rotation rate α = 2 for the larger cylinder corresponds to a rotation rate of αs = 1 for the smaller cylinder, where αs is defined as the rotation rate for the smaller cylinder. Figure 15 shows the vortex shedding for α = 2 and 3 represented by the iso-surfaces of  ${\lambda _2} ={-} 0.02$. The vortex shedding is fully supressed in the wake of the larger cylinder, but still exists in the wake of the smaller cylinder at α = 2 and 3. The noteworthy phenomenon observed in figure 15 is the strong streamwise vortex in the wake of the step. The large-scale streamwise vortex is very similar to the hub vortex in the wake of the hub and impeller (Shi et al. Reference Shi, Wang, Zhao and Zhang2022) and is thereafter referred to as a hub vortex. The strong vorticity of the hub vortex can be further seen in the contours of vorticity magnitude on the two planes shown in figure 16. The magnitude of the vorticity is defined as $\omega = \sqrt {\omega _x^2 + \omega _y^2 + \omega _z^2} $, where ${\omega _x}$, ${\omega _x}$ and ${\omega _x}$ are the vorticity in the x-, y- and z-directions, respectively. The low pressure of this streamwise hub vortex attracts the vortices that are shed from the smaller cylinder towards its centre. As a result, the vortices from the smaller cylinder roll around the hub vortex and form helical vortices, as seen in figure 15. Because vortices from the smaller cylinder roll in the positive x-direction around the hub vortex, their vorticity on the negative y-side is much stronger than on the positive y-side in figure 15. The helical vortices generated from the smaller cylinder wake vortices resemble the helical tip vortices in the wake of impellers that are generated from the tips of impeller blades. The difference is that the helical vortices in figure 15 are much closer to the hub vortex than the helical vortices of an impeller. Within the vortex shedding regime, the strength of wake vortices of a rotating cylinder reduces with the increase of α (Lam Reference Lam2009). This is the reason why the helical vortices at α = 3 are weaker than at α = 2 in figure 15. Figure 16 shows the contours of vorticity magnitude on two planes that pass through the centre of the hub vortices. The vorticity of the hub vortex is much greater than that of the helical vortices. The hub vortex still exists after helical vortices have dissipated in figures 15 and 16.

Figure 15. Vortex flow pattern near the step at t = 437.5 represented by streamlines and iso-surfaces of  ${\lambda _2} ={-} 0.02$ for Re = 150, L = 30 and α = 2. The red and blue colours represent positive and negative vorticities in the z-direction, respectively. Streamlines start from 20 points evenly distributed along the straight line of $(x,y) = ( - 1,0)$ and z from $- 4$ to 4.

Figure 16. Contours of vorticity magnitude on two sections that go through the centre of the hub vortex for Re = 150 and α = 3 at t = 300; (a) section  $y = 1.3$ and (b) section $z ={-} 1$.
Figure 17 shows iso-surfaces of  ${\lambda _2} ={-} 0.5$ of the mean flow for α = 2 and 3. The mean flow is obtained by averaging the stabilized flow over 200 non-dimensional time. The dynamics of helical vortices is filtered out in the mean flow and the strong hub vortex remains. The twisting streamlines circle around the hub vortex because the low pressure of the strong hub vortex attracts the flow towards its centre. The flow directions on the negative and positive sides of the step bend towards the larger and smaller cylinders, respectively. The strength of the hub vortex is found to increase with the increase of rotation rate α.

Figure 17. Streamwise vortex of the mean flow represented by streamlines and iso-surfaces of  ${\lambda _2} ={-} 0.5$ for Re = 150, L = 30 and α = 2 and 3. Streamlines start from 20 points evenly distributed along the straight line of $(x,y) = ( - 2, 0)$; (a) α = 2 and (b) α = 3.
The formation of the hub vortex can be explained by the deflection of the flow in the wake of the rotating cylinder due to the Magnus effect (Mittal & Kumar Reference Mittal and Kumar2003). Figures 18(a) and 18(b) show the contours of pressure and streamlines of the mean flow on two constant-z planes on the smaller and larger cylinder sides of the step, respectively. The Magnus effect makes the flow biased towards the positive y-side of the cylinder in the wake. At the same time, negative pressure is generated on the negative side of the cylinder, as seen in figures 18(a) and 18(b). The degree of biased flow and the magnitude of the negative pressure on the negative y-side increase with the increase of the rotation rate. Because the rotation rate of the larger cylinder is twice the rotation rate of the smaller cylinder, the flow behind the larger cylinder is biased towards the positive side more than behind the smaller cylinder. As illustrated in figure 16(b), if the flow direction on the larger cylinder side bends towards the positive y-side, the flow direction on the smaller cylinder side must passively bend towards the negative side considering mass conservation. This forms a helical flow pattern and a hub vortex. In addition, the stronger lower pressure on the negative y-side of the larger cylinder shown in figure 18 causes downward flow behind the step, as indicated in figure 17(b), and this downward flow on one side of the cylinder also enhances the circulating flow of the hub vortex. With the increase of α, the hub vortex becomes stronger because the flow behind the larger cylinder is more biased and the downward flow velocity on the negative y-side indicated in figure 17(b) increases. Figures 18(c)–18(e) show the centre of the hub vortex at three x-locations for α = 3. The centre of the hub vortex is the location where the vorticity in the x-direction reaches its minimum and is the centre of the circular streamlines. It moves away from the cylinder with the increase of x in figure 18.

Figure 18. Streamlines and contours of pressure of mean flow on different sections for Re = 150 and α = 3; (a) z = 3, (b) z = −3, (c) x = 0, (d) x = 2 and (e) x = 4.
The variations of the position on the yz-plane, the mean streamwise velocity and the mean pressure of the hub vortex core are quantified in figure 19. The hub vortex is located on the negative z-side because the larger wake of the larger cylinder attracts the vortex towards its side. The biased flow toward the positive y-side (see figure 17b) pushes the hub vortex toward the positive y-side. The core of the hub vortex moves away from the x = 0 axis (i.e. magnitudes of y and z increase) with the increase of rotation rate. The maximum values of y and |z| at α = 4 are 2.85 and 2.31, respectively. The pressure reduction of the hub vortex core is the maximum at the smallest x in figure 19(d) and it decreases with the increase in x. Significant reduction of the streamwise velocity u is found in figure 19(c). At α = 4, the velocity  $\bar{u}$ is only 0.18 in the range between x = 3 and 23.

Figure 19. Variation of the position, pressure and streamwise velocity u of the hub vortex core in the x-direction based on the mean flow (Re = 150); (a) y-position of hub vortex core, (b) z-position of hub vortex core, (c) mean velocity u of hub vortex core and (d) mean pressure of hub vortex core.
As the rotation rate is increased to 4, vortex shedding is suppressed from both larger and smaller cylinders. Figure 20 shows the streamlines and iso-surfaces  ${\lambda _2} ={-} 0.02$ for L = 30 and α = 4. Since the vortices are predominately in the x-direction, red and blue colour iso-surfaces are used to represent positive and negative x-vorticities, respectively. As the rotation rate is increased to α = 4, the ration rate of the smaller cylinder of αs = 2 becomes greater than the critical value for the vortex shedding suppression. The hub vortex still exists at α = 4 with the increased strength compared with those at α = 2 and 3, evidenced by the smaller pressure of the hub vortex in figure 19(c). Flow past a uniform rotating cylinder is characterized by finger-shaped vortices (FVs) at Re = 150 and α = 4 (Munir et al. Reference Munir, Zhao, Wu and Lu2019) and some other close combinations of Re and α (Navrose & Mittal Reference Navrose and Mittal2015). The FVs in the wake of the larger cylinder are clearly seen in figure 20. In addition, the FVs near the step are strongly affected by the helical flow and trapped in the hub vortex.

Figure 20. Vortex flow pattern near the step at t = 250 represented by streamlines and iso-surfaces of  ${\lambda _2} ={-} 0.02$ for Re = 150, L = 30 and α = 4. The red and blue colours represent positive and negative vorticities in the x-direction, respectively. Streamlines start from 20 points evenly distributed along the straight line of $(x,y) = ( - 1,0)$ and z from $- 6$ to 4.
Although vortex shedding is fully supressed for both smaller and larger cylinders, the flow at α = 4 is found to be very dynamic, especially near the step, which can be proved by the temporal variation of the pressure along the vertical line of  $(x,y) = (0, - 0.5)$ on one side of the larger cylinder shown in figure 21. The horizontal straps below $z ={-} 5$ in the contour figure are caused by the finger-shaped vortices indicated in figure 20. The disconnection and reoccurrence of these horizontal straps indicated that the finger-shaped vortices are dynamic, and they may disappear and reappear at a particular location. The pressure variation below $z ={-} 5$ is very similar to that of a uniform cylinder. The attention-grabbing phenomenon in figure 21 is the high-amplitude and high-frequency oscillation of the pressure in the region of $- 1 < z < - 3$, which has never been reported previously. The oscillation of the pressure causes the high-frequency oscillation of the sectional force as seen in the time histories of the sectional lift coefficient at the bottom of figure 22. The reason for the high-frequency and high-amplitude oscillation of the pressure and sectional lift coefficient of the larger cylinder near the step is the combination of ring-shaped vortices and the downward motion of the flow along the cylinder span illustrated by the contours of streamwise vorticity and streamlines on the yz-plane in figures 22(a)–22(f). Near the step, finger-shaped vortices originate from the ring vortices that surround the large cylinder, as seen in figures 20(a) and 20(b). Some of the ring vortices are labelled in figure 22 for the convenience of discussion. It can be seen in figures 18(a) and 18(b) that the negative y-side of the larger cylinder has greater negative pressure than the same side of the smaller cylinder. As a result, a downward flow in the negative z-direction is generated on the negative y-side of the cylinder, as seen in figures 22(a)–22(f). In figure 22(a), a ring vortex A1 is growing immediately below $z ={-} 1$ and the vertical flow makes it move downwards during t = 252.2 to 254.95 and finally merges into vortex C in figure 22(f). While vortex A1 is moving downwards, vortex A2 is generated and repeats the downward motion of vortex A1. The position of A2 in figure 22(f) is the same as the position of A1 in figure 22(b) and the duration between figures 22(f) and 22(b) is the oscillation period of the pressure. Near the step, the frequency of the generation of ring vortices that move downward is the same as the frequency of oscillation of the pressure in the zone between $z ={-} 1$ and $- 3$ shown figure 21. From figures 21 and 22 it can be seen that the high-frequency oscillation of the pressure mainly occurs in the zone between $z ={-} 1$ and $- 3$. The downward flow at the negative y-side of the large cylinder near the step is caused by the difference in the pressures between the larger and smaller sides of the step. The combination of this downward flow and the periodic generation of ring vortices is the reason for the high-frequency oscillation of the pressure. The vorticity below $z ={-} 5$ in figure 22 become much weaker than that above this line. The hub vortex behind the step in figure 20 is generated under the same mechanism as the hub vortices at α = 2 and 3.

Figure 21. Contours of the non-dimensional pressure along the line of  $(x,y) = (0, - 0.5)$ on tz-plane for Re = 150 and α = 4.

Figure 22. (a–f) Contours of streamwise vorticity ωx and streamlines on the yz-plane for Re = 150 and α = 4; (g) time histories of sectional lift coefficient on four sections; (a) t = 252.2, (b) t = 252.7, (c) t = 253.15, (d) t = 253.55, (e) t = 253.95, (f) t = 254.95.
Figure 23 shows the distribution of the SD sectional lift coefficient and mean sectional drag coefficient along the z-direction for various values of α. Munir et al. (Reference Munir, Zhao, Wu and Lu2019) reported that flow past a rotational cylinder with Re = 150 is stationary and two-dimensional at α = 2 and 3 and is dynamic and three-dimensional with finger- and ring-shaped vortices at α = 4. The  ${C^{\prime}_{LS}}$ on the larger cylinder is zero at α = 2 and 3 because the vortex shedding of the larger cylinder is fully suppressed as in the flow visualization in figure 15. When the rotation rate is increased to α = 4, ${C^{\prime}_{LS}}$ of the smaller cylinder becomes zero because the rotation rate relative to the smaller cylinder ( ${\alpha _s} = 2$) reaches the level for vortex shedding suppression. However, ${C^{\prime}_{LS}}$ of the larger cylinder is not zero at α = 4 because the flow is still dynamic with finger-shaped vortices, as shown in figure 20, especially near the step, as discussed before. That the SD sectional lift coefficient is big on the larger cylinder near the step is because of the dynamic helical vortices at α = 2 and 3 shown in figure 15 and the dynamic ring vortices shown in figures 20 and 22. The increase of the mean sectional drag coefficient below the step at α = 2, 3 and 4 in figure 23(b) is caused by low pressure in the hub vortex.

Figure 23. Distribution of the SD sectional lift coefficient and mean sectional drag coefficient along the z-direction various values of α for Re = 150; (a) SD lift coefficient and (b) mean drag coefficient.
Dynamic mode decomposition (DMD) analyses are carried out to further illustrate the vortex shedding modes identified through flow visualization. DMD based on a sufficiently large number of samples of the flow field with a constant time interval between them can predict the flow field at the next time with high accuracy if all the dominant modes are contained in the dataset. A modal convergence study is firstly conducted by calculating the root mean square error (RMSE) between the snapshot data and DMD reconstruction result at time m + 1, i.e. the L 2 norm of  ${\boldsymbol{x}_{m + 1}} - {\tilde{\boldsymbol{y}}_{m + 1}}$
 \begin{equation}||{\boldsymbol{x}_{m + 1}} - {\tilde{\boldsymbol{y}}_{m + 1}}|{|_2} = \sqrt {\mathop \sum \limits_{i = 1}^n {{({\boldsymbol{x}_{i,m + 1}} - {{\tilde{\boldsymbol{y}}}_{i,m + 1}})}^2}} ,\end{equation}
where m is the sample number, In this study, different non-dimensional sampling time intervals Δts = 0.025, 0.05, 0.075, 0.1, 0.125 (capturing the modes in the frequency range of 0 ≤ Stmode ≤ 20, 10, 6.67, 5, 4, respectively) and non-dimensional coverage periods Ts = 2 T to 5 T, where T = 5.5 is the non-dimensional vortex shedding period of the larger cylinder, are tested to investigate the effect of sampling time interval and coverage period on the modal convergence.
Figure 24 shows the RMSE between the snapshot data and the DMD reconstruction result for the case of α = 0.5. The reconstruction error decreases with the increase of the coverage periods and the decrease of the sampling interval. For Ts = 5 T, the RMSE is maximum at Δts = 0.125 and reduces with the decrease of Δts. Moreover, for Δts = 0.025, the difference in error between Ts = 4 T and Ts = 5 T is negligibly small. Hence, we consider the snapshot number m = 1100 (Δts = 0.025 and Ts = 5 T) for use for the DMD analyses in this study.

Figure 24. The RMSE of the DMD reconstruction as a function of sampling interval with coverage period for Re = 150 and α = 0.5, where T = 5.5 is the vortex shedding period of the larger cylinder.
DMD is only conducted for the cases where periodic vortex shedding exists, i.e. α = 0, 0.5 and 1. Only the DMD modes for α = 0 and 0.5 are considered since they cover all the modes found at α = 1. Figure 25 shows the iso-surface of the DMD modes for two rotation rates at α = 0 and 0.5. The modes corresponding to the L-, S- and N-cells are separated from each other successfully using DMD in the figure. In figures 25(a) and 25(d), only the modes of the L-cell behind the larger cylinder are retained and other modes are removed. The DMD mode frequencies of the L-cells in figure 25 agree with their values shown in figure 10. The DMD mode of the N-cell in figure 25(b) is not well organised because vortices deform significantly after they are shed from the cylinder in this zone. DMD modes whose frequency is the same as the S-cell frequency only have vortices behand the smaller cylinder in figures 25(c) and 25(f). The DMD mode of the cellular zone in figure 25(c) is very chaotic because dislocation of vortices occurs frequently in this zone. The vortex shedding in the L-cell is in oblique mode at α = 0 and parallel mode at α = 0.5 in figures 25(a) and 25(d), respectively. At α = 0, frequencies of the L-, S- and N-cells are distinctly different from each other, as shown in figure 10. As a result, the DMD modes of these three cells are also well defined in figure 25, i.e. the DMD mode of one cell does not have other components of other cells. At α = 0.5, the closeness between the frequencies of the L-cell and cellular zone makes these two zones not absolutely separated from each other by DMD, as shown in figures 25(d) and 25(e).

Figure 25. Three-dimensional DMD modes presented by iso-surfaces of  ${\lambda _2} ={-} 0.0001$ for Re = 150; (a) α = 0, St = 0.176; (b) α = 0, St = 0.153; (c) α = 0, St = 0.301; (d) α = 0.5, St = 0.184; (e) α = 0.5, St = 0.165 and (f) α = 0.5, St = 0.301.
4.2. The case Re = 100
Figure 26 shows the vortex flow pattern in the wake of the step cylinder for Re = 100 and various values of α. The wake patterns observed at Re = 150 are also found at Re = 100, except for helical vortices and finger-shaped vortices.

Figure 26. Vortex flow pattern in the wake of cylinder represented by the iso-surfaces of  ${\lambda _2} ={-} 0.1$ for Re = 100. The red and blue colours represent positive and negative vorticities in the z-direction, respectively; (a) α = 0, (b) α = 0.5, (c) α = 1, (d) α = 2, (e) α = 3 and (f) α = 4.
The helical vortices form through two mechanisms: a large streamwise vortex that forms the hub and the wake vortices that are shed from the smaller cylinder, as seen in figure 25(d). At Re = 100, the vortex shedding from the smaller cylinder disappears when the hub vortices form. As a result, helical vortices do not exist. At Re = 100 and α = 2, the Reynolds number and rotation rate based on the smaller cylinder diameter are 50 and 1, respectively. The wake of Re = 50 and α = 1 for the small cylinder is the boundary of the steady flow regime, where there is no vortex shedding (El Akoury et al. Reference El Akoury, Braza, Perrin, Harran and Hoarau2008). The non-existence of vortex shedding from the smaller cylinder is also seen in figure 26(d). A helical vortex structure cannot form without the supply of the vortices. The finger-shaped vortices in the wake of the large cylinder were not found at Re = 100 because the flow is two-dimensional at Re = 100 and α values up to 4 (Munir et al. Reference Munir, Zhao, Wu and Lu2019).
The inclination of wake vortices in the wake of the larger cylinder found at Re = 150 is also observed at Re = 100 in figure 26. However, the VD in the L-cell was not observed at Re = 100 after t = 750 when the wake is fully developed. Vortex dislocation is not found in the L-cell mainly because Re = 100 is a low Reynolds number in the laminar flow regime, where any flow disturbance can be dissipated. Figure 27 shows the contours of the sectional lift coefficient at Re = 100 and α = 0, 0.5 and 1. The time required for the vortex shedding flow to be developed to the stable stage for Re = 100 is much longer than Re = 150. A non-dimensional time of 800 is necessary to let the flow develop to its stable stage at Re = 100. The progress of the flow disturbance by the step can be evidenced by extending the inclined lift straps towards the free end of the large cylinder in figure. 27. The three-cell wake feature at Re = 100 and α = 0 in figure 26(a) is the same as the one at Re = 150, but with a longer N-cell length. The periodic occurrence of the VD at the boundary between the N-cell and L-cell exist at Re = 100 (reflected by the disconnections of the lift coefficient strap) in figure 26(a). At α = 0.5 and 1, VD occurs at the early stage of the flow development when the disturbance by the step progresses towards the free end of the large cylinder, as illustrated in figures 27(b) and 27(c).

Figure 27. Contours of the section lift coefficient on the tz-plane for Re = 100; (a) α = 0, (b) α = 0.5 and (c) α = 1.
Based on the comparison between the flow features at Re = 150 and 100, it can be derived that the wake pattern of a step cylinder for Reynolds numbers in the laminar flow regime can be predicted based on the findings of flow past a uniform rotating cylinder. If vortex shedding occurs from larger and smaller cylinders, the wake can be divided into three cells (S-, N- and L-cells) and two cells (S- and L-cells). If the vortex shedding occurs in the smaller cylinder but not in the larger cylinder, the wake can be dominated by a strong streamwise vortex surrounded by helical vortices (figure 15). If vortex shedding is suppressed in the wake of both cylinders, the wake has only a strong streamwise vortex (figures 20 and 26d,e).
Figure 28 shows the variations of the SD sectional lift coefficient, mean sectional drag coefficient and Strouhal number along the cylinder span for Re = 100. The SD lift coefficient on the smaller cylinder at α = 2 is slightly greater than zero, indicating that this α is the critical rotation rate for vortex shedding. The boundary between the inclined vortex zone and parallel vortex zone can be determined based on the SD lift coefficient variation and St along the cylinder span. In the inclined vortex zone SD lift coefficient and the Strouhal number are smaller than in the parallel shedding zone. However, the mean drag coefficients in the parallel and inclined vortex shedding zones do not have noticeable differences. If the N-cell exists (α = 1), its Strouhal number is smaller than the L-cell's Strouhal numbers, as seen in figure 28.

Figure 28. Variations of the SD sectional lift coefficient, mean sectional drag coefficient and Strouhal number along the cylinder span for Re = 100; (a) SD lift coefficient, (b) mean drag coefficient and (c) Strouhal number.
5. Conclusions
This paper is aimed at investigating the effect of rotation of a step cylinder in uniform flow on the vortex shedding. Three-dimensional numerical simulations are conducted at Reynolds numbers Re = 150 and 100, a diameter ratio d/D = 0.5 and rotation rates α = 0, 0.5, 1, 2, 3 and 4. The simulated rotation rates cover three possible vortex shedding regimes: (i) vortex shedding for both cylinders, (ii) vortex shedding only from the smaller cylinder and (iii) vortex suppressed for both cylinders. The wake patterns of these three vortex shedding regimes are very different from each other. All three regimes are found at Re = 150, but only regimes (i) and (iii) are found at Re = 100. Wake features for Re = 150 and 100 are summarized in §§ 5.1 and 5.2, respectively.
5.1. The case Re = 150
The S-, N- and L-cells in the wake of a non-rotating step cylinder (α = 0) are the same as those reported in previous studies. When the cylinder rotates at α = 0.5 and 1, vortex shedding occurs from both cylinders, but the N-cell at α = 1 is shorter than α = 0 and disappears at α = 0.5. The vortices of the shorter N-cell at α = 1 form C-shaped loop instead of the closed N–N loop as that in α = 0. Without the N-cell at α = 0.5, vortices of the L- and S-cells interact with each other directly at the step position. In addition to the S-, N- and L-cells, an additional cellular zone occurs between N- and L-cells for α = 1 and between S- and L-cells for α = 0.5. The vortices in this cellular zone are divided into many cells with VD between them. The vortex shedding frequency in this cellular zone is smaller than the vortex shedding frequency in the L-cell and greater than the vortex shedding frequency in the N-cell. The cellular zone is much longer than the N-cells.
If the cylinder rotates at α = 2 and 3, vortex shedding is fully suppressed for the larger cylinder but still exists for the smaller cylinder. The wake in these two rotational rates is characterized by a strong streamwise hub vortex downstream of the step surrounded by helical vortices. The helical vortices are formed by the vortices that are shed from the smaller cylinder and roll around the hub vortex. The hub vortex is formed by two mechanisms. One is the stronger biased wake flow on the larger cylinder side than the smaller cylinder side. The other one is the spanwise velocity at the step position pointing to the larger cylinder side, which is caused by a pressure gradient. The helical vortices make the lift coefficient oscillate with high amplitude near the step on the larger cylinder.
When the rotation rate is increased to 4, vortex shedding from both cylinders is fully suppressed but the flow near the step and on the larger cylinder span is characterized by dynamic ring-shaped vortices and finger-shaped vortices. Near the step, the spanwise flow pointing towards the larger cylinder side and the periodic generation of ring-shaped vortices make the pressure on the cylinder surface oscillate with high frequency and high amplitude. As a result, the sectional lift coefficient on the larger cylinder span near the step also oscillates with high frequency and high amplitude.
5.2. The case Re = 100
All the wake features found at Re = 150 are also found at Re = 100 except for two: helical vortices and finger-shaped vortices. At Re = 100, the wake with helical vortices is not found because the vortex shedding is suppressed at the same rotation rate of 2 for both cylinders. The finger-shaped vortices are not observed at Re = 100 and α = 3 or 4 because the flow in the wake of the larger cylinder is two-dimensional. At α = 0, 0.5 and 1, the time required for the flow to develop to stable vortex shedding flow for Re = 100 is much longer than for Re = 150.
Acknowledgements
We would like to acknowledge that the supercomputer computational time was provided by Australian National Computational Infrastructure through the Adapter Allocations Scheme.
Declaration of interests
The authors report no conflict of interest.


