Introduction
The complex annual cycle of migratory birds, as well as the large areas that they occupy throughout the year, render the conservation of these species a particularly difficult challenge (Faaborg et al. Reference Faaborg, Holmes, Anders, Bildstein, Dugger, Gauthreaux, Heglund, Hobson, Jahn, Johnson, Latta, Levey, Marra, Merkord, Nol, Rothstein, Sherry, Sillett and Thompson2010). Events occurring at every stage of the annual cycle, including breeding and non-breeding periods, may limit the abundance of migratory birds and therefore have important effects on population trends (Sherry and Holmes Reference Sherry and Holmes1996, Sillet et al. Reference Sillet, Holmes and Sherry2000, Rockwell et al. Reference Rockwell, Sillett and Bocetti2017, Bayly et al. Reference Bayly, Rosenberg, Easton, Gómez, Carlisle, Ewert, Drake and Goodrich2018). Multiple studies have shown that habitat quality on the wintering grounds can affect survival in subsequent stages of the annual cycle, as well as influence reproductive success (Marra et al. Reference Marra, Hobson and Holmes1998, Norris et al. Reference Norris, Marra, Kyser, Sherry and Ratcliffe2004, Harrison et al. Reference Harrison, Blount, Inger, Norris and Bearhop2011, Rockwell et al. Reference Rockwell, Bocetti and Marra2012, Aharon-Rotman et al. Reference Aharon-Rotman, Bauer and Klaassen2016). Habitat loss in these areas may therefore be contributing to population declines (Taylor and Stutchbury Reference Taylor and Stutchbury2016). Numerous species of Nearctic-Neotropical migratory landbirds are currently experiencing dramatic population declines (Hagan and Johnston Reference Hagan and Johnston1992, Rosenberg et al. Reference Rosenberg, Kennedy, Dettmers, Ford, Reynolds and Alexander2016), the causes of which are likely to be associated with deforestation in both the wintering and breeding grounds (Robbins et al. Reference Robbins, Sauer, Greenberg and Droege1989). Detailed information on the distribution and habitat preferences of migratory birds across all stages of the annual cycle, including non-breeding periods, is therefore essential if we are to design effective management plans (Holmes Reference Holmes2007, Sheehy et al. Reference Sheehy, Taylor, Mccann and Norris2010).
The Canada Warbler Cardellina canadensis is a long distance migratory passerine that has seen a sharp population decline of between 62% and 66% since 1966 (Sauer et al. Reference Sauer, Hines, Pardieck, Ziolkowski and Link2014, Rosenberg et al. Reference Rosenberg, Kennedy, Dettmers, Ford, Reynolds and Alexander2016) and is currently listed as ‘Endangered’ in Canada (COSEWIC 2008). Both loss of forested habitats on its North American breeding grounds and South American wintering grounds have been cited as potential causes of this steady decline (Becker et al. Reference Becker, Bohall and Keyser2012). However, recent analyses derived from long-term monitoring data suggest that landscape changes in the non-breeding grounds might be the main driver of population declines in Canada Warbler (Wilson et al. Reference Wilson, Saracco, Krikun, Flockhart, Godwin and Foster2018).
Canada Warbler breeds mainly in boreal forest along a broad longitudinal range in North America and the core of its winter distribution lies within the Andes of Colombia and Ecuador (Curson et al. Reference Curson, David and Beadle1994). The Colombian Andes host several other species of Nearctic-Neotropical migratory birds during the winter, including three species of conservation concern: Olive-sided Flycatcher Contopus cooperi, Cerulean Warbler Setophaga cerulea and Golden-winged Warbler Vermivora chrysoptera (Davidson et al. Reference Davidson, Fernández, Clay and Wells2011, Colorado et al. Reference Colorado, Hamel, Rodewald and Mehlman2012). Although habitat loss in both the breeding and non-breeding grounds is likely to be affecting populations of these species of concern ( Jones et al. Reference Jones, Barg, Sillett, Veit and Robertson2004, Colorado et al. Reference Colorado, Hamel, Rodewald and Mehlman2012), forest cover across North America has remained relatively stable in recent years (Robbins et al. Reference Robbins, Sauer, Greenberg and Droege1989). In stark contrast, Neotropical forest cover has reduced dramatically (Wassenaar et al. Reference Wassenaar, Gerber, Verburg, Rosales, Ibrahim and Steinfeld2007), especially in densely populated areas like the Colombian Andes (Etter et al. Reference Etter, McAlpine, Wilson, Phinn and Possingham2006, Rodríguez Eraso et al. Reference Rodríguez Eraso, Armenteras-Pascual and Retana Alumbreros2012). In the case of the Canada Warbler, changes in the human footprint between 1993 and 2009 was equivalent to just a 0.11% increase on the breeding grounds, while it was estimated at 14% for the South American wintering grounds (Wilson et al. Reference Wilson, Saracco, Krikun, Flockhart, Godwin and Foster2018). Therefore, prioritising areas for conservation in the Andean wintering grounds is likely to be a fundamental strategy for reversing population declines in species like the Canada Warbler.
While the elevation and habitat use of over-wintering Canada Warbler is reasonably well known from anecdotal evidence, there have been no systematic studies to determine how abundance varies with elevation or habitat. Canada Warbler is reported to inhabit montane habitats during the wintering period, typically between 1,000 and 2,000 m asl (Curson et al. Reference Curson, David and Beadle1994), however, it is not clear if its abundance varies with elevation. A study of migrants on stopover in South America found that density was not uniform across elevations, and that patterns were species specific, likely reflecting different habitat preferences (Gómez et al. Reference Gómez, Gómez-Bahamón, Cárdenas-Ortíz and Bayly2015). Also, evidence from tropical resident birds suggests that species are not only restricted to specific elevation bands but their abundance varies with elevation (Diamond Reference Diamond1973, Jankowski et al. Reference Jankowski, Ciecka, Meyer and Rabenold2009).
The Canada Warbler is known to inhabit Andean forests but will also use agroforestry systems such as shade coffee (Díaz-Bohórquez et al. Reference Díaz-Bohórquez, Bayly, Botero and Gómez2015), and more rarely, open habitats such as silvo-pastures (McDermott and Rodewald Reference McDermott and Rodewald2014). However, considering its preference for habitats with a dense understorey on the breeding grounds (Hallworth et al. Reference Hallworth, Ueland, Anderson, Lambert and Reitsma2008, Flockhart et al. Reference Flockhart, Mitchell, Krikun and Bayne2016), it is possible that the species seeks similar habitats during the winter. In order to effectively prioritise regions, habitats and elevations for conservation, it is essential to first refine our knowledge of habitat preferences and other aspects of the wintering ecology of the Canada Warbler.
In this study, we aimed to fill these critical knowledge gaps by evaluating whether the estimated density of Canada Warbler varies by elevation and habitat (e.g. forest, shade coffee plantations) across its over-wintering range in Colombia. We also describe more specific aspects of the species’ wintering ecology such as its foraging strata and participation in mixed-species flocks. Specifically, we address the following questions: 1) How does the relative density of Canada Warbler vary with elevation in the Colombian Andes? 2) How does the relative density vary across habitats and with fine-scale habitat structure? 3) Which environmental variables influence the relative density at the broad scale of Colombia’s Eastern Andes and to what extent do areas of high predicted density overlap with protected areas? 4) Is there differential use of elevations and habitats by sex? 5) Which vegetation strata do Canada Warbler use most? 6) Is participation in mixed flocks part of the wintering ecology of Canada Warbler? By identifying regions and habitat characteristics that are positively correlated with Canada Warbler abundance, we aim to provide the basis for defining conservation priorities in Colombia and the wider Andes and fuel the development of a non-breeding area management plan.
Methods
Study sites
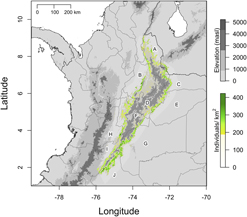
To generate a representative sample of habitat and elevation use in the Colombian Andes, we visited 24 non-random study sites throughout the three Andean ranges (Eastern, Central and Western Andes) and the Sierra Nevada de Santa Marta (Figure 1). Study sites were located on each Andean slope, e.g. both the eastern and western slope of the Eastern Andes and were selected to cover an elevation gradient from 700 to 3,150 m. Beyond elevation, site choice was determined by studying forest cover maps and, more critically, by accessibility. Most of the study sites were located in the Eastern Andes (14 sites), followed by the Western Andes (seven sites), Central Andes (two sites) and Sierra Nevada de Santa Marta (one site). A list of sites, average coordinates and habitats sampled is provided in Table S1 in the online supplementary material.
Figure 1. Distribution of 24 study sites where point counts were undertaken in the three Andean ranges and the Sierra Nevada de Santa Marta of Colombia.
Sampling protocols
Passive point counts
Points (819 in total) were distributed across study sites with stratification by elevation and habitat, in order to cover five major habitat categories (see below) and to have a minimum of 25 points in each of 10 elevations bands (250 m) spanning the gradient from 750 m to 3,250 (Figure S1). Eight points were located below 750 m and only 10 points were located in the 2750–3,000 m band.
At each point, 5-minute counts were carried out between 1 December and 15 March, thereby avoiding the migration periods of this species in Colombia (September–November and April–May), during four successive non-breeding periods between 2012 and 2016. The majority of points were surveyed in two non-breeding periods, 2014/2015 and 2015/2016 (42% and 51% respectively). The number of points per site varied from one to 144, depending on the area of habitat available and access routes. All points were separated by approximately 100 m (minimum of 75 m) and were surveyed between 06h00 and 10h30 EST. We never detected birds further than 50 m from the observer and the majority of detections were within a 25 m radius (85%), implying that a distance of 100 m likely assured independence between points. Canada Warblers were not highly mobile either (NB pers. obs.), such that detecting the same individual at two consecutive points was considered highly unlikely. Canada Warblers were detected by visual (24%) and auditory cues (76%) and for each individual the following information was recorded: horizontal distance to the nearest meter (m) from centre of point (estimated by observer with occasional verification through pacing); vertical distance above the ground to the nearest meter (m); participation or not in mixed-species flocks, where a mixed-flock was defined as a group of two or more species moving together in a consistent direction (Colorado and Rodewald Reference Colorado and Rodewald2015). For all points in 2016, we recorded whether a mixed flock was present or not, using the same definition as above. The sex of Canada Warbler was determined where possible based on the extent of black on the forehead and black spotting on the breast (Pyle Reference Pyle1997). When birds were only heard during points, playback was occasionally used once the point was completed to draw birds within view and determine their sex.
All point counts were carried out by one of three observers, Nicholas Bayly, Laura Céspedes and Camila Gómez, having standardised distance estimation and the ability to identify Canada Warbler by their “chip” call. Observers had extensive experience identifying other migratory birds by sight and sound, as well as common resident species in the study sites, which was necessary to describe mixed flocks in point counts. The “chip” call of Canada Warblers, emited frequently by over-wintering birds, is characterised as a sharp ‘shik’ (Curson et al. Reference Curson, David and Beadle1994) with a descending frequency. It was readily recognisable from the vocalizations of other migratory warblers common in our study sites (Blackburnian Warbler Setophaga fusca, American Redstart S. ruticilla, Black-and-white Warbler Mniotilta varia, Tennessee Warbler Leiothlypis peregrina). Prior to conducting point counts, observers received training in the estimation of horizontal distances by comparing them to distances measured in paces. For both vertical and horizontal distances, observers compared and constrasted estimations to facilitate their standardisation.
Elevation and habitat variables
At each point, we recorded the exact location to within 5 m using a GPS unit. Coordinates were later entered into Geoplaner 2.7 (www.geoplaner.com) to determine the elevation of each point. Nonetheless, elevation values given by the GPS and Geoplaner were highly consistent. For each point visited between January 2015 and March 2016, we visually estimated canopy height (m) and % canopy cover, determined by estimating the percentage cover of the field of view of an inverted 8 x 42 binocular (James and Shugart Reference James and Shugart1970). We also assigned each point to one of five habitat categories: mature forest (canopy height > 15 m); secondary forest (canopy height < 15 m); forest edges (includes forest edges with shade coffee and pastures and gallery forest); shade-grown coffee; and sun coffee. Between 700 and 2,250 m we define mature forest as having a canopy height > 15 m and secondary forest as having canopy height < 15 m. Above 2,250 m, assignment was more subjective, as above this elevation elfin or dwarf forest is common and mature stands rarely exceed 15 m in height. The habitats sampled are the most representative habitats within the Colombian Andes but did not include cattle pastures, a predominant land use type where Canada Warbler was not expected, due to near or complete absence of trees.
Data analysis
Relative density of Canada Warbler across habitats and elevations
To asses if abundance of Canada Warbler is predicted by elevation and habitat, we used distance sampling to adjust for detectability (Rosenstock et al. Reference Rosenstock, Anderson, Giesen, Leukering and Carter2002, Thompson Reference Thompson2002). We performed the analyses using multiple functions implemented in the ‘unmarked’ package (Fiske and Chandler Reference Fiske and Chandler2011) for R programming environment (R Development Team 2008). To calculate detectability functions, horizontal distances of birds from observers were grouped in eight distance bands of 5 m (0–40 m). Point counts from sun coffee (n = 17) and the Sierra Nevada de Santa Marta (n = 19) were excluded from these analyses, since no Canada Warblers were detected in this habitat or region. Histograms of detection distances are provided in Figure S2. Because the data did not perfectly meet the assumption that detection probability decrease with distance (we had few detections at distances less than 5 m; Figure S2), we prefer to be conservative and interpret predicted values as relative density.
We employed two scales of analysis to evaluate variables that potentially affect the relative density of Canada Warbler across space. At a broad scale, we used elevation and habitat type at individual points in combination with Andean range as covariates in models, including point counts from all localities. At the finer habitat scale, we entered combinations of canopy height, canopy cover and elevation at individual points into models, and only included point counts from localities that corresponded to forest in the Eastern Andes with complete habitat data, as this was the most comprehensively sampled area and habitat (n = 515 point counts). For all analyses, including those in the following section, model selection was based on Akaike Information Criterion (AIC) and suitability of top models was assessed through a chi-square goodness of fit test on 1,000 simulations using the parboot function of ‘unmarked’. We obtained the 95% confidence intervals for parameter estimates of top models using the confint function of ‘unmarked’. When top models had a difference in AIC less than two, we obtained model-averaged predicted densities using the functions fitList and predict. If there were no competing models we made predictions based on the top model.
We fitted multiple models, including several combinations of the variables using the function distsamp implemented in ‘unmarked’ (Fiske and Chandler Reference Fiske and Chandler2011). We standardised all continuous variables prior to fitting models by subtracting the mean and dividing by the standard deviation. When including elevation, we evaluated models that described a linear, quadratic (i.e. unimodal) and polynomial relationship with relative density. To evaluate if hour of day (Lynch Reference Lynch, Ralph, Sauer and Droege1995) or observer influenced detectability, we included models that accounted for an effect of these variables on detectability in preliminary analyses. However, there was no support for including detectability effects in the final model set.
To examine whether males and females used habitats or elevations differently, we ran a set of logistic regressions including elevation, habitat type, canopy height and canopy cover as predictors (n = 77 detections for which sex was confidently determined).
Relative density across the Eastern Andes
To determine how the relative density of Canada Warbler varied at the scale of the Eastern Andes, where sampling cover was highest, and identify potentially important regions for conservation, we determined how density varied with broad- scale environmental variables. To do so, we extracted values for each point count (n = 671 point counts) from the following raster layers: aboveground forest biomass (resolution 30 m for the year 2000; Baccini et al. Reference Baccini, Walker, Carvahlo, Farina, Sulla-Menashe and Houghton2015); cloud cover (resolution 1 km; Wilson and Jetz Reference Wilson and Jetz2016), and precipitation (resolution 1 km; Hijmans et al. Reference Hijmans, Cameron, Parra, Jones and Jarvis2005). We used above-ground forest biomass instead of tree cover, as it reflects the relative maturity of a forest in a continuous manner, increasing as tree height, volume and vegetation complexity increase. For precipitation we generated two layers from monthly WorldClim 1.4 precipitation data (Hijmans et al. Reference Hijmans, Cameron, Parra, Jones and Jarvis2005): 1) annual precipitation (mean annual precipitation) and 2) winter precipitation (mean precipitation from November through March). It is important to note that cloud cover in the tropical Andes is correlated with precipitation and humidity (Wilson and Jetz Reference Wilson and Jetz2016). Variables related to precipitation were included because preliminary observations suggested that Canada Warblers were more commonly found in humid forest across the Colombian Andes, or at least were not associated with dry forest. Therefore, we hypothesised that precipitation and humidity could affect the density of Canada Warbler. Likewise, preliminary observations suggested that Canada Warbler could be more abundant in mature forest, which lead us to include a variable related to tree density at the extent of the Eastern Andes. Having extracted corresponding values from raster layers using the ‘raster’ package for R (Hijmans and van Etten Reference Hijmans and van Etten2012), we created a model set to test the effect of each environmental variable, as well as elevation, using ‘unmarked’ (Fiske and Chandler Reference Fiske and Chandler2011). We used the best fit model to generate spatial abundance predictions for the extent of the Eastern Andes, bearing in mind that absolute values of predicted density for this analysis should not be taken at face value and are best treated as a relative measure of abundance.
We also evaluated to what extent areas with high predicted densities in the Eastern Andes overlapped with protected areas in Colombia. First, we created a raster containing only those areas with a density value above the median value for predicted densities. The raster was then converted to a polygon and crossed with polygons for national and regional protected areas (includes Parques Nacionales Naturales; Reservas Forestales Protectoras Nacionales; Parques Naturales Regionales; Reservas Forestales Protectoras Regionales; http://www.siac.gov.co/catalogo-de-mapas ) to obtain an area estimate of the intersection of the two. We used functions implemented in the packages ‘rgdal’ (Bivand et al. Reference Bivand, Keitt and Rowlingson2017), ‘raster’ (Hijmans and van Etten Reference Hijmans and van Etten2012) and ‘rgeos’ (Bivand and Rundel Reference Bivand and Rundel2017).
Vegetation strata and association with mixed flocks
To describe the vegetation strata used by foraging Canada Warbler, we took the values of distance from the ground (n = 37) recorded at points with visual detections and the corresponding value of canopy height for each point. We calculated a ratio (distance above the ground/canopy height) to account for any effects of canopy height on vegetation strata use.
To determine if association with mixed-species flocks was an important aspect of the wintering ecology of Canada Warbler, we calculated the percentage of birds detected in flocks. As the frequency of flocks may vary between habitats and elevations, which may in turn affect whether birds associated with flocks or not, we undertook a logistic regression where absence/presence in a flock was coded as 0 or 1. We then designed a model set to test whether either habitat, elevation or the abundance of flocks at a given elevation (% of points with flocks within 250 m elevation bands) influenced the probability of flock use. The model set included models containing each variable and various combinations (additive) of all three variables.
Results
In 819 point counts we detected 161 Canada Warblers at 148 points (∼ 18% of points), 70 of which were visual detections (∼ 43%). All individuals were detected between 793 and 2,305 m in the Western, Central and Eastern Andes. No individuals were detected in the Sierra Nevada de Santa Marta in 19 point-counts.
Relative density of Canada Warbler across habitats and elevations
We found that both habitat type and elevation predicted the relative density of Canada Warblers in the Colombian Andes, based on support for four competing models containing both variables (Table 1, Table S2), with the top model including habitat and a quadratic relationship with elevation. The next best model contained the variable Andean range, which predicted higher densities in the Eastern Andes, followed by the Western and finally the Central Andes, although the 95% CI for estimates revealed that our data does not support differences between mountain ranges (Table S2). The third and fourth best models predicted a polynomial relationship of relative density with elevation (Table 1). All four competing models had good fit according to a chi-square goodness of fit test (P = 0.88, P = 0.89, P = 0.87, P = 0.48 respectively). According to the model-averaged predictions, relative density showed a unimodal relationship with elevation (Figure 2A), peaking around 1,500 m. While the model predicted an approximately normal distribution, the raw data suggest that abundance may be more uniform between 1,000 and 2,250 m, dropping off abruptly either side (Figure 2B). Densities were also predicted to be higher in mature forest relative to other habitats (Figure 3), despite relatively high standard errors for predicted values (Figure 3; Table S2). Using the global data set we found no evidence of differential use of habitats and elevations by sex, with the null model having the lowest AIC value (Table S3).
Table 1. Model set to describe how the density of over-wintering Canada Warbler varies throughout the Andes of Colombia with elevation and habitat. Models are ordered from highest to lowest based on Akaike weights (w i). The top four models were averaged to obtain predicted densities.
Figure 2. Relative density of Canada Warblers in forest peaked at intermediate elevations (around 1,500 m asl). A) Predicted densities across elevations obtained after averaging the four top models, two describing a quadratic and two a polynomial relationship with elevation. Dotted lines represent the standard error of predicted values (±SE). Predictions were made for mature forest in the Eastern Andes B) Percentage of points in mature forest at which Canada Warblers were detected by elevation band.
Figure 3. Mature forest held the highest relative density of Canada Warblers in contrast to secondary growth, forest edges, and shade coffee. Error bars denote standard error of predicted values (± SE). Predictions were made for the Eastern Andes and keeping elevation constant at the mean.
At a fine scale, data from the Eastern Andes provided support for a positive effect of canopy height on the relative density of warblers (Figure 4, Table 2, Table S4). There was also weak support for an effect of canopy cover on relative density (Table 2, Table S4). The top two models (ΔAIC < 2) had good fit according to a chi-square goodness of fit test (P = 0.78, P = 0.698 respectively).

Figure 4. Relative density of Canada Warbler is higher in mature forest with a higher canopy. Predictions were obtained after averaging two models, one including elevation and canopy height as predictors and other that also included canopy cover. For predictions, elevation and canopy cover were kept constant at the mean. Dotted lines represent the standard error of predicted values (± SE).
Table 2. Model set to describe how Canada Warbler density in Andean forests in Colombia varies with fine-scale habitat variables. Models are ordered from highest to lowest based on Akaike weights (w i). The top two models were averaged to obtain predicted densities.
Relative density and distribution of Canada Warbler across the Eastern Andes
Elevation, forest biomass and cloud cover best explained the spatial variation in the relative density of Canada Warbler at the scale of the Eastern Andes (Table S5, P = 0.926 for chi-square goodness of fit test). Elevation, following the results for the global dataset, had a quadratic relationship with relative density, while above-ground forest biomass and cloud cover had a positive linear relationship (Table S6). The projection of these results (Figure 5), depicts a distribution along the length of the Eastern Andes, with higher densities occurring at mid elevations and where precipitation (cloud cover) and forest cover were high (Figure 5, Figure S3). Absence or low densities were predicted above 2,500 m at the centre of the mountain range (Figure 5). The highest spatially continuous predicted densities occurred on the eastern slope in the departments of Meta and Caquetá (Figure 5, G and J respectively) and the north-eastern portion of the eastern slope in Arauca (Figure 5, C).
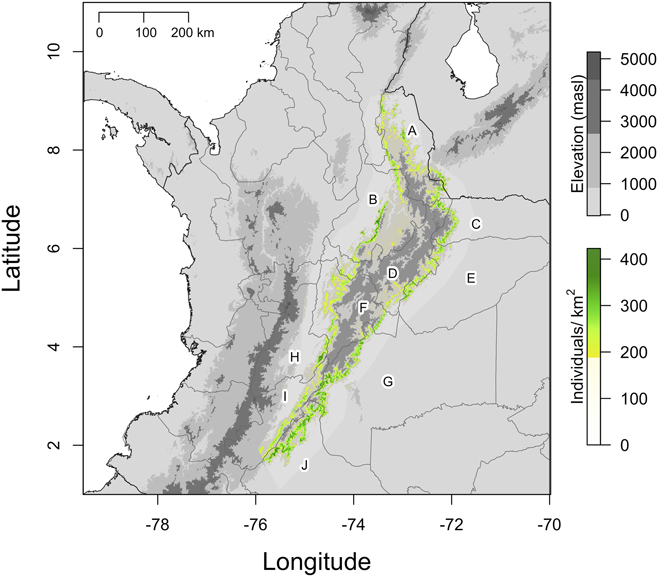
Figure 5. Predicted relative density of Canada Warblers in the Eastern Andes based on a model containing the variables: elevation; aboveground forest biomass; and cloud cover. Predicted densities, denoted by the colour scale, peak at intermediate elevations in areas with high cloud cover and low deforestation (green). The lower half of the density colour scale corresponds to transparent colours. Political divisions in grey correspond to the Colombian departments: Norte de Santander (A), Santander (B), Arauca (C), Boyacá (D), Casanare (E), Cundinamarca (F), Meta (G), Tolima (H), Huila (I) and Caquetá (J). The grey scale denotes elevation and national borders are depicted with a black line.
Areas with high relative densities of Canada Warbler in the Eastern Andes overlapped by 14% with protected areas (Figure S4). National Natural Parks accounted for 99.5% of overlap (∼ 2,000 km2), with the following parks containing the largest areas of predicted high relative density (from north to south): Parque Nacional Natural (PNN) Catatumbo-Barí, PNN Tamá, PNN Serranía de los Yariguies, PNN El Cocuy, PNN Chingaza, PNN Sumapáz and PNN Cordillera de los Picachos (Figure S4)
Vegetation strata and association with mixed flocks
On average, Canada Warblers used mid-strata in Andean forests during the wintering period (x = 7.6 m, SD = 3.6, n = 64, Figure 6A). Taking into account canopy height, the majority of birds used vegetation strata in the lower ∼ 50% of the available range (x = 0.38, SD = 0.18; Figure 6B).
Figure 6. A) Foraging height of Canada Warblers (grey bars) spanned from 1 to 16 m above the ground in Andean forests, with 64% of birds occurring at mid-levels between 5 and 10 m. Canopy height (cross-hatched bars) at points where we recorded Canada Warblers was always >12 m. Dashed vertical lines depict the mean of each distribution B) Density plot showing that Canada Warbler occupied mid to lower vegetation strata in Andean forests relative to canopy height. The dashed vertical line depicts the mean of the distribution.
Of 144 individuals for which information on presence/absence in mixed flocks was recorded, 30 individuals (∼ 21%) participated in mixed-species flocks. Logistic regression models revealed a strong effect of elevation but not habitat on the probability of being in a mixed-species flock, with birds being more likely to participate in flocks at higher elevations (> 2,000 m; Figure 7).
Figure 7. The probability of over-wintering Canada Warbler participating in mixed species flocks increased at higher elevations in the Colombian Andes. The percentage of points with flocks within altitudinal bands of 250 m did not explain this relationship, with the percentage being similar between elevations (mean, flocks present at 17.2% of points)
Discussion
Canada Warbler relative density in the Andes of Colombia was higher at mid-elevations (1,000–2,000 m) and increased with canopy height in montane forests. Densities were predicted to be highest in mature forest, relative to shade coffee, forest edges and secondary growth and no birds were detected in sun coffee (Figure S5). Birds generally foraged within the lower and middle strata of the forest, which are rarely well developed in secondary forests or agroforestry systems. At a broad scale, relative density increased with cloud cover, which is correlated with precipitation, and forest biomass. By increasing our understanding of the over-winter ecology of the Canada Warbler, we hope these results will make a significant contribution to the development and design of conservation plans and actions for this sharply declining migrant, especially given the disproportionate contribution of habitat loss on the wintering grounds to demographic change over the last 50 years (Wilson et al. Reference Wilson, Saracco, Krikun, Flockhart, Godwin and Foster2018).
Relative density of Canada Warblers: Importance of elevation, habitat and environmental conditions
Elevation had an important influence on Canada Warbler presence and relative density in this study, similar to findings for other migratory birds at a stopover site in northern Colombia (Gómez et al. Reference Gómez, Gómez-Bahamón, Cárdenas-Ortíz and Bayly2015). We recorded over-wintering Canada Warblers in Andean forests between 750 and 2,300 m with relative densities being highest between 1,000 and 2,000 m Although predictions suggest a humped density distribution as depicted in Figure 2A, an alternative plausible scenario is that densities may be more uniform between 1,000 and 2,250 m, dropping off abruptly above and below these elevations (Figure 2B). To our knowledge, this is the first evaluation of how density of an over-wintering migratory bird varies across the slope of the Andes. Despite occurring across a relatively broad elevation range, this range overlaps with the steep slopes of the Andes and covers a relatively small area compared to higher elevations (see Fig. 5), at least at the extent of the Eastern Andes. The restricted area with high predicted relative density along a thin elevation band is qualitatively different from past depictions of the species’ over-wintering distribution, which showed the it occupying a vast area covering the entirety of the Andes of northern South America (IUCN 2017). These findings reflect those for other South American wintering species whose non-breeding distribution have been evaluated and found to be smaller than previous estimates (Remsen Reference Remsen2001, Colorado et al. Reference Colorado, Hamel, Rodewald and Mehlman2012), highlighting the need for rigorous evaluations of spatial variation in abundance of Neotropical migratory birds.
Densities of Canada Warbler over-wintering in the Andes of Colombia were higher in mature forest stands versus secondary forest and shade-coffee plantations, and no birds were detected in sun coffee in 17 point-counts. Although agroforestry systems such as shade coffee might be good quality habitat for many migratory birds (Tejeda-Cruz and Sutherland Reference Tejeda-Cruz and Sutherland2004, Komar Reference Komar2006, Bakermans et al. Reference Bakermans, Vitz, Rodewald and Rengifo2009, McDermott and Rodewald Reference McDermott and Rodewald2014), our results suggest that their role in the maintenance of Canada Warbler populations is unclear and likely dependent on shade structure and composition (see below). Density has been found to be an indicator of habitat quality in a number of over-wintering migratory birds, including the closely related Wilson’s Warbler Cardellina pusilla (Ruiz-Sanchez et al. Reference Ruiz-Sanchez, Renton and Rueda-Hernández2017) and the American Redstart (Johnson et al. Reference Johnson, Sherry, Holmes and Marra2006). If this is also true of Canada Warbler, then mature forest would appear to be of higher quality than shade coffee; that said, densities in the latter suggest they may play a significant role in providing over-wintering habitat for Canada Warblers. Given these findings, conservation of both mature forests and agroforestry systems, between 1,000 and 2,250 m, should be essential elements of strategies aimed at conserving Canada Warbler.
Relative density of Canada Warblers increased with increasing canopy height, a surrogate for maturity, a finding that is qualitatively similar to those for habitat choice on the breeding grounds, where occupancy rates are higher in mature forest stands (Grinde and Niemi Reference Grinde and Niemi2016) or in harvested areas that retain tall emergent trees (Hallworth et al. Reference Hallworth, Ueland, Anderson, Lambert and Reitsma2008, Reitsma et al. Reference Reitsma, Hallworth and Benham2008). Given that the Colombian Andes had lost 69% of their original forest cover by 1998 (Etter et al. Reference Etter, McAlpine, Wilson, Phinn and Possingham2006) and that sub-Andean montane forest within the elevation range occupied by Canada Warblers is one of the most fragmented Andean ecosystems (Armenteras et al. Reference Armenteras, Gast and Villareal2003), it is reasonable to hypothesise that continued deforestation is contributing to observed population declines (Sauer et al. Reference Sauer, Hines, Pardieck, Ziolkowski and Link2014). These sub-Andean forests are also habitat for other Nearctic-Neotropical migratory birds of conservation concern (e.g. Olive-sided Flycatcher, Cerulean Warbler, Golden-winged Warbler; Davidson et al. Reference Davidson, Fernández, Clay and Wells2011, Colorado et al. Reference Colorado, Hamel, Rodewald and Mehlman2012) and several threatened range-restricted/endemic species such as the Turquoise Dacnis (Dacnis hartlaubi; ‘Vulnerable’), Black Inca (Coeligena prunellei; ‘Vulnerable’), and Tolima Dove (Leptotila conoveri; ‘Endangered’).
If the relationship between canopy height and relative density holds true for shade-coffee plantations, it would imply that shade coffee plantations with mature trees may provide higher quality habitat than those with a managed shade, where canopy height is controlled or defined by the tree species that provide shade (pers. obs; see Figure S5). The importance of mid-strata for foraging (see below) also has implications for how shade management in agroforestry systems could benefit the Canada Warbler. It suggests that the presence of trees of differing height/maturity and trees providing foraging stratum at mid-levels could increase populations in shade-coffee and other systems.
At the scale of the Eastern Andes, the relative density of Canada Warbler was positively affected by cloud cover and above-ground forest biomass. This provides further evidence for the association of Canada Warblers with mature forest with dense tree cover and implies that densities were higher in more humid forests (higher cloud cover is correlated with higher precipitation and humidity; Wilson and Jetz Reference Wilson and Jetz2016). Although we did not sample the southern extent of the Eastern Andes, the pre-montane forests on the eastern slope of this range (Meta and Caquetá departments) stand out as having very high predicted densities (Figure 5). Future surveys in this area will allow validation of these predictions. Other areas with high predicted density in the Eastern Andes coincide with regions of high precipitation and low rates of deforestation (Etter et al. Reference Etter, McAlpine, Wilson, Phinn and Possingham2006) (Figure S3). Although spatially predicted densities should not be taken at face value, our predictions provide a clear overview of how the abundance of Canada Warbler is markedly heterogeneous, at least at the extent of the Eastern Andes, and highlights areas of interest for future surveys (see below).
Fine-scale habitat use and association with mixed-species flocks
Canada Warblers foraged in the mid-strata of the forest, occupying the area equivalent to 25–50% of the total canopy height. It is important to note that most Canada Warblers foraged between 5 and 10 m above the ground (Figure 6), which does not represent the forest understorey (0–3 m) but an intermediate layer. The preference of Canada Warbler for middle and low forest strata has been reported from the breeding grounds (Hallworth et al. Reference Hallworth, Ueland, Anderson, Lambert and Reitsma2008). This intermediate layer is rarely well developed in secondary forests, which may explain why higher densities occur in more mature forests. The preferred foraging stratum used by the Canada Warbler could also be related to lower densities in shade coffee, where middle strata bird species tend to be less abundant than in forest, in contrast to canopy specialists (Tejeda-Cruz and Sutherland Reference Tejeda-Cruz and Sutherland2004). In order to provide good quality Canada Warbler habitat, management of shade coffee should focus on maintaining high structural complexity and a well-developed mid-stratum.
Association with mixed flocks appears to be an important aspect of the non-breeding ecology of some Canada Warblers, a behaviour common among Neotropical residents and other migratory species (Hutto Reference Hutto1987, Pomara et al. Reference Pomara, Cooper and Petit2003, McDermott and Rodewald Reference McDermott and Rodewald2014, Colorado and Rodewald Reference Colorado and Rodewald2015). However, participation in mixed flocks appears to be dependent on elevation, being more likely in the upper reaches of the species’ altitudinal distribution (1,900–2,250 m). At lower elevations, individuals were more likely to be solitary and based on qualitative observations we hypothesise that they may be more territorial. Why territoriality and flocking behaviour varies with elevation is not clear and deserves further study but may be related to vegetation structure and food availability. Research on other Neotropical migrants, such as the Cerulean Warbler, have shown that flocking behaviour may limit species densities in agricultural landscapes where mixed-species flocks are smaller and less diverse (Jones et al. Reference Jones, Perazzi, Carruthers and Raleigh2000, McDermott and Rodewald Reference McDermott and Rodewald2014). Understanding the interplay between mixed flocking behaviour, density and habitat quality will likely constitute an important contribution for delimiting priority conservation areas for the Canada Warbler.
Conservation of over-wintering habitat
This study provides essential information for the design of conservation measures for Canada Warbler on their over-wintering grounds. According to our results, efforts should be focused on conserving humid montane forests along a thin elevation band between 1,000 and 2,250 m, while simultaneously promoting the retention of diverse and mature shade trees in agroforestry systems. Taking into account elevation, above-ground forest biomass and cloud cover/precipitation at the scale of the Eastern Andes, a number of regions are predicted to have uniformly high densities of Canada Warbler and protective measures there would likely safeguard important wintering populations. It is noteworthy that populations on the eastern slope of the Eastern Andes are connected with some of the more vulnerable breeding populations experiencing sharp declines in North America (González-Prieto et al. Reference González-Prieto, Bayly, Colorado and Hobson2017), including those in the north-eastern United States and eastern Canada (Sauer et al. Reference Sauer, Hines, Pardieck, Ziolkowski and Link2014). Undertaking more point counts in the Western and Central Andes would not only allow for a more rigorous assessment of variation in relative density among Andean ranges but also facilitate the determination of priority areas across Colombia.
Based on our spatial prediction, ∼ 14% of “high quality” Canada Warbler habitat in the Eastern Andes is already under some form of protection. The majority of protected habitat lies on the eastern slope of the Eastern Andes, while much of the western slope lacks protection or extensive areas of forest (Figures S3, S4). Despite reasonable representation in protected areas, a number of regions are notable for the absence of protective measures. At the southern extent of the Eastern Andes (Figure 5, departments J & G), large areas of high relative density Canada Warbler habitat exist primarily in the department of Caquetá (J), an area considered a conservation priority (Armenteras et al. Reference Armenteras, Gast and Villareal2003) but also subject to the highest current and projected deforestation rates in Colombia (González et al. Reference González, Etter, Sarmiento, Orrego, Ramírez, Cabrera, Vargas, Galindo, García and Ordoñez2011). In contrast, a similar region at the north-eastern extent of the eastern slope is largely protected by the PNN El Cocuy (Figure 4, Figure S3). Between these two regions, much of the eastern slope in the departments of Boyacá and Casanare lacks protection and alongside areas in Caquetá would benefit from initiatives to create new protected areas. On the western slope, the most important protected area is the PNN Serranía de los Yariguíes (Figure S4) but outside of this park, extensive areas with high predicted densities in the departments of Norte de Santander, Santander, Cundinamarca and Tolima lack protection (Figure 5, B). The western slope in general has undergone more extensive conversion to agriculture (Armenteras et al. Reference Armenteras, Gast and Villareal2003) and here a combination of reforestation, regeneration, restoration and agroforestry projects could prevent near total habitat loss.
Whether actions should focus on the protection and restoration of Andean forests or on using market-based solutions through agroforestry systems such as shade-coffee is unclear. Clearly relative densities are higher in mature forests and the relative quality of shade coffee for this species has yet to be determined, although the relationship with canopy height likely has important implications for shade management in coffee plantations. Consequently, in the near-term, protecting mature humid forest at intermediate elevations in the Andes is a viable strategy that can be combined with efforts to conserve watersheds, reduce erosion and minimize carbon dioxide emissions (Asquith et al. Reference Asquith, Vargas and Wunder2008).
Supplementary Material
To view supplementary material for this article, please visit https://doi.org/10.1017/S0959270918000229
Acknowledgements
We are extremely grateful to all the landowners who allowed us access to their properties, with special thanks to the owners of Hacienda “La Fragua” and farms “Villa Gloria”, “El Diamante”, “Villa María”, “Puerto López”, “La Bonanza” and “El Quininí” in the Eastern Andes, and Claudia and Mickey Weber of the Hacienda La Victoria in the Sierra Nevada de Santa Marta. We also extend a special thanks to Eibar Agarra (Santa María), Angel Arturo Ciro (Santa María), Gustavo Londoño (Chicoral), Mauricio Torres (Reserva Bomarea), Luisa Victoria Jamarillo (San José de Suaita), Hacienda El Roble, and Roberto Saenz (Pedro Palo) for their assistance in visiting the different sites. We thank Camila Gómez for assisting data collection. We thank Richard Chandler, Daniel Linden and Jeffrey Royle for important advice and help on distance sampling analyses, and Keith Hobson and Camila Gómez for constructive comments on the manuscript. Two anonymous reviewers provided detailed comments that greatly improved this manuscript. This is contribution No. 3 of the project “The non-breeding season ecology and migratory connectivity of the Canada Warbler in Colombia” led by SELVA. Fieldwork was funded by Environment and Climate Change Canada through an operating grant to Keith A. Hobson (K4E21-14-0-524) and we give special thanks to the latter for supporting SELVA’s work in Colombia. Data analysis and manuscript production was carried out as a voluntary project by the authors. Funders had no input into the content of the manuscript and their approval was not required prior to submission or publication.