


1. Introduction
Colon cancer is the most common malignant tumor in the gastrointestinal tract and ranks third and second in terms of morbidity and mortality, respectively, among all solid cancers [Reference Siegel, Miller, Fuchs and Jemal1–Reference Gurba, Taciak, Sacharczuk, Mlynarczuk-Bialy, Bujalska-Zadrozny and Fichna3]. Approximately 80–90% of colon cancers are colon adenocarcinomas (COADs) based on pathologic classification [Reference Barresi, Reggiani Bonetti, Ieni, Caruso and Tuccari4, Reference Nakamura, Seishima and Emoto5]. In China, due to the increase in poor living and dietary habits, the incidence rate of COAD has also been increasing [Reference Xia, Dong and Li6]. More than 83% of patients with COAD are at an advanced stage upon diagnosis, and nearly half of them are accompanied by metastasis from other sites and have a poor prognosis [Reference Loree and Kopetz7]. Surgical treatment is the most effective treatment for COAD; however, the effect of surgical resection is closely related to the preoperative staging of patients [Reference Akinkuotu, Maduekwe and Hayes-Jordan8, Reference Lo, Caturegli and Stem9]. Thus, further studies on the molecular mechanism of COAD occurrence and development and exploration of new key molecules may provide novel ideas for the treatment of COAD.
MicroRNAs (miRNAs) are non-coding RNAs 20–24 nt long and regulate target gene expression by binding to the 3′ untranslated region of the target gene, which affects a series of physiological processes [Reference Lu and Rothenberg10]. Studies have revealed that miRNAs are involved in almost all signaling pathway regulations in cancer and that there are differences in tumor diagnosis, staging, progression, prognosis, and chemotherapy [Reference Ali Syeda, Langden, Munkhzul, Lee and Song11–Reference Kim and Croce13]. Uncontrolled proliferation is a major feature of cancer and is the basis of its development [Reference Hausman14]. As regulators, miRNAs affect tumor growth by targeting key members of the COAD-related proliferation signaling pathway [Reference Xu, Kuang, Wang, Han and Yang15]. The expression of many miRNAs is different between normal and COAD tissues. For instance, Mi et al. revealed that high miR-31-5p expression facilitated COAD progression by targeting TNS1 [Reference Mi, Li, Li, Liu and Sai16]. Zhao and Qin found that miRNA-708, which targets ZNF549, regulates COAD development through the PI3K/AKt pathway [Reference Zhao and Qin17]. Liu and Di Wang revealed that miR-150-5p inhibits TP53 to facilitate the proliferation of COAD [Reference Liu and Di Wang18]. Therefore, screening for novel miRNAs in COAD is important.
Therefore, this study was conducted to explore the key miRNAs correlated with the development of COAD as well as the molecular mechanisms involved. First, the common differentially expressed (DE) miRNAs were screened between COAD and adjacent cancer samples based on the Gene Expression Omnibus (GEO) and the Cancer Genome Atlas (TCGA) datasets. In addition, miRNAs of interest were verified using quantitative reverse transcription polymerase chain reaction (qRT-PCR), and hsa-miR-135b-5p was screened. Moreover, the effects of hsa-miR-135b-5p on the biological behavior of COAD cells were observed, and transcriptome sequencing was performed to identify target genes of hsa-miR-135b-5p. This study provides new clues for the treatment of COAD. A flowchart of the study is presented in Figure 1.
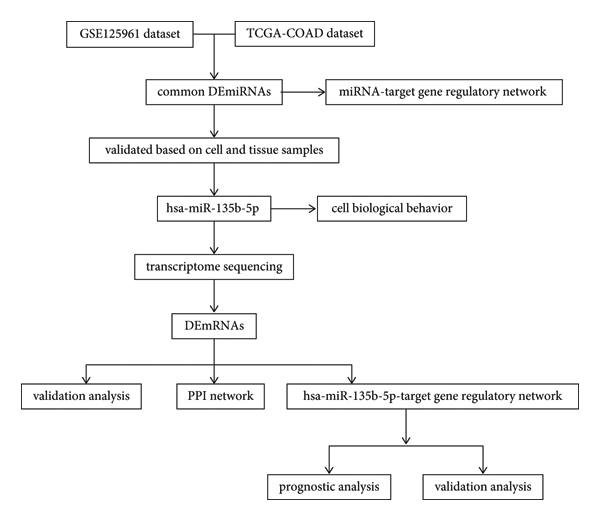
FIGURE 1: Flowchart of this study.
2. Materials and Methods
2.1. Data Acquisition and Preprocessing
The processed miRNA expression profile data of the GSE125961 dataset (six COAD tissues and six adjacent cancer tissues) were downloaded from the GEO database (https://www.ncbi.nlm.nih.gov/geo/), after which the miRNA data were normalized. TCGA-COAD miRNA data (450 COAD samples and eight adjacent cancer samples) were also obtained from the University of California, Santa Cruz, database (https://xenabrowser.net/datapages/), and the miRNAID was converted to the mature miRNA ID of the V21 version.
2.2. Identification of DEmiRNAs
After data preprocessing, DEmiRNAs were identified between COAD and adjacent cancer samples using the “limma” package (version 3.10.3) [Reference Smyth19], with the threshold set at P < 0.05 and |log fold change (FC)| > 2. Moreover, overlapping DEmiRNAs screened from the GEO and TCGA datasets were obtained.
2.3. miRNA-Target Gene Regulatory Network Construction
miRWalk3.0 [Reference Dweep and Gretz20] was used to predict the target genes of the overlapping DEmiRNAs in the miRTarBase, TargetScan, and miRDB databases. The target genes in all three databases were then obtained to build a miRNA-target gene regulatory network using Cytoscape (version 3.2.0) [Reference Shannon, Markiel and Ozier21].
2.4. Sample Collection
The 20 COAD and corresponding paracancerous tissues (including seven females and 13 males aged 46–78 years) were obtained from the China-Japan Union Hospital of Jilin University. This study was approved by the ethics committee of the China-Japan Union Hospital of Jilin University (N:2021081011). Informed consent was obtained from all subjects.
2.5. Cell Culture and Transfection
Human COAD cell lines (SW480, HT29, and HCT116) and a human colon epithelial cell line (NCM460) were purchased from Procell Life Science & Technology Co. NCM460 cells were cultured in 90% Dulbecco’s Modified Eagle Medium: F12; SW480 cells were cultured in 90% L-15 base medium; and HT29 and HCT116 cells were cultured in 90%McCOY’s 5 A base medium. The cells were supplemented with 10% fetal bovine serum and 1% penicillin-streptomycin solution at 37°C in 95% air and 5% CO2, which was then replaced with a complete medium, and the cells were cultured for 24–48 h. The cells were then transfected with hsa-miR-135b-5p inhibitors or a negative control using Lipofectamine 2000 following the manufacturer’s instructions (incubation at room temperature for 20 min).
2.6. qRT-PCR
Total RNA was extracted using TRIzol, and RNA concentration and quality were determined using a microplate reader (Infinite M100 PRO; TECAN, Switzerland). Total RNA was reverse-transcribed using a reverse transcription kit (MR101-01; Vazyme Biotech Co., Ltd., China), and the cDNA was used for qRT-PCR. snRNA U6 was used as an internal reference. The primer sequences are listed in Table 1.
TABLE 1: The sequences of primers.

2.7. Cell Counting Kit-8 (CCK8) Assay
After 0, 24, 48, or 72 h of incubation, cell viability was analyzed using CCK8 (C0037; Beyotime, China). The cells were first cultured in an incubator at 37°C and with 5% CO2 for 0, 24, 48, or 72 h, followed by treatment with CCK8 (20 μL per well) at 37°C for 2 h. OD450 was measured using a microplate reader (Infinite M100 PRO; TECAN). Each experiment was performed in triplicate.
2.8. Flow Cytometry
After transfection with hsa-miR-135b-5p inhibitors or the negative control, the cells were collected in a flow tube, washed with phosphate-buffered saline (PBS), and then centrifuged. Cell apoptosis was assessed using an Annexin V/fluorescein isothiocyanate (FITC) and propidium iodide (PI) apoptosis detection kit (C1062L; Beyotime) according to the manufacturer’s instructions. Annexin V-FITC, PI, and 4-(2-hydroxyethyl)-1-piperazineethanesulfonic acid buffer were mixed at a ratio of 1 : 2 : 5 to make a dye liquor, of which 100 μL was used to resuspend 1 × 10⁶ cells. Cell apoptosis was analyzed using FlowJo software. Each experiment was performed in triplicate.
2.9. Transwell Assay
After transfection with hsa-miR-135b-5p inhibitors or the negative control, the cells were collected and centrifuged. A transwell assay was performed to detect cell migration and invasion, as described previously [Reference Xia, Gao and Shao22]. After incubation at 37°C for 16 h, the transwell chamber was washed with PBS and fixed in 95% ethanol for 5 min. The cells were stained with crystal violet for 10 min, washed with PBS, and analyzed under an optical microscope (IX73; Olympus, Japan) using ImageJ software. Each experiment was performed in triplicate.
2.10. Transcriptome Sequencing
Total RNA was obtained from hsa-miR-135b-5p inhibitor or negative control-transfected SW480 cells using TRIzol reagent. RNA integrity, purity, and concentration were determined using NanoDrop2000. Sequencing libraries were generated using NEBNext® Ultra™ RNA Library Prep Kit for Illumina® (E7530S; New England Biolabs, USA) according to the manufacturer’s instructions, and index codes were added to attribute sequences to each sample. Sequencing was performed on an Illumina sequencing platform with the PE300 bp sequencing mode. After cluster generation, the library preparations were sequenced on an Illumina HiSeq platform, and paired-end reads were generated. Quality control of the reads was conducted using in-house written scripts. Raw reads in FASTQ format were processed using in-house Perl scripts. Transcriptome sequencing data were uploaded to the National Center for Biotechnology Information database using the BioProject ID PRJNA870261.
2.11. Identification of DEmRNAs
Raw counts were normalized using the median ratio method in the “DESeq2” package (version 1.18.1) [Reference Love, Huber and Anders23], and differential expression analysis was performed to identify DEmRNAs between the hsa-miR-135b-5p inhibitor and negative control groups using the Wald test with cutoff values of P < 0.05 and |log2 FC| ≥ 1. In addition, enrichment analysis was performed on the identified up and downregulated mRNAs using the “clusterProfiler” package (version 3.2.11) [Reference Yu, Wang, Han and He24] in R (version 3.4.4) with a threshold of P.adjust <0.05, and count ≥ 2. The Benjamini and Hochberg method was used to adjust the P value.
2.12. Protein-Protein Interaction (PPI) Network
A PPI network of the top 50 upregulated and downregulated mRNAs was built using the STRING database (version 11) [Reference Szklarczyk, Franceschini and Wyder25], and the parameters were set as follows: species, Homo sapiens; and PPI score > 0.4..
2.13. hsa-miR-135b-5p-Target Gene Regulatory Network Construction
miRWalk3.0 [Reference Dweep and Gretz20] was used to identify the target genes of hsa-miR-135b-5p in miRWalk, miRtarbase, TargetScan, and miRDB databases. Target genes with a score ≥ 0.9 in more than two databases were acquired and intersected with the DEmRNAs, after which overlapping mRNAs were obtained. A regulatory network was then constructed using Cytoscape (version 3.6.1) [Reference Shannon, Markiel and Ozier21].
2.14. Prognostic Analysis
The gene expression of RNA sequencing (log2(fpkm − uq + 1)) and clinical data (TCGA Colon and Rectal Adenocarcinoma (COADREAD) Phenotype) of Genomic Data Commons (GDC) TCGA (cohort: GDC Pan-Cancer) were obtained from the TCGA database [Reference Speir, Zweig and Rosenbloom26]. Then, the matrix data of TCGA COADREAD mRNA and the clinical information of overall survival time in miRNA-target were acquired. The “survival” package (version 2.42–6) [Reference Therneau and Lumley27] in R (version 3.4.4) was used to perform prognostic analysis with a threshold of P < 0.05.
2.15. Statistical Analysis
SPSS 22.0 software was used for statistical analysis. One-way analysis of variance and Newman–Keuls multiple comparison tests were used to compare the differences between groups. Statistical significance was set at P < 0.05.
3. Results and Discussion
3.1. DEmiRNAs and miRNA-Target Gene Regulatory Network
According to the cutoff value of P < 0.05 and |log FC| > 2, 223 DEmiRNAs (170 upregulated and 53 downregulated) and 134 DEmiRNAs (60 upregulated and 74 downregulated) were identified from the GEO and TCGA datasets, respectively (Figures 2(a) and 2(b)). A total of 26 overlapping DEmiRNAs were obtained, including 17 upregulated and nine downregulated miRNAs (Figure 2(c)). In addition, a total of 194 miRNA-target gene regulatory relationships were acquired, including 17 miRNAs and 188 genes (Figure 3).

FIGURE 2: DEmiRNA screening and miRNA-target gene regulatory network. Heatmap of DEmiRNAs in the GEO (a) and TCGA datasets (b). The orange bar represents the normal group, and the yellow bar represents the tumor group. (c) The overlapped up and downregulated miRNAs screened from the GEO and TCGA datasets. DEmiRNA, differentially expressed microRNA; GEO, Gene Expression Omnibus; TCGA, the Cancer Genome Atlas.

FIGURE 3: MiRNA-target gene regulatory network. The red triangle represents the upregulated miRNAs, the green arrow represents the downregulated miRNAs, and the blue circle represents the target genes. A bigger node size indicates a higher degree.
3.2. High hsa-miR-135b-5p Expression in COAD
Of the 26 overlapping DEmiRNAs, six miRNAs that were not reported in COAD were selected, namely, hsa-miR-135b-5p, hsa-miR-19a-3p, hsa-miR-33a-5p, hsa-miR-328-3p, hsa-miR-139-5p, and hsa-miR-490-3p. qRT-PCR was performed on tissue and SW480 cells, and the results showed that only hsa-miR-135b-5p expression was significantly higher in the tumor groups (both in cell and tissue samples) than in the control groups (P < 0.05; Figure 4(a)).

FIGURE 4: Effect of hsa-miR-135b-5p knockdown on COAD. (a) Relative expression levels of hsa-miR-135b-5p in COAD tissue and cell samples. (b) Transfection efficiency. (c) Effect of reduced hsa-miR-135b-5p levels on SW480 cell proliferation. (d) Effect of reduced hsa-miR-135b-5p levels on SW480 cell migration and invasion. (e) Effect of reduced hsa-miR-135b-5p levels on SW480 cell apoptosis. *P < 0.05, **P < 0.01, ***P < 0.001, ****P < 0.0001, and “ns” represents no significant difference.
3.3. Experimental Observation of the Effect of hsa-miR-135b-5p
Experiments were performed to determine whether hsa-miR-135b-5p influences the biological behavior of COAD cells. The expression of hsa-miR-135b-5p was significantly reduced in the hsa-miR-135b-5p inhibitor group compared with the inhibitor negative control and control groups (P < 0.05; Figure 4(b)). In addition, the CCK8 assay results showed that after reducing hsa-miR-135b-5p expression, cell growth was significantly reduced (P < 0.05; Figure 4(c)). Transwell assays showed that migration and invasion of COAD cells were significantly inhibited after reducing hsa-miR-135b-5p expression (P < 0.05; Figure 4(d)). Meanwhile, flow cytometric analysis revealed that cell apoptosis was markedly increased after reducing hsa-miR-135b-5p expression (P < 0.05; Figure 4(e)).
3.4. Identification of DEmRNAs
A total of 3384 DEmRNAs (2012 upregulated and 1372 downregulated) were identified between the hsa-miR-135b-5p inhibitor and negative control groups (Figure 5(a)). Enrichment analysis showed that the upregulated mRNAs were enriched in 25 Kyoto Encyclopedia of Genes and Genomes (KEGG) pathways (e.g., ribosome, oxidative phosphorylation, and systemic lupus erythematosus) and 326 Gene Ontology Biological Processes (GO-BPs; e.g., signal recognition particle-dependent cotranslational protein targeting to membrane, cotranslational protein targeting to membrane, and protein targeting to endoplasmic reticulum) as shown in Figures 5(b) and 5(c), while the downregulated mRNAs were enriched in 20 KEGG pathways (e.g., extracellular matrix (ECM)-receptor interaction, protein digestion and absorption, and hematopoietic cell lineage) and 276 GO-BPs (e.g., cell-substrate adhesion, extracellular matrix organization, and extracellular structure organization) as shown in Figures 5(d) and 5(e).

FIGURE 5: DEmRNAs between the hsa-miR-135b-5p inhibitor and negative control groups. (a) DEmRNAs between the hsa-miR-135b-5p inhibitor and negative control groups. Top 10 significantly enriched KEGG (b) pathways and GO terms (c) of upregulated mRNAs. Top 10 significantly enriched KEGG (d) pathways and GO terms (e) of downregulated mRNAs. The x-axis represents the counts of the enriched genes, and the y-axis represents the GO terms or KEGG pathways. The red strip represents high P value. KEGG, Kyoto Encyclopedia of Genes and Genomes; GO, Gene Ontology.
3.5. PPI Network
A PPI network containing 45 nodes and 65 interaction pairs (Figure 6(a)) was constructed based on the identified DEmRNAs. H2BC14 (degree = 9), H2BC3 (degree = 9), and H4C11 (degree = 9) had higher degrees in the PPI network (Table 2).

FIGURE 6: PPI network and hsa-miR-135b-5p-target gene regulatory network. (a) PPI network. (b) The overlapped genes. (c) hsa-miR-135b-5p-target gene regulatory network. Red and green colors represent up and downregulated mRNAs, respectively, and a bigger node indicates a higher degree. PPI, protein-protein interaction.
TABLE 2: Degree of nodes in the protein-protein interaction network.

3.6. hsa-miR-135b-5p-Target Gene Regulatory Network Construction
A total of 352 regulatory relationships were identified, and 10 overlapping genes were obtained (Figure 6(b)), namely, NSA2, FOXN2, DIRAS2, DESI1, SV2C, RAB33B, MCTS1, CNIH4, SLCO5A1, and MYCBP (Figure 6(c)).
3.7. Prognostic Analysis
Prognostic analysis was conducted on the 10 overlapping genes, and the results showed that FOXN2 (P = 0.0085), NSA2 (P = 0.044), MYCBP (P = 0.0047), DIRAS2 (P = 0.0015), DESI1 (P = 0.022), and RAB33B (P = 0.037) had prognostic significance (P < 0.05; Figure 7). Of them, DIRAS2 was related to poor prognosis, while the other genes were related to better prognosis. Moreover, the six prognosis-related genes were validated, and the results showed that FOXN2 expression was significantly reduced while NSA2 and DESI1 expression was significantly increased in the miR-135b-5p-inhibitor group than in the negative control group (Figure 8). In contrast, MYCBP was not expressed in either group (P < 0.05).

FIGURE 7: Kaplan–Meier survival curves of 10 overlapped genes. (a) DESI1. (b) DIRAS2. (c) FOXN2. (d) MYCBP. (e) NSA2. (f) RAB33B.

FIGURE 8: Validation analysis of the prognosis-related genes. ***P < 0.001, ****P < 0.0001, and “ns” represents no significant difference.
4. Discussion
Dysregulated miRNAs play crucial roles in tumorigenesis of human cancers [Reference Hill and Tran28, Reference Lee and Dutta29]. In this study, we found that downregulation of hsa-miR-135b-5p significantly inhibited SW480 cell proliferation, migration, and invasion and significantly facilitated apoptosis. In addition, a total of 3384 DEmRNAs were identified, and enrichment analysis showed that the upregulated mRNAs were enriched in 25 KEGG pathways and 326 GO-BPs and the downregulated mRNAs were enriched in 20 KEGG pathways and 276 GO-BPs. A PPI network was then constructed wherein H2BC14, H2BC3, and H4C11 had a higher degree. Furthermore, a total of 352 hsa-miR-135b-5p-gene regulatory relationships were identified. Prognostic analysis showed that FOXN2, NSA2, MYCBP, DIRAS2, DESI1, and RAB33B have prognostic significance.
We first used miRNA expression profile data to screen the DEmiRNAs in COAD and adjacent cancer samples, and a total of 26 overlapping DEmiRNAs were obtained from the GEO and TCGA datasets. Six miRNAs of interest were selected among the 26 overlapping DEmiRNAs for validation via qRT-PCR, and the results showed that only hsa-miR-135b-5p was expressed at significantly higher levels in the tumor groups than in the control groups. Numerous studies have reported that hsa-miR-135b-5p is dysregulated in many human cancers and plays a crucial role in cancer progression. Naorem et al. demonstrated that hsa-miR-135b-5p is dysregulated in triple-negative breast cancer [Reference Naorem, Muthaiyan and Venkatesan30]. Lazzarini et al. showed that hsa-miR-135b-5p is differentially expressed in normal myometrium and leiomyomas [Reference Lazzarini, Caffarini, Delli Carpini, Ciavattini, Di Primio and Orciani31]. Magalhães et al. found that in both diffuse and intestinal gastric cancer subtypes, APC is modulated by hsa-miR-135b-5p [Reference Magalhães, Quintana and Lopes32]. However, hsa-miR-135b-5p in COAD has not yet been reported. In this study, our in vitro experiments revealed that changes in hsa-miR-135b-5p expression influenced the biological behavior of COAD cells. Downregulation of hsa-miR-135b-5p resulted in significantly reduced growth, migration, and invasion and markedly increased apoptosis of COAD cells, which may provide novel insights into the treatment of COAD.
To understand the exact mechanism underlying the effects of hsa-miR-135b-5p in COAD, transcriptome sequencing was performed. A total of 3384 DEmRNAs were screened, and enrichment analysis showed that the upregulated mRNAs were enriched in 25 KEGG pathways, and the downregulated mRNAs were involved in 20 KEGG pathways, including ribosome, oxidative phosphorylation, and ECM-receptor interaction. Ribosomes are essential for cellular growth, survival, and proliferation, and disruption of ribosome biogenesis can promote cell cycle arrest; thus, ribosome biogenesis is related to cancer [Reference Turi, Lacey, Mistrik and Moudry33]. Many studies have shown that oxidative phosphorylation can be upregulated in cancers and may be used as a target in cancer therapy [Reference Ashton, McKenna, Kunz-Schughart and Higgins34–Reference Ge, Wang and Feng36]. The ECM is a non-cellular component of tissue, and previous studies have reported that ECM-receptor interactions play an important role in the development and metastasis of colorectal cancer [Reference Crotti, Piccoli, Rizzolio, Giordano, Nitti and Agostini37–Reference Maltseva and Rodin39]. Thus, we hypothesized that hsa-miR-135b-5p promotes COAD progression via the ribosome, oxidative phosphorylation, and ECM-receptor interaction pathways. Additionally, a PPI network was constructed, and H2BC14 (degree = 9), H2BC3 (degree = 9), and H4C11 (degree = 9) had a higher degree in the network. Valle et al. found that H2BC3, also known as HIST1H2BB, has growth-suppressing roles and can be used as a high-grade serous carcinoma precision medicine biomarkers [Reference Valle, Rodriguez-Torres and Kuhn40]. Meanwhile, only a few studies on H2BC14 and H4C11 in cancer have been reported.
The target genes of hsa-miR-135b-5p were searched and were intersected with the DEmRNAs, resulting in a total of 10 overlapping genes. Prognostic analysis showed that FOXN2, NSA2, MYCBP, DIRAS2, DESI1, and RAB33B had prognostic significance. In addition, the six prognosis-related genes were validated, and FOXN2, NSA2, and DESI1 were found to be significantly expressed between the miR-135b-5p-inhibitor and negative control groups. Ye and Duan found that FOXN2 is downregulated in breast cancer and modulates invasion, migration, and epithelial-mesenchymal transition via regulation of SLUG [Reference Ye and Duan41]. Liu et al. reported that FOXN2 can inhibit the invasion and proliferation of human hepatocellular carcinoma cells [Reference Liu, Liu and Xu42]. Jeong et al. revealed that HOXC6-mediated miR-188-5p expression induces cell migration by inhibiting the tumor suppressor FOXN2 [Reference Jeong, Kim and Ahn43]. Dai et al. found that the lncRNA WT1-AS inhibits cell aggressiveness via the miR-203a-5p/FOXN2 axis and is associated with the prognosis of cervical cancer [Reference Dai, Guo, Xia and Pan44]. NSA2, also known as TINP1, promotes tumor cell proliferation and significantly reduces p53 and p21 expression [Reference Li, Song, Zhao, Hu and Hua45]. Wang et al. showed that NSA2 plays an important role in the development of ovarian cancer [Reference Wang, Wang and Sun46]. However, further in-depth studies are required to confirm this.
Despite the findings, this study has some limitations. First, additional relevant experiments should be conducted to validate the six prognosis-related genes and pathways identified in this study. Second, further studies are required to analyze the specific mechanisms of hsa-miR-135b-5p in the progression of COAD. Third, the function of hsa-miR-135b-5p should be explored in vivo, and the clinical application of miR-135b-5p should be further analyzed.
5. Conclusions
In summary, downregulation of hsa-miR-135b-5p may target FOXN2, NSA2, and DESI1, thereby inhibiting cell proliferation, migration, and invasion in COAD. Therefore, hsa-miR-135b-5p can be used as a therapeutic target for COAD treatment.
Data Availability
Data used to support the findings of this study are available from GEO and TCGA database. Transcriptome sequencing data were obtained from the National Center for Biotechnology Information database using the BioProject ID PRJNA870261
Additional Points
Highlights. (1) hsa-miR-135b-5p was highly expressed in COAD. (2) Downregulation of hsa-miR-135b-5p inhibits COAD cell proliferation, migration, and invasion. (3) hsa-miR-135b-5p may promote COAD progression by targeting FOXN2, NSA2, and DESI1.
Conflicts of Interest
The authors declare that there are no conflicts of interest regarding the publication of this paper.


 Open access