Introduction
The previous work of various authors has shown that resistivity soundings on temperate glaciers are feasible, however with limited accuracy. Reference Queillc-LefèvreQueille-Lefèvre and others (1959) have pointed out that the accuracy will strongly depend on the ratio of thicknesses as well as the ratio of resistivities of a conductive surface layer and of the principal ice body, i.e. on Reference CagniardCagniard’s (1959) parameter α. Just how small α would be under the most favourable conditions, and what accuracy might ultimately be expected of resistivity soundings, were not investigated. This question cannot be answered at the desk, and we have chosen the direct approach of carrying out test resistivity soundings on glaciers where the ice thickness has been investigated by other means, preferably seismic soundings. So far this has only been achieved on the Unteraargletscher. Some additional work has been carried out, however, in places with no accurate depth control, in order to gain more information on various conditions and to add further data to an inventory of resistivity values.
Comparison of Resistivity Soundings with Seismic Soundings on Unteraargletscher
Field measurements
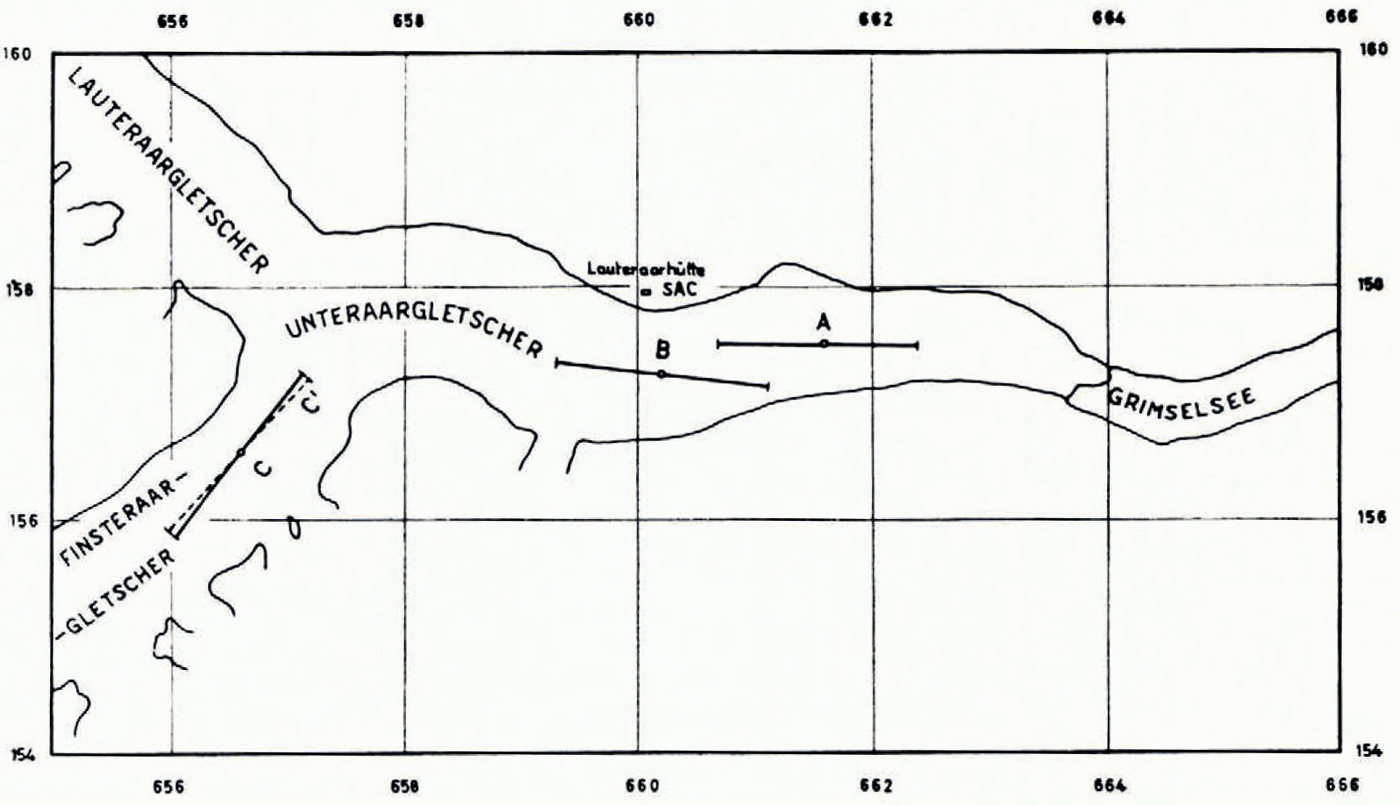
The Unteraargletscher has been thoroughly investigated by seismic reflection soundings from 1936 to 1950 (Reference JostJost, [1956]). Because of its long straight sections, the even, gentle surface slopes and the easy access by boat from the Grimsel dam it presented an excellent case for the test resistivity soundings. Taking advantage of the exceptionally warm and dry autumn we visited the glacier during the period 22–25 October 1963 and measured three resistivity lines close to the axis of the glacier (Fig. 1) at the approximate elevations of 2,080 m., 2,210 m. and 2,470 m. The glacier was mostly covered by a thin layer of snow which had fallen early in October, except for the lowest section and the pronounced medial moraine up to the junction of the two main branches of the glacier. At line b the snow cover reached the thickness of some 10–20 cm., at line c about 20–30 cm. Along line a it was even thinner or missing. During the day the snow got wet but froze during the night. The melt streams still carried a small amount of water, so that it is certain that the glacier surface was still wet beneath the snow.

Fig. 1. Position of resistivity sounding lines on Unteraargletscher
At line b, the first one measured, both electrode configurations were tried, Wenner and Schlumberger. At line c the emphasis was placed on Schlumberger, with a few check points with the Wenner configuration, and at a only the Wenner configuration could be used because of difficulties with the potential measurements at small electrode separations and lack of time.
Cross-sections of the Unteraargletscher from the seismic survey
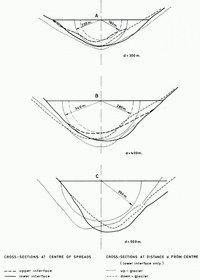
A summary of the seismic results from the Unteraargletscher has been given by Reference JostJost [1956], but a more detailed description is contained in an unpublished report by Reference SüsstrunkSüsstrunk (unpublished). The information used here was taken from this report, particularly from a contour map of the glacier bed at the scale of 1: 10,000, which served to draw cross-sections of the glacier perpendicular to the resistivity sounding lines (Fig. 2). The lowering of the ice surface since the date of the seismic survey, amounting to some 20–30 m., was taken into account. The strong solid lines in Figure 2 give the bedrock surface in cross-sections through the centres of spreads, while the light dotted and the light dashed lines refer to cross-sections at some distance up-stream and down-stream, respectively. The distances up- and down-stream were chosen according to the resistivity results, namely at the approximate Schlumberger separations L/2 where the apparent resistivity curves start to drop, i.e. where the effect of the subsurface becomes apparent. This is the crucial point for the depth determination with the Cagniard curves. In addition to the bedrock surface an upper boundary is given by the strong broken lines, for the centre cross-sections only. It refers to an intermediate reflecting interface of the seismic survey, consistently observed in the lower part of the glacier. Its nature will be discussed later.
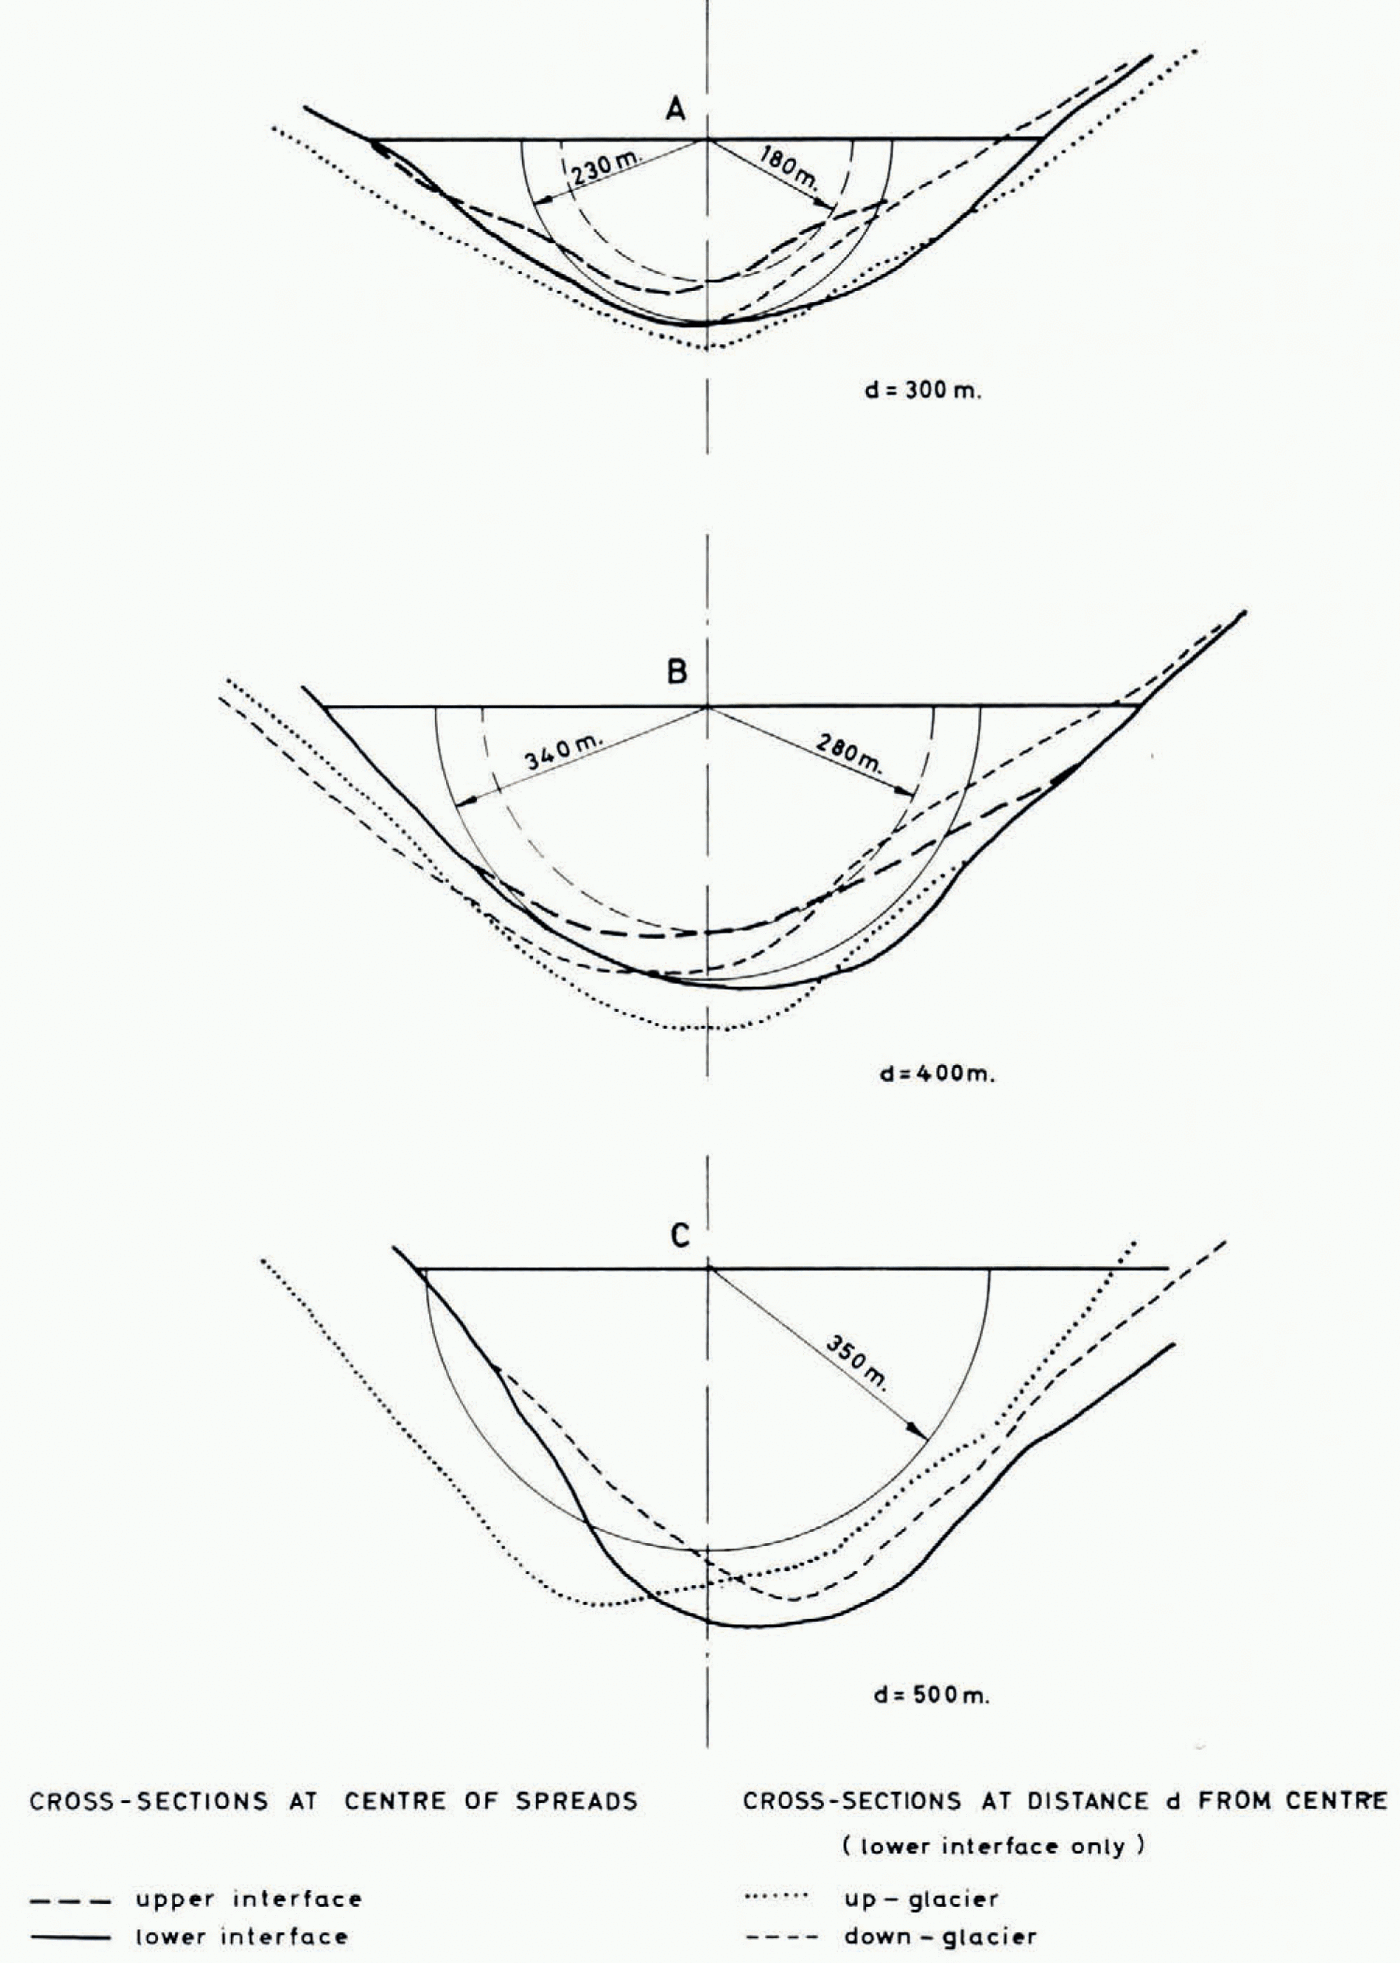
Fig. 2. Cross-section through Unteraargletscher at locations a, b and c (seismic sounding results)
Resistivity results
The measured apparent resistivities are plotted in Figures 3 to 5. Crosses refer to the Schlumberger and circles to the Wenner configuration, the Wenner data having been plotted in the Schlumberger diagram. Comparing the results obtained by the two configurations it was found that within the accuracy of observation the two results could be converted for long electrode separations following the equation L/2 (Schlumberger) = 3a/2 (Wenner) (Figs. 4, 5 and 7). By this relation Cagniard’s diagrams were also used for pure Wenner measurements (Fig. 3). It amounts to treating the Wenner data as if they were obtained with the Schlumberger configuration, despite the fact that the separation a of the inner electrodes is not small as compared to the separation L = 3a of the outer ones. After the drawings were finished a comparison of the Schlumberger with the Wenner master curves for 2-layer cases and for some 3-layer cases with ρ 1 : ρ 2 :ρ 3 = 1 :9 :∞ have shown that a factor between 1.3 and 1.4 should be used instead of 1.5. Since the correction of about 10 per cent would not significantly affect the results of this article the figures have not been altered.

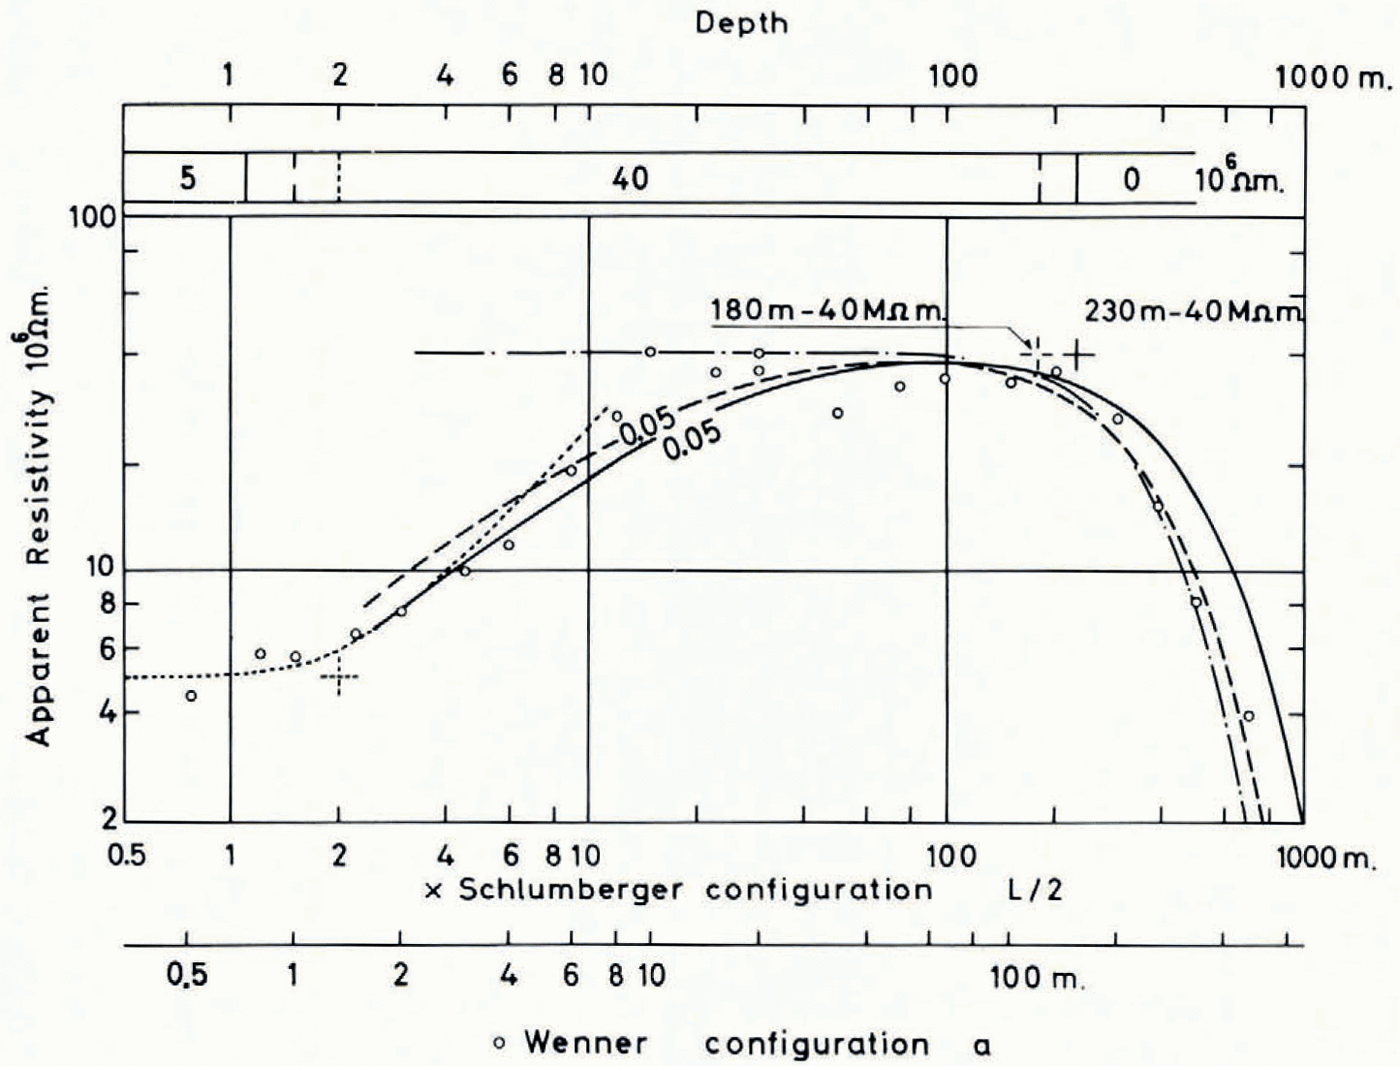
Fig. 3. Superposition of theoretical ρa-curves and observed apparent resistivities at location a, Unteraargletscher. Solid line = lower, dashed line = upper seismic interface for plate model; dash—dot line = lower seismic interface for semi-circular cylinder (empirical curve)

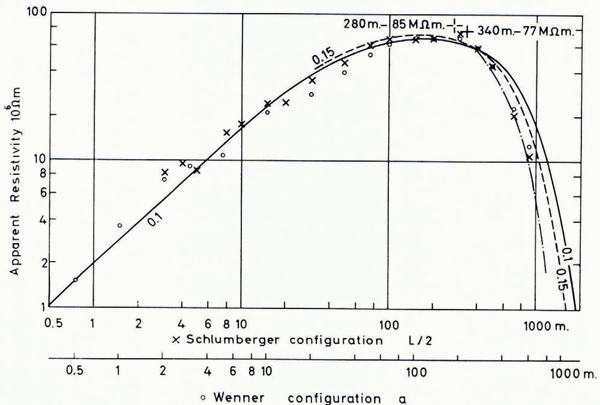
Fig. 4. Superposition of Cagniard curves and observed apparent resistivities at location b, Unteraargletscler. Solid line = lower, dashed line = upper seismic interface for plate model; dash—dot line = lower seismic interface for semi-circular cylinder model (approximation for α = 0.1)

Fig. 5. Superposition of Cagniard-curves and observed apparent resistivities for lines c and c′, Unteraargletscher. The heavy line corresponds to the proper depth of 350 m.
Our original plan of making an independent interpretation of the resistivity soundings, and then comparing the findings with the seismic results, has not been very successful, because of ambiguity. With extreme assumptions the results of Table I may be advocated. In order to have a sounder base for presentation and discussion of the results we have preferred to start with the seismic depths and to find out how well the resistivity measurements would fit the theoretical curves for a given depth. At the same time conclusive results of the resistivity of the glacier ice have been obtained.
Table I Range of Interpretations of the Resistivity Soundings on Unteraargletscher (based on infinite plate)

At location a (Obere Brandlamm) in the lowest part of the glacier the seismic results show two different depths, leaving for the resistivity sounding two possibilities open, depending on whether the upper reflecting layer is a conductor or not. Both seismic depths have been used to analyse the resistivity data, using as depth figures the radii of 180 m. and 230 m. of the semicircles matching approximately the cross-sections of Figure 2a. For plates of these thicknesses the two Cagniard curves with the parameter α = 0.05 are given by a dashed and a solid line in Figure 3 together with the measured data and an experimental curve (Reference RöthlisbergerRöthlisberger, 1967) for a semi-circular channel of radius 230 m., drawn as a dash-dot line. Two curves fit the measured data equally well, the one for a 180 m. thick plate and the one for a semi-circular cylinder of radius 230 m. Since the true shape of the glacier bed lies between the two models, the resistivity results would indicate a boundary between the two seismic interfaces. It is therefore not possible to say with which of the interfaces the resistivity data agree better.
A similar result is obtained at location b (Pavillon Dollfuss). Measured data and interpretation curves are plotted in Figure 4, now using the radii of Figure 2b as depths. The dash-dot line this time was obtained by applying to the Cagniard curve with α = 0.1 the shape-correction of a semi-circular cylinder as compared with an infinite plate with α = 0. The curve fits the measured data very well when the radius of the semi-circle is taken as 340 m., which corresponds to the lower seismic interface. But again, by considering the true shape of the bed and further taking the ambiguity of the Cagniard curves (with the higher values of α) into account, the smaller seismic depth of 270 m. can also be advocated.
At location c (Finsteraargletscher) the seismic survey gives only one interface, presumably the bedrock surface, corresponding to the semi-circle of radius 350 m. in Figure 2C. For this depth value of 350 m. and the resistivity of 50 MΩ.m. the Cagniard curve with the parameter α = 0.5 shows reasonable agreement with the observed apparent resistivities at Schlumberger electrode separations L/2 above 100 m. For smaller separations the curve for α = 0.05 would give a more satisfactory superposition, but the resulting depth of 700 m. is wrong by a factor of 2. The result would be no better if the geometry of the glacier bed was considered, on the contrary. Obviously it is not possible to approximate the observed apparent resistivities satisfactorily with any of the Cagniard curves. The reason is a different distribution of resistivities from that assumed in the Cagniard model. With a gradual increase of resistivity of the ice with depth the observed data could undoubtedly be better explained, but the distribution of resistivities is probably more complex. There is an indication that the resistivity is not only increasing with depth, but also from the centre towards the edge. The line c deviates somewhat from the direction of the axis of the glacier. We were afraid that this would affect the measurements in such a way that at large distances the apparent resistivity would come out too low because of an increased effect of the conductive bed. At the longest electrode separation additional measurements were therefore taken on a line closer to the axis (spread c′). Lower apparent resistivities were observed instead of the expected higher ones (the lower values of the pairs of crosses and circles in Figure 5 at L/2 = 900 m. were obtained on spread c′), indicating a body of ice of lower resistivity near the axis of the glacier. In a cross-section the glacier would probably show a more or less concentric structure with a lower resistivity around the centre and a higher one towards the periphery.
In two of the three test locations, a and b, fair conditions for resistivity soundings have been found. It was nevertheless not possible to decide between two seismic reflections about 20–25 per cent of the total thickness apart. An uncertainty of about this order must therefore be accepted even under favourable conditions. Both soundings, a and b, indicate constant ice resistivities in the range of spreads up to several hundred metres, but it must be noted that a resistivity of about 80 MΩ.m. was found for the bulk of the glaciel at b, which is twice the value of 40 MΩ.m. at a, although the two line centres are only 1.5 km. apart while the longest spreads overlap at one end (Fig. 1). That the ice resistivity can vary considerably over distances even shorter than the necessary range of electrode spreads has been experienced at location c.
Resistivities of surface layers
Depth sounding for ice thickness having been our primary aim, not much effort was made to investigate the conductive surface layer. At location a, where no snow was present, the measurements at small electrode separations are matched with a two-layer curve for ρ 1 = 5 MΩ.m., ρ 2 = h 2 = ∞ and h 1 = 2 m. Using the same value for ρ 1, we obtain, using the Cagniard model, h 1 = 1.1 m. (for α = 0.05, ρ 2 = 40 MΩ.m., h 2 = 180 m.), or h 1 = 1.6 m. (for α = 0.07, corresponding on the center side to the solid line and on the right side to the dashed line of Figure 3). Considering the scatter of the measurements and possible lateral inhomogeneities the agreement is satisfactory. At location b no measurements were carried out at sufficiently small electrode separations to permit the direct determination of ρ 1. However, assuming that the conductive surface layer consists essentially of snow cover of thickness h 1 = 0.15 m. we obtain with the Cagniard model ρ 1 = 0.3 MΩ.m. (for α = 0.15, ρ 2 = 85 MΩ.m., h 2 = 280 m.). At location a the deviation from the theoretical curve is too big to permit a meaningful interpretation based on the Cagniard model.
On the nature of the intermediate layer shown by the seismic survey
In the lower part of the glacier the seismic survey has shown two different reflecting interfaces. While the lower one is thought to represent the bedrock surface, the nature of the upper one is not exactly known. It is trough-shaped like the rock bed and lies some 50–100 m. above it. Jost favours the idea that it is the boundary between ice and an intermediate layer of alluvium containing perhaps some ice. The seismologists on the contrary believe they have indications that the intermediate layer consists also of ice separated from the bulk of the glacier ice by enough debris to produce reflections. It might thus be explained as an internal moraine, but the presence of a true internal moraine can be ruled out because of the trough shape (the boundary between the two main branches of the glacier, Lauteraar and Finsteraar glaciers follows the medial moraine at the surface and dips steeply into the ice). The alternative explanation that the valley bottom is filled with an old body of “dead ice” thickly covered with debris which was overriden by the glacier at a new advance hardly seems any better; there is no reason why the lower ice body should not participate in this case in the general flow of the glacier, and the intermediate layer would have been carried to the snout long ago. A more likely explanation for an intermediate layer of debris in the ice can be based on the observation that melt streams loaded with sediments flowing on ice have a much stronger tendency to erode sideways than to cut downward. In a gently sloping valley glacier like the Unteraar the marginal streams will therefore have a tendency to cut sideways into the glacier, carrying sand and gravel far into the ice. (The glacier is too flat for the stream to flow at the glacier bed where it is deepest.) This side-cutting would probably happen repeatedly and at somewhat different levels. The tendency would nevertheless be to form an englacial stream of equalized slope down to the snout, but the debris layer would be formed of individual lenses of sand and gravel at slightly varying levels. That this layer becomes gradually trough-shaped might be explained by the flow of the glacier. However, it must be admitted that there is no seismic evidence for a multiple layer; on the contrary, the seismic reflections consist of single sharp events indicating a single sharp boundary. Indeed it seems to be quite difficult to give a good reason for the existence of a trough-shaped boundary between two bodies of ice, while the existence of bottom alluvium already present before the last glacier advance and the presence of ground moraine would hardly be surprising.
Unfortunately no clear indication could be obtained from the interpretation of the resistivity measurements which seismic boundary represents the bottom of the ice. The resistivity soundings seemed rather to indicate an ice thickness between the two seismic depths. This could mean two things. If the upper interface should be the bottom, then the over-large depth value from the resistivity soundings would probably indicate an increase of resistivity in the ice towards the base, as in the case of location c. If, on the contrary, the ice should extend down to the bedrock, then the small depth value from the resistivity soundings might be caused by an intraglacial body of lesser resistivity than the ice, probably consisting of a layer (or layers) of debris completely packed in ice, on which the seismic reflection would occur. We must conclude that it is not possible to use the resistivity soundings in favour of one or the other of the above mentioned explanations of the intermediate layer. The layer (or layers) between the two seismic interfaces is too thin to be probed successfully by the resistivity method.
Results From the Large Firn Basin of Ewigschneefeld
The Ewigschneefeld is one of the tributaries of the Grosser Aletschgletscher situated east of Jungfraujoch. The upper part consists of an elongated firn basin in which the snow surface forms a gently sloping flat valley floor about 6 km. long and 1 km. wide. Both valley slopes are fairly steep and heavily glacierized. In the lower part of Ewigschneefeld a spectacular ice fall leads down to Konkordiaplatz.
We have chosen the Ewigschneefeld for resistivity soundings because of its easy access from the Forschungsstation Jungfraujoch and because of the possibility of measuring really large electrode spreads. In order to combine material and man-power the field work was carried out as a joint effort of the authors with P. Andrieux and his group, who made resistivity measurements in the Jungfraujoch region for his doctoral thesis. The original plan was to work towards the end of the cold season, i.e. before the first spring melt. After we had spent almost the entire second half of March 1964 without accomplishing much due to adverse weather conditions we had to wait almost two months before we could carry out the soundings (15–22 May). By that time part of the snow was already soaked with melt water which had developed during a spell of warm weather (12–14 May). After staking out the direction of the profile on the glacier, distances were taped out and the exact position of the centre and some additional points on both sides were surveyed from theodolite positions on rock knobs at the edge of the main glacier. The coordinates of the centre were 645 818/155 083, alt. 3 340 m. on 10 April, while the azimuth of the profile was 138.0°. The topography along this line taken from the 1957 Aletsch map 1: 10,000 is given in Figure 6. Due to a slight bend in the glacier only part of its length (4 km.) could be utilized with a straight sounding line. At the longest electrode separation of 2 km. from the centre (Wenner separation a = 1,333 m.) the upper current-electrode was 500 m. from the bergschrund, the lower one 200 m. from the foot of the center (glacierized) valley flank (the centre of the line was at the same time slightly to the right of the middle of the glacier, about 350 m. from the right and 550 m. from the center glacier-covered mountain side).

Fig. 6. Surface topography and velocity—mass-balance depths along the resistivity sounding line on Ewigschneefeld
The results of the measurements at Ewigschneefeld are plotted in Figure 7. The Cagniard curve for the parameter α = 7.5 and ρ 2 = 50MΩ.m. indicates an ice thickness of 250 m. if the glacier were an infinite plate. This is not more than an indication; assuming half the resistivity the ice thickness would come out roughly twice as high. Besides the standard Schlumberger and Wenner results some data are plotted in Figure 7 with triangular symbols for large separations based on the measurement of the potentials between a central electrode and one of the standard Wenner electrodes (Lee configuration). It is evident that the glacier is thinner in the upper half than in the lower halft of the profile. A rough evaluation of the upper half indicates ice thicknesses of 190 m. with a resistivity of 50 MΩ.m. and 350 m. with 25 MΩ.m.

Fig. 7. Superposition of theoretical ρa-curves and observed apparent resistivities of the resistivity soundings from Ewigschneefeld
Near the surface a first layer of 2 m. of resistivity 0.5 MΩ.m. and a second one 1 m. thick with resistivity 0.056 MΩ.m. are obtained with the plotted theoretical Schlumberger curve. This is in rough agreement with the results obtained for a single surface layer 2 m. thick with resistivity 0.056 MΩ.m. using the Cagniard parameter 7.5. It is noteworthy that the apparent resistivities measured on a perpendicular line do not differ much from the ones measured on the profile, indicating fairly consistent surface conditions over a large area.
Less ambiguous ice thickness estimates than by resistivity sounding can be obtained from flow and mass-balance considerations. They are based on movement measurements of stakes along the resistivity sounding line close to the longitudinal axis of Ewigschneefeld, and on mass balance studies already under way for several years. With the flow properties used by Reference NyeNye (1953, Reference Nye1957) and the flow characteristics for an elliptical channel given by him (Reference NyeNye, 1965) an ice thickness of 300 m. has been computed for the upper part and of 370 m. for the central and lower part of the resistivity line, also considering in the estimate the possibility of sliding on the bed. The use of an elliptical channel is jusgified because of the glacierization of the mountain flanks; furthermore a much better agreement between independent computations based on velocity and ice mass flowing through the sections was found for an elliptical channel than for a parabolic one. An accuracy of probably better than 10 per cent has been obtained in this manner. The uncertainty of the result is caused by uncertainty in the mass-balance estimates, in the flow law and in the flow pattern (amount of sliding on the bed). If we consider major irregularities of the bed, the depth is still less certain. It is hoped that future surface-movement studies (complete cross-sections should be observed rather than only the maximum velocity near the axis of the glacier) and seismic soundings will eventually ascertain the depth. For the time being the above estimates can be used for further analysis of the resistivity data. With the depth of 350 m. ±15 per cent and neglecting the trough-shape of the glacier we obtain now a resistivity of ρ 2 = 30 to 40 MΩ.m. However, the measured apparent resistivities only fit the theoretical curve satisfactorily in the range of L/2 from 100 to 1,000 m., and even here a slight systematic deviation appears. An empirical curve drawn through the measured points, as compared with the theoretical one, would be flatter in the ascending and much steeper in the descending part of the curve. The lower ascending slope is indicative of a gradual increase of resistivity with depth, while the steep drop at the longest separations is clearly affected by the geometry of the glacier, i.e. the limited lateral extent of the ice and the proximity of bedrock at the ends of the line. As a matter of fact, the observed values drop off more rapidly than any theoretical curve for plane parallel layers could match. The interpretation has therefore been based on a fair superposition before the drop-off, i.e. in the region of the maximum. How much the maximum is already influenced by the geometry of the glacier we do not know. If such an influence should exist and we want to account for it, the maximum would have to be higher and would also have to be moved to the right. A higher value for ρ 2 probably not exceeding 60 MΩ.m., still corresponding to the same depth value of 350 m., would result. In principle, an effect of the valley walls must be expected to be more pronounced the more conductive the surface layer is.
Range of Resistivities in Temperate Glaciers
It is not possible at this stage to make a firm statement on the full variability of resistivity in glaciers because of lack of sufficient experience. It is nevertheless of interest to summarize the data already collected at different places. In Figure 8 some typical experimental curves of apparent resistivity versus electrode separation are plotted, while some information on the respective measurements is contained in Table II. The common feature of the curves is a steep rise. While some climb at the 45° angle typical for the Cagniard model, other curves show a more gentle slope indicating a gradual increase of resistivity with depth or an equivalent layered structure where the successive layers show an increase of resistivity by steps. Not a single curve is steeper than the theoretical limit of 45° for isotropic material in a laterally homogeneous half space where property changes occur only in the direction perpendicular to the surface.

Fig. 8. Empirical curves from various temperate glaciers:

Table II Information on Curves of Figure 8
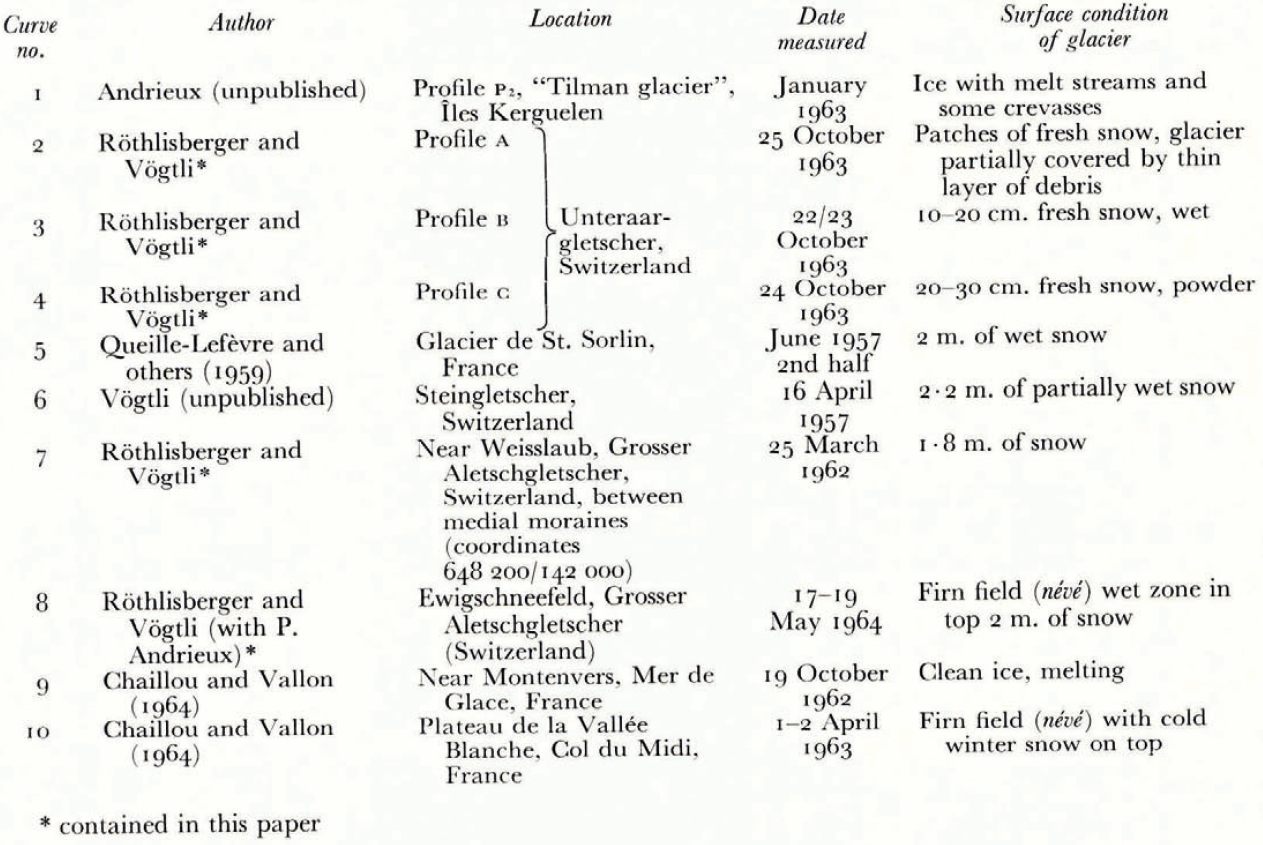
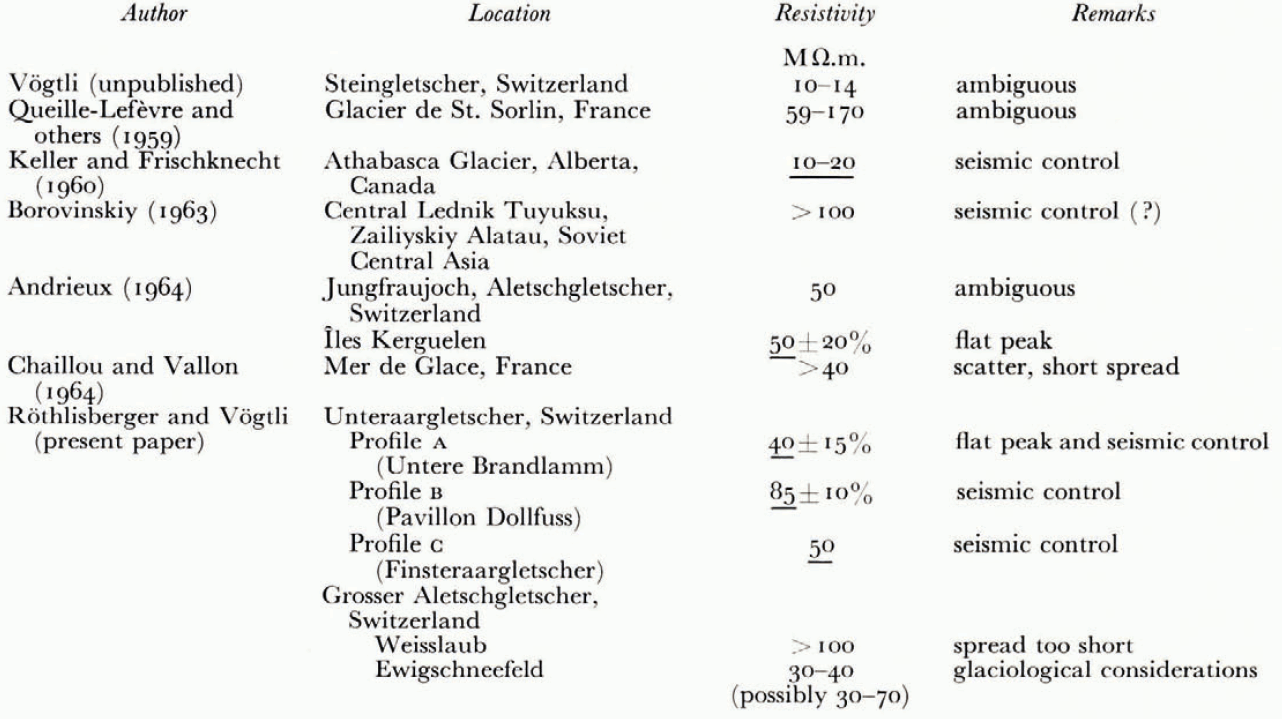
The true resistivity of the ice can only be found directly in those cases where the peak of the curve has a flat top. In the other cases a more detailed analysis is needed, but the peak value naturally gives a lower limit for the true resistivity. These lower limits vary between to and 70 MΩ.m. By further analyses of the observed curves the values of Table III were obtained by various authors. Only the underlined figures are fairly certain because they were deduced from curves with flat peaks, or because the ambiguity was eliminated by seismic depth control. There is no doubt that most of the measurements carried out so far on temperate glaciers indicate resistivities well above 10 MΩ.m.
The highest observed values are of special interest. Up to now a maximum apparent resistivity of 68 MΩ.m. had been observed in Profile b (Pavilion Dollfuss) on Unteraargletscher, corresponding to a true resistivity of about 85 MΩ.m. But the incomplete curve from Grosser Aletschgletscher (Weisslaub) showing an ideal rise at 45°, indicates a considerably higher resistivity of at least 100 MΩ.m., probably about 120 MΩ.m.
The high resistivities measured on temperate glaciers deviate considerably from the results of Reference EigenEigen and others (1964), who have determined the ultimate value of the D.C. conductivity of extremely pure ice in the laboratory. They found a conductivity of 1.0×10⁻⁹mho cm.−1±15 per cent at −10°C. and about 2×10⁻⁹mho cm.−1 at 0°C. (graphical extrapolation), i.e. a resistivity of 5 MΩ.m. for temperate ice. The difference between this resistivity and the values observed on temperate glaciers is far too big to be explained by experimental error. Whether the glacier ice has developed a special structure by numerous recrystallizations over a period of centuries or under the continuous strain, whether blocking layers exist at the grain boundaries (personal suggestion by C. Jaccard), or whether the conductivity mechanism is different at the very low current densities, which are by orders of magnitude smaller in the glacier than in the laboratory experiment, are open questions. Reference Heinmets and BlumHeinmets and Blum (1963) have reported on laboratory experiments with low current densities where they found a minimum resistivity at about −8°C., and higher resistivities above and below this temperature. By extrapolating their results to 0°C. a resistivity of the order of 30 MΩ.m. is indicated, whereas at −10°C. there is a fair agreement with the values of Reference EigenEigen and others (1964). Further laboratory measurements preferably with glacier ice should be carried out by physicists in order to explain the very high resistivity found by the geoelectric measurements.
Table III Resistivity of Temperate Glaciers
In the discussion about high resistivity of temperate ice and discrepancy between laboratory and field results one point must be stressed, that in the field measurements no indications for a deviation from linearity of current and potential have been observed. Ohm’s law has always been fulfilled (except for minor discrepancies at small electrode separations). In this respect it is also significant that numerous satisfactory superpositions of observations and theoretical curves of apparent resistivity versus electrode separation have been achieved, and that the 45° slope of the rising section of the Cagniard curves has never been exceeded. This again is a strong indication that Ohm’s law is observed in the major portion of the large ice body in which the electric current is flowing.
The Applicability of the Resistivity Sounding Method on Temperate Glaciers
It has been shown that the thickness of temperate glaciers can be obtained with the resistivity method, but that the accuracy is limited, and that the results are often ambiguous. The latter is especially true for Cagniard parameters α > 1. Depths might still be obtained if the resistivity value of the glacier were known. Unfortunately there is a fairly wide margin of resistivity to choose from, between say 20 and 120 MΩ.m., values which differ by a factor of 6! However, a certain tendency seems to exist in the distribution of resistivities, so that the highest values occur in the oldest ice, the lowest in young ice and below ice falls (where the ice is of course younger than in a flat glacier of the same length). If this should be confirmed by future observations one would at least have a rule for what range of resistivities to expect; but an uncertainty of at least a factor of 2 would remain in any case for large values of α.
For small curve parameters, say α < 0.5, depth determinations are satisfactory and may in ideal cases (α < 0.2) reach an accuracy of some to per cent. The parameter α = h 1 ρ 2/h 2 ρ 1 is small when the surface layer is thin and the glacier is thick, or when the resistivity of the surface layer is relatively high and that of the glacier is relatively low. Soundings should therefore be carried out when the ice surface is clear of snow. In addition, a spell of overcast weather would probably be better than clear weather, since solar radiation forms a low resistivity porous ice surface some 20–60 cm. thick, containing plenty of water. A smooth frozen surface would probably be ideal, but by the time the frost starts to penetrate into the glacier—and the solar radiation is missing—there is also a good chance of snowfall.
Leaving the surface condition aside, we can also argue that a thicker glacier is more suited for resistivity soundings than a thin one, which may be illustrated by the following example. For a glacier of a medium resistivity ρ 2 = 50 MΩ.m., and a surface layer of snow or porous ice 0.5 m. thick with ρ 1 = 0.5m. MΩ.m., α ≦ 0.5, we obtain h 2 ≧ 100m., i.e. the glacier must be at least 100 m. thick for a successful depth determination.
In conclusion the resistivity method cannot be recommended for mere soundings, because the outcome is too doubtful. However, the extreme resistivity in temperate ice and the variability of the resistivity are intriguing phenomena for further investigations, and resistivity soundings are therefore important even though depth will not be the main unknown variable to be evaluated. Since it has been amply demonstrated that for proper interpretation both depth and resistivity must be considered, an independent depth sounding by a different method should also be carried out in this case. Different approaches to the problem of resistivity in glacier ice will also have to be sought in the future including measurements in drill holes and on samples.
Acknowledgements
The authors want to express their thanks to Messrs. J. Kienle, B. Morales, P. Andrieux, M. Kahn, G. Pulfer, M. Aellen and F. Graf, who have participated in part of the field work. The permission by Prof. G. Schnitter and Ing. P. Kasser to carry out the investigations as part of the regular activity of the Abteilung fair Hydrologic and Glaziologie at the Versuchsanstalt für Wasserbau and Erdbau an der E.T.H. and the permission by Dr. Künzler to use P.T.T. instruments are gratefully acknowledged.


