


1. Introduction
In winter, the pack ice of the Arctic Ocean resembles an aggregate of closely packed rigid plates whose boundaries may be modeled as a plane geometry. This discrete view suggests that the large-scale deformation of the pack ice is some integral of the piecewise-rigid motions of these plates. Thus, opening, ridging and sliding occur at plate boundaries (cracks and leads). This kinematic relationship between geometry and deformation plays a central role in theories of the large-scale momentum and mass balances of sea ice. In these theories, it is postulated that the large-scale strain rate influences the formation of ridges. The forces that build these ridges are exerted between adjacent plates, and this modifies the momentum balance (Reference Thorndike, Rothrock, Maykut and ColonyThorndike and others, 1975). By equating the rate of change of potential and internal energy in ridge formation to the rate of dissipation of kinetic energy in the large-scale flow, Reference RothrockRothrock (1975) derived a relationship between the so-called ridging coefficient and the shape of the yield curve. Reference Ukita and MoritzUkita and Moritz (1995; henceforth UM95) showed that minimizing the maximum shear stress provides both an algorithm for calculating a continuous yield curve from a given ridging coefficient, and a necessary condition for the existence of a continuous yield curve consistent with the given ridging coefficient.
In the companion paper (Reference Moritz and UkitaMoritz and Ukita, 2000), we present a kinematic model that explicitly predicts large-scale coefficients of opening, ridging and sliding as functions of the geometry of cracks and the large-scale strain rate. By contrast, relatively little is known about the ridging coefficient based on observations (Reference Stern, Rothrock and KwokStern and others, 1995). In Reference Moritz and UkitaMoritz and Ukita (2000) we analyzed uniform and regular geometries of rigid plates, which may be too idealized to represent real pack ice. Here we extend the analysis to a random geometry, whose statistical properties we prescribe. By specifying geometry according to observations, the model could in principle be used to predict a ridging coefficient testable against any independent observations. Then, using the energetics framework of Reference RothrockRothrock (1975), we apply minimization of the maximum shear stress to simulated ridging and sliding coefficients to find the shape of the yield curve, under different assumptions about the role of sliding in the dissipation of kinetic energy.
2. Method of Analysis
2.1. Kinematic model of the deformation coefficients
This presentation employs the kinematic model described in Reference Moritz and UkitaMoritz and Ukita (2000), which is based upon a discrete representation of pack ice. The reader is referred to that paper for details. The model relates large-scale strain rate and crack geometry to individual piecewise-rigid body motion of the plates. The large-scale strain rate is parameterized by divergence and shear or by strain-rate magnitude and the ratio of shear to divergence, denoted by
![]() and 9, respectively. Each crack in the pack ice is characterized by three geometric quantities: (a) orientation of the crack with respect to the principal axis of the strain rate, μ(x); (b) orientation of the relative position vector between the center points of adjacent plates with respect to the crack, η(i); and (c) area of the quadrilateral region associated with the individual crack A«. Given either a statistical or deterministic specification of the triplet (μ(i),η(i), A(i)) for a set of cracks indexed by i = 1,…, N whose quadrilaterals occupy a finite area R, the model predicts the large-scale coefficients of deformation for opening, ridging and sliding, α0, αr , αs, as functions of θ:
and 9, respectively. Each crack in the pack ice is characterized by three geometric quantities: (a) orientation of the crack with respect to the principal axis of the strain rate, μ(x); (b) orientation of the relative position vector between the center points of adjacent plates with respect to the crack, η(i); and (c) area of the quadrilateral region associated with the individual crack A«. Given either a statistical or deterministic specification of the triplet (μ(i),η(i), A(i)) for a set of cracks indexed by i = 1,…, N whose quadrilaterals occupy a finite area R, the model predicts the large-scale coefficients of deformation for opening, ridging and sliding, α0, αr , αs, as functions of θ:
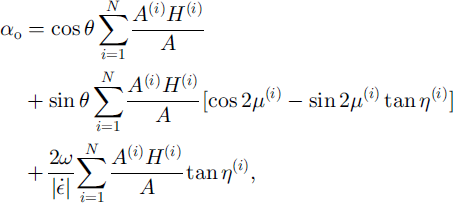
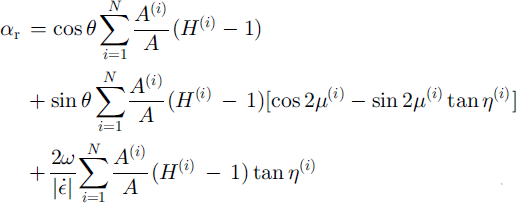
and
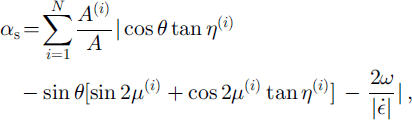
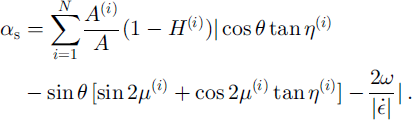
where ff≈ is the Heaviside function of the velocity difference normal to each crack and ω is the rigid body rotation rate of each plate about its geometric center. If the definition of sliding is limited to cracks that are simultaneously sliding and closing, Equation (3) is replaced with
2.2. The energy equation
The large-scale, two-dimensional, internal ice stress a is the integral of the Cauchy stress over the ice thickness minus the local hydrostatic load, averaged over an area large enough to cover many plates (Reference RothrockRothrock, 1975; Reference Gray and MorlandGray and Morland, 1994). The sum and difference of its principal components, σI6 and σII, are called the normal stress and the maximum shear stress. In the sea-ice momentum equation, the force per unit area associated with the large-scale stress appears in the form ∇ · a. An equation governing changes in the kinetic energy of ice per unit area is obtained by taking the dot product of the ice velocity and the momentum equation. Changes in the kinetic energy per unit area associated with the large-scale stress are then written as
with : denoting the summing operation over all entries. The last term represents processes by which kinetic energy is transformed to internal energy by large-scale deformation.
The essence of the energy balance argument developed by Reference Parmerter and CoonParmerter and Coon (1972) is that the rate of increase of internal energy by ridge formation equals this rate of kinetic energy dissipation. Note that ˚internal" energy here includes the potential energy associated with vertical displacements of ridged ice. Reference RothrockRothrock (1975) extended the theory by combining it with the ice-thickness distribution theory (Reference Thorndike, Rothrock, Maykut and ColonyThorndike and others, 1975). Within the context of the plastic theory, he showed that for the mechanical production of potential energy and the frictional loss per unit area those sinks are formulated as
![]() The function σT(9) describes the change of the fractional area covered by ridges as a function of 9 that characterizes the ratio of shear motion to divergence. P*, referred to as the maximum compressive strength of the pack ice, can be thought of as the potential plus internal energy transformed per unit area per unit strain rate in pure convergence. Assuming that ridges are caused by relative translational motion, Rothrock derived an explicit formulation of
The function σT(9) describes the change of the fractional area covered by ridges as a function of 9 that characterizes the ratio of shear motion to divergence. P*, referred to as the maximum compressive strength of the pack ice, can be thought of as the potential plus internal energy transformed per unit area per unit strain rate in pure convergence. Assuming that ridges are caused by relative translational motion, Rothrock derived an explicit formulation of
for the energetics of the ridging process. In UM95 we added a second term P*ks to the righthand side of this equation, to recognize the possibility that kinetic energy can be dissipated by sliding relative motions, as well as by ridging relative motions. Normalizing the stresses by P*, this augmented expression then becomes
where the parameter k describes the ratio of energy transformations associated with sliding to ridging (note that σI and σII are normalized stress components and remain so hereafter, and that in UM95 the second term on the lefthand side is multiplied by the cosine of the angle measuring the difference between the principal directions of strain rate and stress).
2.3. Minimization of maximum shear stress
In Rothrock’s formulation, P* is a function of ice properties such as thickness and concentration. He pointed out that once the righthand side of the energy equation (7) is known then the functional relationship between two stress components, σI and σII, can be calculated as a solution consisting of the envelope of lines defined by
for different values of θ. Note that in this form it has been assumed that the principal directions of stress and strain rate align, and that the contribution from sliding is zero, i.e. k = 0.
UM95 pointed out that imposing the condition of minimizing the maximum shear stress, σII, for a given value of σI defines the envelope. This condition provides a numerical algorithm for computing the functional relationship between σI and σII, and thus the shape of the yield curve. Furthermore, it provides relationships among the flow rule, the convexity of the yield curve and the alignment of principal directions of stress and strain rate. UM95 applied this condition and the energy equation to the kinematic model using simple, uniform geometric patterns of cracks and plates.
2.4. Random geometry
What is new here is a combined analysis of the three elements summarized above, namely, the kinematic model, the energy equation and the minimization of maximum shear stress, with a random geometry that simulates pack ice with prescribed statistical properties. Reference ThorndikeThorndike (1987) introduced the random geometry to investigate an isotropic sea-ice field and its deformation. The Poisson line process was used to construct the random cracks. Each line is specified by the polar coordinates (rj, φj) , j = 1 , . . . , J for J lines within a circular domain of radius R. The jth line intersects the point (rj, φj) and is perpendicular to the vector from the origin to this point. The isotropic Poisson line process is a special case in which φj is distributed uniformly and the sequence of rj is generated independently from the exponential distribution for rj+1 ― τ3 with r0 = –R and a mean value Rmean. The number of lines in this circular domain is then Poisson distributed with average density A = 1/Rmean, so the expected number of cracks in the domain is 2R/Rmean. This construction is simple, and statistically isotropic and homogeneous (Reference MilesMiles, 1964; Reference Stoyan, Kendall and MeckeStoyan and others, 1987). The intersections between pairs of lines define the end-points of the cracks for our kinematic model (see Reference Moritz and UkitaMoritz and Ukita, 2000, fig. 2).
Reference ThorndikeThorndike (1987) assigned the relative displacements at cracks randomly, using an independent Gaussian distribution process. This implies that the relative displacement is independent of the geometric properties of the plates whose boundary is the given crack. Our kinematic model used here is different, because the relative displacement depends explicitly on the relative position vector between the center points of plates on either side of a given crack.
Here we generate 100 realizations of isotropic random geometry on a domain with radius R = 3 and density A = 1/ 4 (Fig. 1). For each realization, we find the length and orientation of each crack, and the centroids of the neighboring plates, which specify all terms in Equations (1–4). Assuming that the plates do not rotate about their centroids (LU = 0), we compute the opening, ridging and sliding coefficients for each realization, and then average over the ensemble of 100 realizations. In applying Equations (1–4), the exact locations of centroids are needed. For a circular domain, this presents a numerical problem because of boundary plates. To circumvent this problem, we construct the crack geometry within a larger domain (R = 3), then sample only those plates with centroids inside the smaller interior domain (R = 2), and use only well-defined crack segments in the computations. This is explained in the caption of Figure 1.

Fig. 1. A realization of isotropic random geometry constructed by the Poisson line process with density A = 1/4 (black lines) over the domain defined by the outside circle with radius 3. To minimize the bias from the edge plates with circular boundaries, only those crack segments having at least one end-point inside the inner circle are used for calculation (lightly shaded region). A typical crack segment and the centroids of adjacent plates are marked with dark shade, which corresponds to figure 2 of Reference Moritz and UkitaMoritz and Ukita (2000). Note that in this realization the areas of light- and dark-shaded regions correspond to A and A(i)m Equations (1–4).
3. Results
Figure 2 shows opening, ridging and sliding functions averaged over an ensemble of 100 independent realizations with the sliding function calculated using Equation (4). These plots share many features with the isotropic ensemble of uniform square geometries (Reference Moritz and UkitaMoritz and Ukita, 2000, fig. 6). For instance, the ridging coefficients are identically zero on 0 ≤ θ < π/4. This corresponds to the dominant influence of divergence on opening, which always exceeds the closing by shear motion, so that no cracks can close. As in the square-geometry case, the net opening is a cosine function, consistent with the original ice-thickness distribution formulation (Reference Thorndike, Rothrock, Maykut and ColonyThorndike and others, 1975).
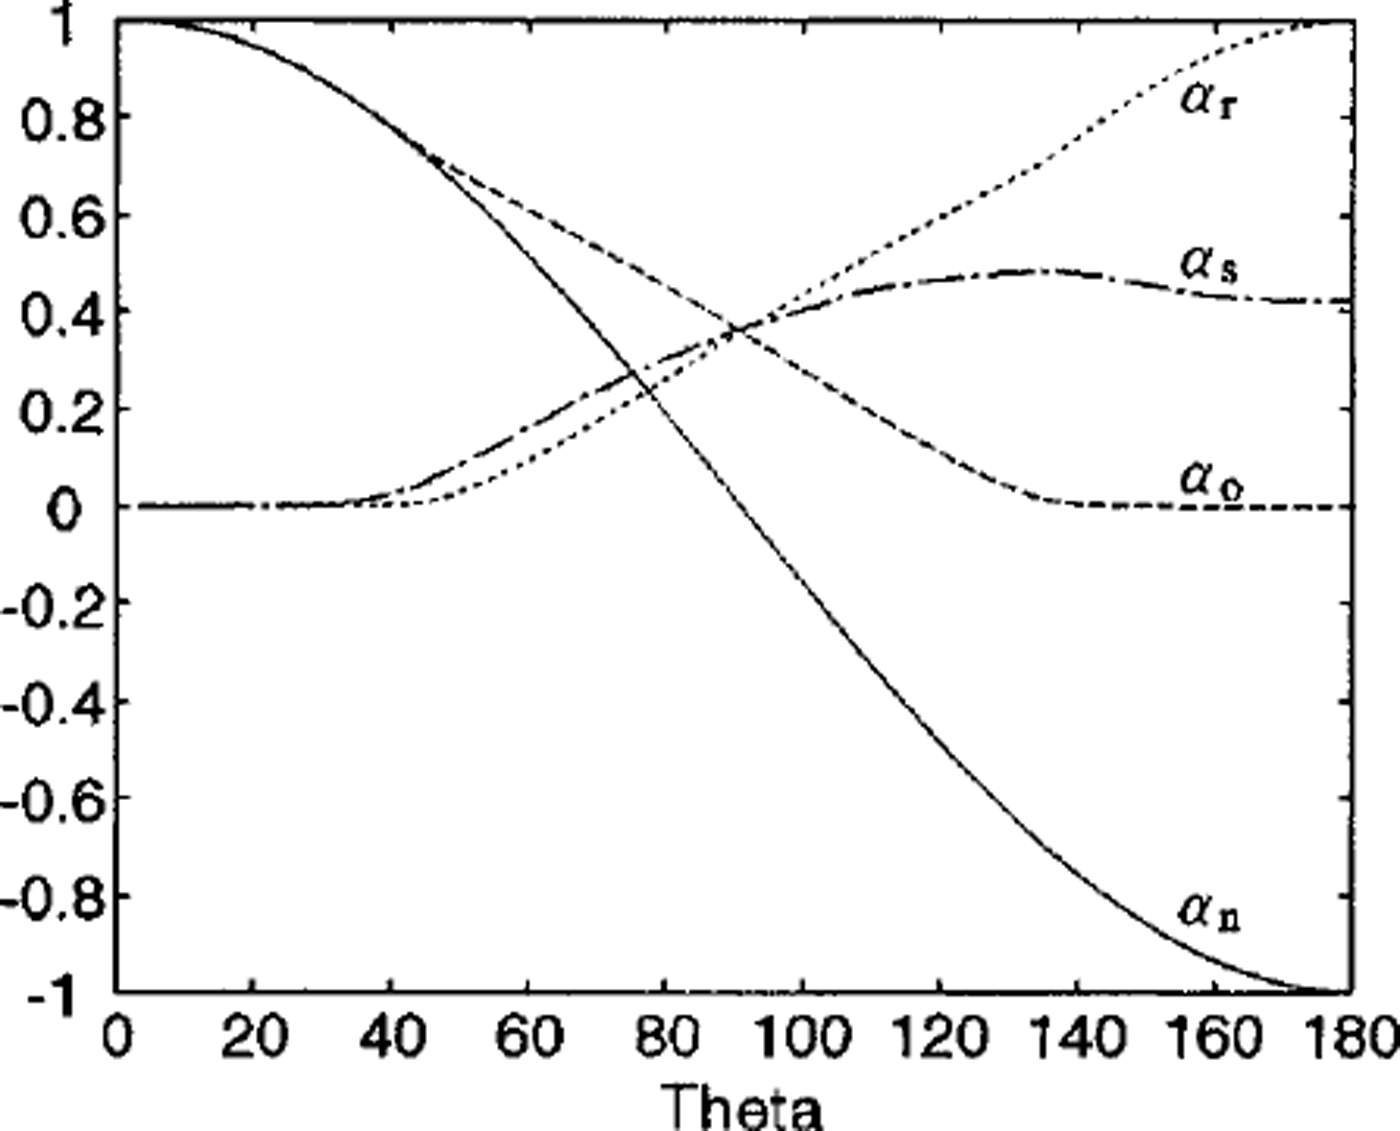
Fig. 2. The opening (dashed line), ridging (dotted line), sliding (dash-dotted line) and net opening (solid line) functions against 9. The net opening is defined as opening minus ridging. The obtained coefficients are numerically identical to cos θ. note that the estimated ridging coefficients are in good agreement with satellite observations (i.e. Reference Stern, Rothrock and KwokStern and others, 1995, fig 5).
On the other hand, sliding coefficients differ between the isotropic-square and random-geometry cases. Although for both cases σs(9) = 0 over 0 ≤ θ < π/4, it becomes zero at θ = π in the former case, but not in the latter. This contrast results from the difference in the distribution of η between the two cases. η is identically zero in the isotropic ensemble of square geometries, but is distributed over a range of values in the random geometry. These non-zero values of η make a positive contribution to the first term within the absolute value sign in Equations (3) and (4). In short, unless the geometry of plates is regular, or equivalently all plates are symmetric about their intervening cracks, the terms involving η produce a positive contribution to sliding.
Figure 3 shows the yield curves using minimization of maximum shear stress with the ridging and sliding coefficients plotted in Figure 2. With k = 0, the yield curve has a sine-lens shape. Reference BratchieBratchie (1984) proposed a sine-lens yield curve to describe plastic behavior for a system of circular disks colliding at random. Its geometric setting is interpreted as isotropic, and the dynamics formulation is restricted to normal forces between disks. In essence, it is similar to our isotropic model with k = 0.
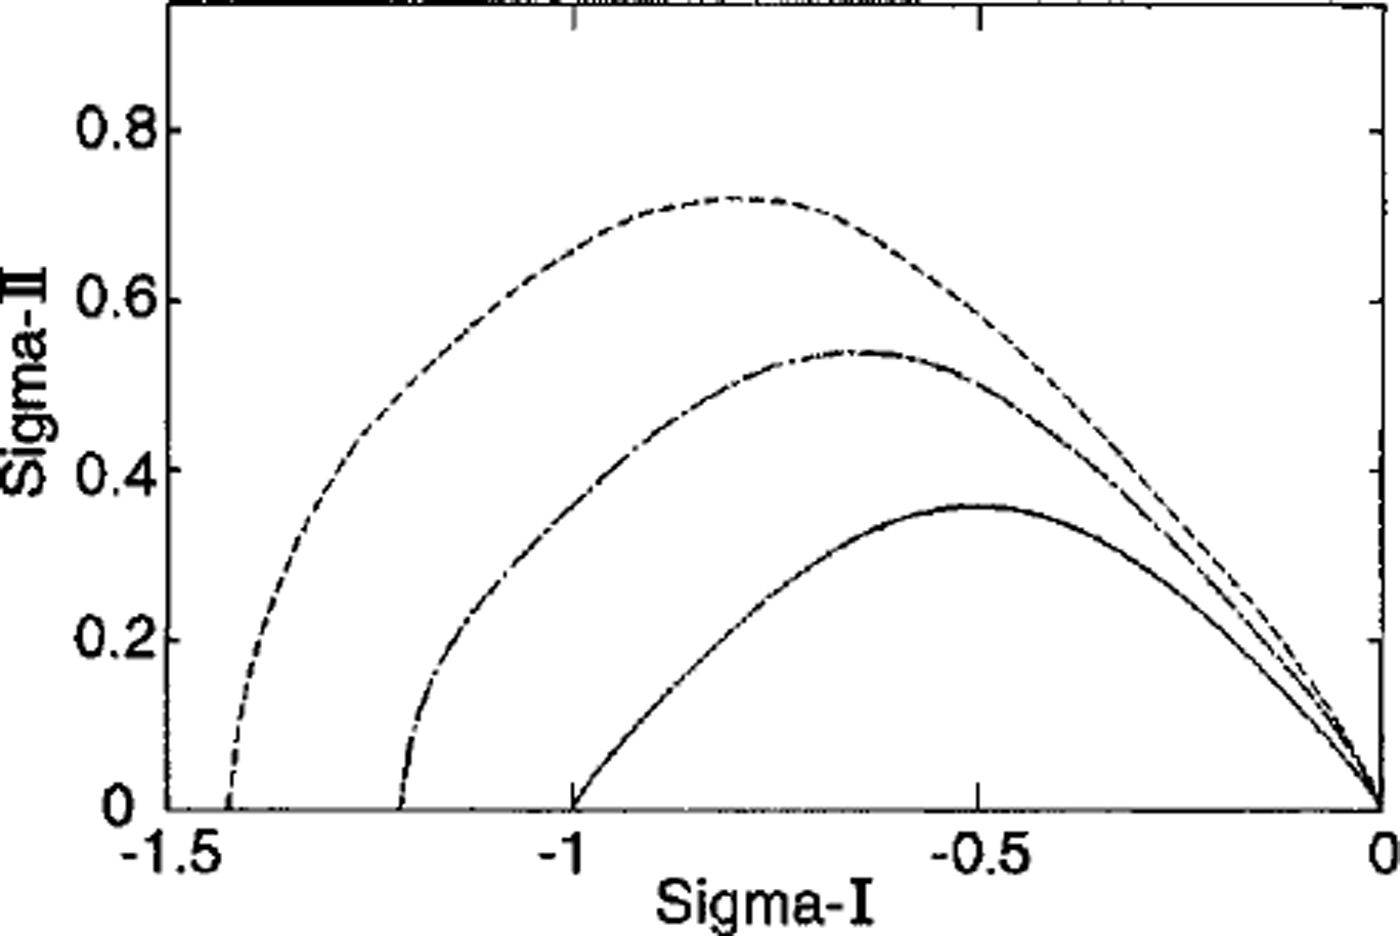
Fig. 3. The yield curves computed from random isotropic geometry with varying values of k: k = 0 (solid line), k = 0.5 (dash-dotted line) and k = 1.0 (dashed line). Without the contribution from sliding, the yield curve has the sine-lens shape. As k increases, the shape changes to tear-dropped and becomes more asymmetric.
To examine the influence of sliding on the yield curve, we follow the same minimization procedure with k = 0.5 and k = 1.0 (Fig 3). As k increases, there is an increase in the maximum shear stress, as well as the normal elongation along stress axis. There also develops asymmetry in the shape between the divergent ( dσII/dσI ≤ 0) and convergent (dσII/dσI ≥ 0) regimes. Indeed the shape is like a teardrop. These features correspond to some intuitive notions about the small-scale physical processes. First, both closing and sliding at the cracks result in ridging by the formation of pressure and shear ridges. And second, more shear ridge formation occurs under a convergent ice field. It is noteworthy that, although exact shapes vary, this reasoning led Reference Coon, Maykut, Pritchard, Rothrock and ThorndikeCoon and others (1974) and Reference RothrockRothrock (1975) to propose a teardrop shape for the yield curve of pack ice.
Although the yield curves for the isotropic ensemble of square plates and the random geometry are similar for k = 0, they differ significantly when k ≥ 0 (Figs 3 and 4), reflecting the difference in the behavior of the sliding function near θ = π. Since, in general, η does not vanish, we see both a positive sliding coefficient at θ = π and a corresponding elongation of the yield curve parallel to the normal stress axis.
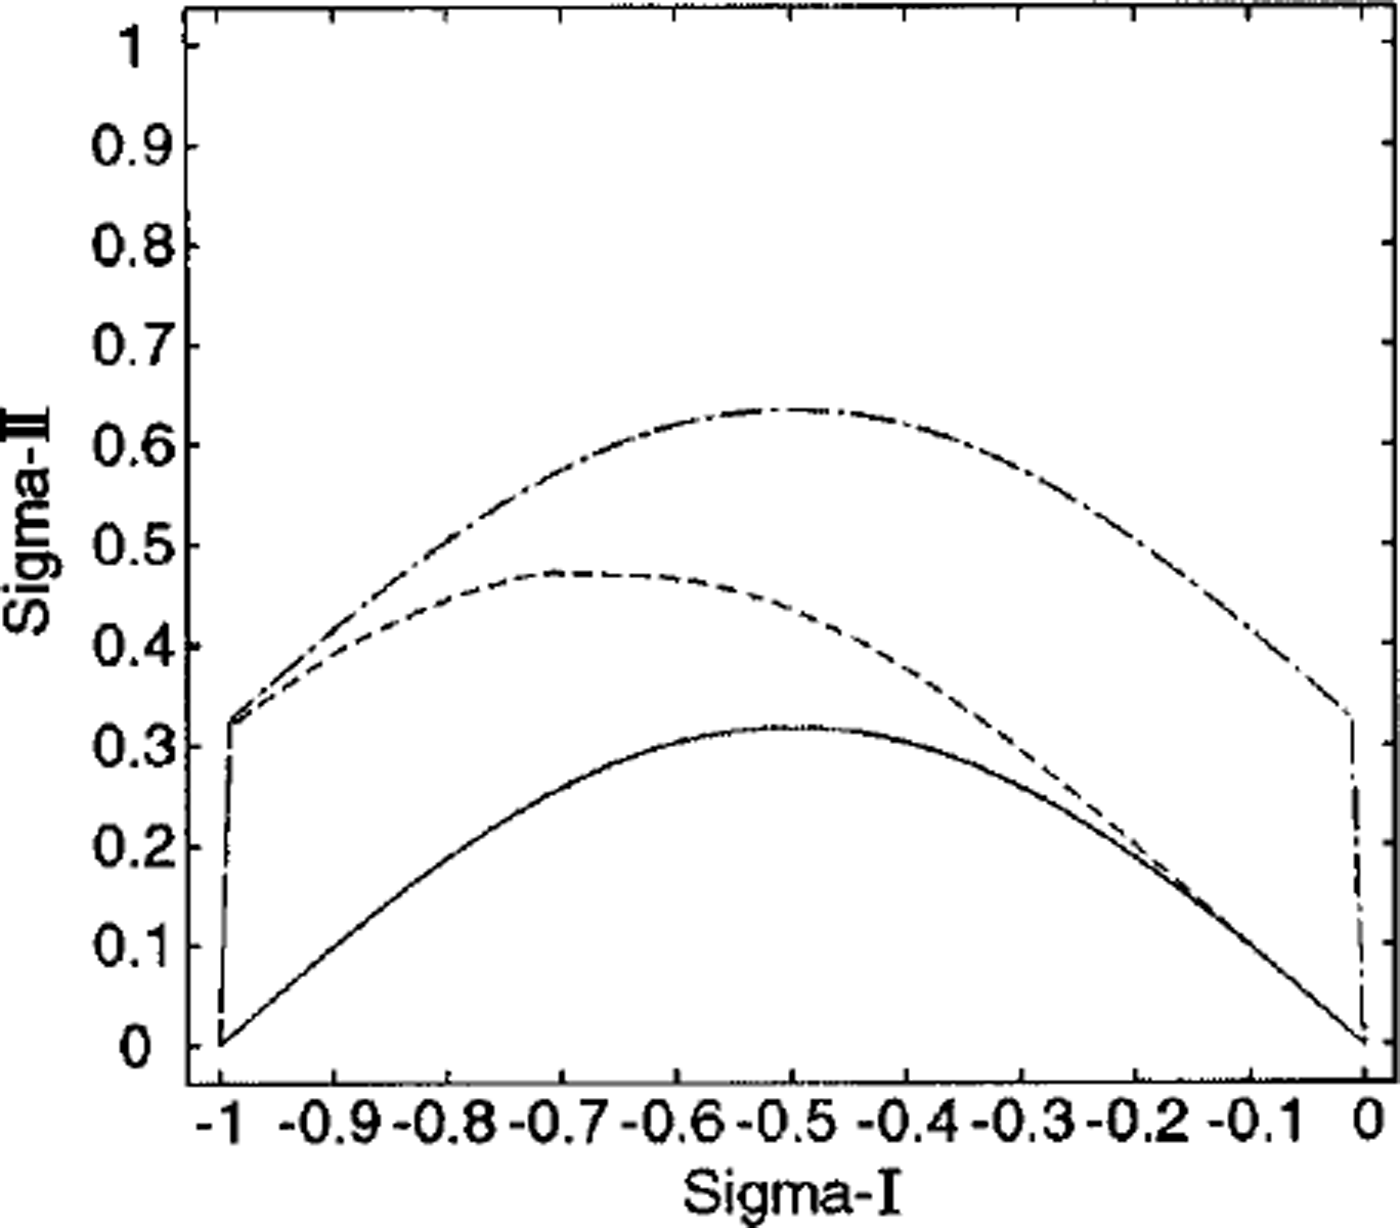
Fig. 4. The yield curves computed from isotropic geometry of the statistical ensemble of uniform squares. Solid line is for the case with k = 0. Dashed and dash-dotted lines correspond to the case with k = 0.5, with and without the simultaneous constraint on the closing (Equation (4) vs Equation (3)), respectively.
4. Concluding Remarks
A number of authors have contributed to the development of the energy argument for sea-ice dynamics (e.g. Reference Parmerter and CoonParmerter and Goon, 1972; Reference Coon, Maykut, Pritchard, Rothrock and ThorndikeGoon and others, 1974; Reference RothrockRothrock, 1975; Reference Thorndike, Rothrock, Maykut and ColonyThorndike and others, 1975; Reference CoonGoon, 1980; Reference HiblerHibler, 1980; Reference BratchieBratchie, 1984; Reference ThorndikeThorndike, 1987; Reference PritchardPritchard, 1988; Reference Stern, Rothrock and KwokStern and others, 1995; Reference Ukita and MoritzUkita and Moritz 1995). This work is an attempt to integrate key components of this development, including the plastic theory, the thickness distribution theory, the energetics of ridge formation and the isotropic random geometry of cracks and plates. Within the present framework, one can estimate the shape of the yield curve from statistical properties of the crack geometry, provided the parameter k is known. In particular, we find that in the absence of contributions from sliding (k = 0), the isotropic crack geometry leads to the sine-lens shape and that inclusion of sliding results in a teardrop shape. This change in the shape of the yield curve may be regarded as the effect of including shear ridge formation in the energetics.
Acknowledgements
The authors would like to thank the U. S. National Science Foundation for their support under grant DPP-8705181, and the Office of Naval Research Arctic Program for their support under contract N00014–91–J-1377. Frontier Research System for Global Change is a joint program supported by the National Space Agency of Japan and Japan Marine Science and Technology Center. We thank D. A. Rothrock and A. S. Thorndike for useful discussions, M. A. Morales Maqueda and an anonymous reviewer for many useful suggestions for improving the text, and T. Mikami for her assistance in graphics.


