


Introduction
Cover crops are noncash crops that can help improve soil health, reduce nutrient leaching, and reduce soil erosion, along with providing additional benefits such as weed suppression and harboring beneficial arthropods (Klonsky and Tourte Reference Klonsky and Tourte1997; Dabney et al. Reference Dabney, Delgado and Reeves2001). Cover crops are widely used in the row-crop agricultural systems in the Midwest (Sarrantonio and Gallandt Reference Sarrantonio and Gallandt2003). However, their adoption is not as widespread in horticultural crop production. Adopting cover crops have provided extensive benefits to some perennial crop production systems such as almonds in California (Wilson et al. Reference Wilson, Daane, Maccaro, Scheibner, Britt and Gaudin2022), apples in Washington (Pavek and Granatstein Reference Pavek and Granatstein2014), and organic citrus in California (Klonsky and Tourte Reference Klonsky and Tourte1997). Among the perennial fruit industries, citrus, specifically orange production, currently faces significant uncertainty in terms of sustainable production due to the Huanglongbing (HLB) or the citrus greening disease.
Although HLB has primarily affected the citrus industry in Florida, the threat of HLB has prompted citrus growers and state-specific agencies to take a multitude of steps to deal with HLB (Graham et al. Reference Graham, Gottwald and Setamou2020). Using cover crops in citrus groves could improve soil health, reduce weed growth, and improve the overall growing conditions that positively impact fruit quality and yield. Cover crop adoption, however, would depend on various factors including potential increases in production costs, profitability, actual tree improvement, and growers’ attitudes toward the practice. In this study, we estimate citrus growers’ willingness to pay (WTP) for cover crop adoption in orange production for two citrus producing states – Florida and Texas. We also analyze growers’ perceptions of using cover crops in their groves and study the factors that impact their WTP for cover crops.
There are substantial resources on the costs and benefits of adopting cover crops in row crop production systems. Given that such studies are not available for perennial fruit production systems such as citrus, growers’ concerns over the time it takes to plant cover crops, labor costs, and uncertainty with respect to economic returns of planting the crops are some of the reasons for its low adoption among horticultural crop growers (Magdoff and Van Es Reference Magdoff and Van Es2021). We develop and use a survey to gather information from citrus growers on their demographics, crop production practices, conservation practice adoption, and perceptions on cover crops. We use partial budgeting to estimate the per acre costs of adopting cover crops in orange production, incorporate these costs into the survey, and elicit growers’ WTP for cover crops using a double-bound discrete choice model. This avoids the problems associated with using arbitrary cost figures in contingent valuation (CV) methods. We find on average that growers from Florida are willing to pay $509.48/acre per year for adopting cover crops in orange production. This is substantially less than Texas growers, who are willing to pay more than $1000/acre per year to implement cover crops. We also find that owning a no-till planter, growing a variety of citrus crops, citrus acreage, and growers’ rankings of the perceived benefits of cover crops to be some of the factors that have significant impacts on growers’ WTP for cover crops.
Uncertainties related to cover crop adoption in perennial fruit production systems could outweigh the perceived benefits of cover crops among growers. Therefore, understanding WTP along with the factors that affect it will provide important insights which could be used by growers, researchers, and policy makers to promote and incentivize adoption of cover crops or similar conservation practices. Studies on WTP and grower perceptions on using cover crops, especially in citrus, do not exist, and our study will be the first of its kind.
In the next section, we provide background on cover crops and conservation practice adoption and discuss other relevant literature. This is followed by sections on data and methodology, result and discussion, and conclusion.
Background and literature review
Citrus production in Florida and Texas faces several challenges related to pests, soil quality, and weather fluctuations. While damages from freezes and water shortage are more common in Texas, pest population and soil quality are the major challenges for citrus producers in Florida. One of the biggest challenges to citrus production is HLB, or the citrus greening disease, that was first detected in Florida in 2005. HLB is an incurable disease caused by the Candidatus Liberibacter asiaticus (CLas) bacterium and is vectored by the Asian citrus psyllid. HLB has also impacted the citrus industry in Texas, although to a much lesser extent than in Florida (Graham et al. Reference Graham, Gottwald and Setamou2020).
HLB is responsible for widespread losses to the citrus industry in Florida and has also caused production costs to increase each year since 2005 (Moss et al. Reference Moss, Grogan, Farnsworth and VanBruggen2015). Fruits from HLB-infected trees are sour and bitter making them unsuitable for consumption. Between Florida’s 2006–2007 and 2010–2011 growing seasons, HLB-related losses were estimated at $4.51 billion in GDP and $8.62 billion in revenue (Hodges and Spreen Reference Hodges and Spreen2012) or nearly $1 billion per year (Farnsworth et al. Reference Farnsworth, Grogan, van Bruggen and Moss2014). Thus, reducing the impact of HLB is crucial for long-term sustainability of the citrus industry. Given that there is no natural cure for HLB, management practices to mitigate the effects of the disease are diverse with varying effectiveness. While there is no consistent management practice that could solve the HLB issue, management practices that improve soil quality, such as using cover crops, can lead to improved soil quality and tree health and allow growers to continue producing in HLB endemic conditions.
A general theme for fighting a disease in tree crop production is cultivating stronger trees that are more capable of fighting infection. Cultivar selection and breeding to develop a tree that is tolerant or resistant to the bacteria causing the disease is an ongoing goal for citrus researchers (Dutt et al. Reference Dutt, Barthe, Irey and Grosser2015). Until these cultivars are available, strategies to improve tree health are continually being studied and researchers are looking for solutions to a range of issues targeting each step in the citrus production process. Conversely, growers’ actions have been motivated by short- and long-term costs, farm location and size, and trust in the effectiveness of various solutions. Thus, disease management in citrus, particularly for HLB, is characterized by heterogeneous practices and inconsistent outcomes, which could deviate from the ideal management practices recommended by researchers.
Determining the best management practices or bundle of practices currently available for growers is critical for maintaining the citrus industry. The cost of implementing multiple strategies may be high. However, when compared to the economic impacts of citrus greening disease, the benefits may outweigh the risk (Alvarez et al. Reference Alvarez, Rohrig, Solís and Thomas2016). Cover crops could be a viable addition to the management practices that aim to improve the growing conditions of citrus trees and ameliorate the impacts of HLB and other pests in citrus groves.
Cover crops
Cover crops are planted primarily for their soil health benefits which in turn can help increase cash crop productivity. These crops are living groundcover and include numerous plant species (Hartwig and Ammon Reference Hartwig and Ammon2002). The main categories of cover crops are legumes, grasses, brassicas, and non-legume broadleaves, among which grasses and legumes are the most common (Arcuri Reference Arcuri2019). Different cover crops or mixes of cover crops provide different benefits to the soil and ecological conditions. Some mixes may help soil hold more moisture by preventing water from rapidly seeping down or by slowing the rate of evaporation, while others may improve drainage and aeration in the rooting zone. For example, nonlegume cover crops increase soil aggregation and carbon pools in soil, thereby increasing soil quality, while legume cover crops increase nitrogen pools in soil and increase its productivity (Sainju et al. Reference Sainju, Singh and Whitehead2002; Sainju et al. Reference Sainju, Whitehead and Singh2003).
Since cover crops are not typically adopted in perennial tree cropping systems, less is known about their exact impacts and benefits in production of citrus and other fruits (Castellano-Hinojosa et al. Reference Castellano-Hinojosa, Martens-Habbena, Smyth, Kadyampakeni and Strauss2022). There are studies on cover crops that are species and practice specific for use in citrus in Brazil (Balota and Auler Reference Balota and Auler2011; Oliveira et al. Reference Oliveira de, Oliveira de and Xavier da2016) and cannot be generalized to work in other citrus growing areas like Florida and Texas. Recent research in Florida suggests that within a year of planting cover crops, carbon and nitrogen availability were augmented through increased abundance of total bacteria, archaea, nitrogen(N)-fixation, nitrification, and denitrification genes (Castellano-Hinojosa et al. Reference Castellano-Hinojosa, Martens-Habbena, Smyth, Kadyampakeni and Strauss2022). These crops improve beneficial soil microbial activity and diversity, which positively affect soil organic carbon and total nitrogen (Castellano-Hinojosa and Strauss Reference Castellano-Hinojosa and Strauss2020). Cover crops planted in the citrus row middles have also been found to suppress weed density within a year of planting (Brewer et al. Reference Brewer, Strauss, Kanissery and Kadyampakeni2020). Citrus growers that have adopted cover crops also report positive impacts of cover crops on soil. For example, a grower found that a mix of cereals, grasses, legumes, brassicas, and broadleaves improved soil organic matter (SOM) in his citrus grove (Strauss et al. Reference Strauss, Kadyampakeni, Kanissery and Wade2019). Cover crops also provide savings through lower input costs. Farmers may be able to reduce fertilizer use, as some cover crops help preserve nitrogen and phosphorus levels (Maltais-Landry et al. Reference Maltais-Landry, Vital and Anderson2020), while others can limit herbicide use by reducing weeds (Clark Reference Clark2007).
Cover crops can be planted alongside perennial plants or can be used cyclically between annual seasons. Cover crops in citrus production are grown in the row middles with the under-canopy areas usually being treated with herbicides for weed management (Strauss et al. Reference Strauss, Kadyampakeni, Kanissery and Wade2019). Although cover crop seeds are usually broadcasted, growers have increasingly shifted toward using a no-till planter that increases the seeding rate of cover crops. Moreover, using a no-till planter for cover crops ensures that seeds are not accidentally broadcasted to the under-canopy areas of the grove which in turn can result in cover crops competing with citrus tree roots for nutrients.
The primary drawback with using cover crops is their initial cost which does not translate to returns in the first few seasons following their planting (Clark Reference Clark2019). Other problems include farmers’ knowledge on how to use them effectively and the availability of specialty equipment (such as a no-till drill/planter) for planting. Cover crops may promote biodiversity by attracting beneficial insects and potential predators that target harmful pests (Muma Reference Muma1961). However, they also carry the risk of becoming weeds – competing with tree crops for nutrition (Bugg and Waddington Reference Bugg and Waddington1994) due to improper management. Moreover, while pollen from cover crops could divert pests from tree crops, they could also increase the pest population (Bugg and Waddington Reference Bugg and Waddington1994). Thus, effective management of cover crops is difficult. However, this sustainable farming practice has grown rapidly in popularity in the past few decades in row as well as tree crop agriculture across the USA (Myers et al. Reference Myers, Weber and Tellatin2019). Although cover crops are not usually sold for revenue, they can increase profits over time by improving soil health and increasing yield. The effects of cover cropping accumulate over time, with measurable benefits typically observed 3–5 years after they are introduced. In some extreme cases, however, the benefits of cover crops can be noticed in the first year (Myers et al. Reference Myers, Weber and Tellatin2019). Thus, sustained long-term adoption of cover crops is required to realize the exact benefits they provide for sustainable citrus production.
Adopting cover crops as a conservation practice
Conservation practices are agricultural practices that are adopted by farmers and growers with the objective of increasing long-term sustainability of their farms. Practices such as no-till adoption, cover crop use, integrated pest management, precision agriculture, and nutrient management are adopted to improve soil health and environment with the objective of steady increases in yields and profitability over time (Wade et al. Reference Wade, Classen and Wallander2015).
Adoption of a conservation practice such as using cover crops rests on a multitude of factors that depend on the grower, cover crop species being adopted, objective for adoption, type of agricultural output that is being grown, and the nature of the benefits that the conservation practice provides. Behavioral factors that affect growers’ decisions are affected by growers’ cognitive factors, dispositional factors, and societal factors (Dessart et al. Reference Dessart, Barreiro-Hurlé and van Bavel2019). Dispositional factors such as age, personality, and resistance to change were found to be correlated with adoption of conservation practices (Prokopy et al. Reference Prokopy, Floress, Klotthor-Weinkauf and Baumgart-Getz2008; Sheeder and Lynne Reference Sheeder and Lynne2011). However, cognitive factors that shape how growers perceive an issue and make decisions are stronger determinants of adoption. Perceived risks and lack of knowledge of benefits are two cognitive factors that negatively affect cover crop adoption (Arbuckle and Roesch-McNally Reference Arbuckle and Roesch-McNally2015). Moreover, growers perceiving a conservation practice as having a higher risk would require higher adoption premiums (Wang et al. Reference Wang, Jin, Kasu, Jacquet and Kumar2019). Thus, availability of cost-share programs could increase adoption rates of different conservation practices Lichtenberg (Reference Lichtenberg2004). Risk attitudes toward adoption depend on knowledge, among other factors. As discussed earlier in this study, there is substantial research on cover crop benefits for grain farming. However, benefits of cover crops for growing citrus are currently being studied and the available initial results suggest positive impacts on soil health in citrus groves.
While conservation practices frequently provide both benefits to the environment (“stewardship”) and eventual economic benefits, the economic benefits are the more significant driving force behind the rate of adoption (Wang et al. Reference Wang, Jin, Kasu, Jacquet and Kumar2019). Thus, communicating to growers the potential benefits and cost savings from a conservation practice such as cover crops could increase adoption, especially since societal factors have historically been important for conservation practice adoption in citrus farming in Florida. A grower with significant knowledge on cover crop costs and benefits would thus consider potential savings such as costs of herbicides and mowing for weed management, fertilizers for increasing nutrient levels, irrigation costs due to the moisture retention properties of cover crops, and the associated labor costs, and increases in subsequent revenues for calculating their WTP for cover crops.
Knowler and Bradshaw (Reference Knowler and Bradshaw2007) tabulated frequencies of factors according to the number of studies in which they were found to have any significantly positive or significantly negative effects on conservation practice adoption. While the commonly considered variables such as education and age of the grower, as well as farm size, were found by several studies to have significant impacts on adoption practices, the number of studies finding these factors to be insignificant was much higher. However, factors such as extension or technical assistance, program participation, and awareness of environmental threats were found to have significantly positive impacts by a greater number of studies than those that found insignificant impacts. Thus, programs that directly address growers’ questions that stem from cognitive factors could succeed in increasing adoption rates. In addition to questions on demographics and farm characteristics, our survey also asks growers about their knowledge on cover crops and their perceptions and attitudes toward using cover crops. The results from the survey provide a snapshot of a grower’s dispositional and cognitive factors that affect their adoption of cover crops and their WTP for the practice.
Survey design and data collection
We develop and use a survey to gather information from citrus growers and use a double-bounded dichotomous choice model to measure WTP for cover crops. Our survey starts with questions on growers’ demographics, including whether and what type of citrus fruits they grow. The survey next asks whether the respondents used cover crops and elicits respondents’ levels of agreement or disagreement on benefits and drawbacks of using cover crops in citrus. Respondents also ranked benefits associated with using cover crops according to the inherent value that they provide to the grower.
For questions related to growers’ valuation of cover crops, respondents were asked if they would be willing to implement cover crops at no cost to them. If they answered “yes,” they moved on to the question representing the next part of the double-bound model, which adds an additional interval to explain a skew in data from respondents that are unwilling to implement at any price. The respondents were next asked whether they would be willing to implement cover crops at a “middle” price – a price that was semi-randomly generated. A follow-up question, with a “higher” or “lower” price (semi-randomly generated), was asked if the response to the first question was “yes” or “no,” respectively. There was one respondent that answered “no” to implementing cover crops at no cost but indicated that they had already adopted cover crops. We assigned our estimated price of cover crop adoption ($850/acre per year) to this respondent. In our survey design, respondents that answered no to adopting cover crops at no cost and had not adopted cover crops had their survey terminated.
We arrived at estimates of the semi-randomly generated prices from two sources. First, we obtained citrus budget items and figures for existing groves from Singerman (Reference Singerman2021).Footnote 1 The budgets served as benchmarks for typical costs of citrus production. Second, we obtained the total per acre costs of implementing cover crops from four anonymous growers who are using cover crops in their groves. The growers were early adopters of cover crops and had been using them for multiple years in their groves. They indicated that it took them several seasons before finding the exact mix of cover crop species, the optimum method of planting the seeds, management costs, and the termination method. This was especially true for Florida since the citrus growing regions in the state are primarily sandy. Thus, the growers tried and tested various mixes of legume and non-legume seeds before choosing the right mix for increasing both SOM and nitrogen levels in the soil. We took a 4-year average of the costs of using cover crops for the four growers. We found that it cost an average of $500/acre for cover crop seeds for the growers. Costs varied by the type of cover crop species used.
The growers indicated that for terminating cover crops, they mowed them and left the residues to decompose and mix with the soil. For mowing costs, we spoke to the growers and referred to the “Central Florida (Ridge) and Indian River-Southwest Florida Citrus Custom Rate Charges” report that is published in Singerman and Aiya (Reference Singerman and Aiya2022). It costs on average $14/acre to mow an 8–12 feet wide row middle in 2021–2022. This translated to $28/acre for two applications required per year. In addition to mowing, management costs included costs of renting a seed broadcaster or a no-till planter, an ATV, and scouting for pests. Thus, the total management and cover crop termination cost was $100/acre per year. Additional labor and supervision cost an additional $250/acre per year. Including additional labor costs and costs of cover crop management and termination, we found that the total initial cost of implementing cover crops was $850 per acre per year. For the survey, we set the “middle” price to be randomly generated within the $600–$800 interval, while “low” and “high” prices were randomly generated from the $100–$500 and $900–$1200 price intervals. These prices were randomly generated for each respondent by Qualtrics.
After measuring the respondent’s WTP, the survey asks additional demographic, practice, and behavioral questions. These questions captured management practices, involvement in conservation programs, and overall farm diversity. Responses pertaining to experience in citrus farming, availability of credit, percentage of land rented, and farm size were also requested. Finally, to eliminate duplication and allow for follow-up questions, farmers were asked for contact information, with promised confidentiality.
Survey respondents were recruited through various channels beginning in early 2021: Qualtrics, University of Florida Citrus Extension Agents’ email listservs, cold calling groves and nurseries, the Indian River Citrus League email listserv, the California Citrus Research Board e-newsletter, and in-person interviews at the 2021 Citrus Show in Ft. Pierce, Florida. Data collection ended on November 2, 2021. The response rate to our survey was 35%, and in total, we received responses from 359 growers from Florida, Texas, California, and Georgia, of which 173 identified themselves as citrus growers. Samples from California and Georgia were not representative of commercial citrus producers and we excluded them from our study. After removing inconsistent and incomplete observations, we had 79 observations with 59 from Florida and 20 from Texas.
Estimation strategy
Using cover crops in citrus is not common, and to our knowledge, no study has tried to elicit WTP for cover crops in citrus in the USA. Given the direct and indirect benefits from using cover crops and the lack of published estimates for costs of adopting them, we used the CV method to estimate WTP for growers. In this approach, the estimates of the respondents’ “valuation” of an environmental good or a conservation practice is “contingent” upon the hypothetical market or the scenarios that we present to them (Hanemann Reference Hanemann1994; Carson and Hanemann Reference Carson and Hanemann2005). To elicit respondents’ WTP, we used the double-bounded dichotomous choice approach. This approach starts with a simple dichotomous choice question, which is followed by another set of questions that is contingent upon the information provided in the earlier question. The double-bounded CV approach yields more efficient estimates of WTP than the single dichotomous choice model, in which only a single question is asked (Hanemann et al. Reference Hanemann, Loomis and Kanninen1991).
A respondent i’s WTP for cover crops can be assumed to be related to their demographic as well as grove information through the relationship in equation 1, where ${z_i}$
is the vector of explanatory variables, and
${z_i}$
is the vector of explanatory variables, and ${u_i}$
is the error term that is assumed to be normally distributed. We do not directly observe
${u_i}$
is the error term that is assumed to be normally distributed. We do not directly observe $W{P_i}$
and instead know whether they fall in the specific price intervals created in the survey.
$W{P_i}$
and instead know whether they fall in the specific price intervals created in the survey.
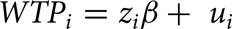 $$WT{P_i} = {z_i}{\rm{\beta }} + {\rm{\;}}{u_i}$$
A respondent first responds either “yes” or “no” to whether they would adopt cover crops at no cost. If they answered affirmatively, they are presented with a pair of dichotomous choice questions, the latter of which is dependent on the response to the earlier question. These dichotomous choice questions require either “yes” or “no” responses to hypothetical costs of implementing cover crops. Given that a respondent can only progress to the double-bounded dichotomous questions if they answer “yes” to implementing cover crops at no cost, the four possible outcomes for the pair of dichotomous questions are (yes, yes), (yes, no), (no, yes), or (no, no). Let $y_i^1$
represent the response to the first question in the double-bounded model (randomly generated middle price),
$y_i^1$
represent the response to the first question in the double-bounded model (randomly generated middle price), $y_i^2$
represent the response to the second question in the double-bounded model (which is either high or low price based on the response to the previous question),
$y_i^2$
represent the response to the second question in the double-bounded model (which is either high or low price based on the response to the previous question), ${t_1}$
represent the first price, which is the middle price, and
${t_1}$
represent the first price, which is the middle price, and ${t_2}$
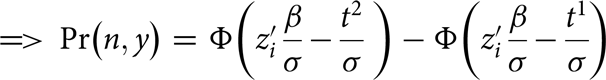
represent the second price, which could be either high or low price depending on the response to the first part. Then, for a respondent whose WTP lies in the interval that is greater than or equal to the middle price or less than the high price in the double-bounded dichotomous choice model, the following is the probability of a potential outcome from the double-bounded discrete choice model (the equations are adopted from Lopez-Feldman (Reference Lopez-Feldman2012)):
${t_2}$
represent the second price, which could be either high or low price depending on the response to the first part. Then, for a respondent whose WTP lies in the interval that is greater than or equal to the middle price or less than the high price in the double-bounded dichotomous choice model, the following is the probability of a potential outcome from the double-bounded discrete choice model (the equations are adopted from Lopez-Feldman (Reference Lopez-Feldman2012)):
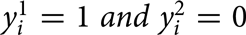 $$y_i^1 = 1\;and\;y_i^2 = 0$$
 $$ = \gt \Pr \left( {y,n} \right) = r\left( {{t^1} \le WTP \lt {t^2}} \right)$$
 $$ = \gt \Pr \left( {y,} \right) = \Pr \left( {{t^1} \le z_i^{\prime}\beta + {u_i} \lt {t^2}} \right)$$
 $$= \gt \Pr \left( {y,n} \right) = {\rm{\Phi }}\left( {z_i^{\prime}{\beta \over \sigma } - {{{t^1}} \over \sigma }\;} \right) - {\rm{\Phi }}\left( {z_i^{\prime}{\beta \over \sigma } - {{{t^2}} \over \sigma }} \right)$$
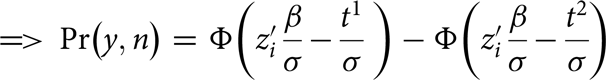
Similarly, when the WTP is greater than or equal to the high price in the double-bounded dichotomous choice model, the probability of the outcome is shown in equation 3. The responses thus comprise the right-censored data.
 $$y_i^1 = 1\;and\;y_i^2 = 1$$
 $$ = \gt \Pr \left( {y,y} \right) = Pr\left( {WTP \gt {t^1},\;WTP\; \ge {t^2}} \right)$$
 $$ = \gt \Pr \left( {y,y} \right) = \Pr \left( {z_i^{\prime}\beta + {u_i} \gt {t^1},z_i^{\prime}\beta + {u_i} \ge {t^2}} \right)$$
 $$ =\gt \Pr \left( {y,y} \right) = {\rm{\Phi }}\left( {z_i^{\prime}{\beta \over \sigma } - {{{t^2}} \over \sigma }} \right)$$
When the WTP lies in an interval that is less than the middle price but greater than or equal to the lower price, equation 4 represents the probability of the outcomes.
 $$y_i^1 = 0\;and\;y_i^2 = 1$$
 $$= \gt \Pr \left( {n,y} \right) = Pr\left( {{t^2} \le WTP \lt {t^1}} \right)$$
 $$ = \gt \Pr \left( {n,y} \right) = \Pr \left( {{t^2} \le z_i^{\prime}\beta + {u_i} \lt {t^1}} \right)$$
 $$ = \gt \Pr \left( {n,y} \right) = {\rm{\Phi }}\left( {z_i^{\prime}{\beta \over \sigma } - {{{t^2}} \over \sigma }\;} \right) - {\rm{\Phi }}\left( {z_i^{\prime}{\beta \over \sigma } - {{{t^1}} \over \sigma }} \right)$$
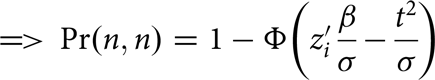
Finally, equation 5 represents the probability of outcomes when the observed WTP is less than the middle as well as the lower price. These responses are thus the left-censored data, that is, the responses for which the lower bound is unknown.
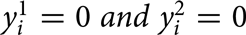 $$y_i^1 = 0\;and\;y_i^2 = 0$$
 $$ = \gt \Pr \left( {n,n} \right) = Pr\left( {WTP \lt {t^1},\;WTP\; \le {t^2}} \right)$$
 $$ = \gt \Pr \left( {n,n} \right) = \Pr \left( {z_i^{\prime}\beta + {u_i} \lt {t^1},z_i^{\prime}\beta + {u_i} \le {t^2}} \right)$$
 $$ = \gt \Pr \left( {n,n} \right) = 1 - {\rm{\Phi }}\left( {z_i^{\prime}{\beta \over \sigma } - {{{t^2}} \over \sigma }} \right)$$
The resulting maximum likelihood equation was estimated through the interval regression function in Stata. The interval regression function estimates the probability of a latent variable, in our case, $WT{P_i}$
in equation 1, belonging to specific intervals. Using the regression coefficients, we predicted both the mean and median WTPs (Yu et al. Reference Yu, Gao and Zeng2014). We also constructed normal distribution-based 95% confidence intervals around means and medians. We used bootstrap standard errors with 200 replications to construct the confidence intervals (Cawley Reference Cawley2008).
$WT{P_i}$
in equation 1, belonging to specific intervals. Using the regression coefficients, we predicted both the mean and median WTPs (Yu et al. Reference Yu, Gao and Zeng2014). We also constructed normal distribution-based 95% confidence intervals around means and medians. We used bootstrap standard errors with 200 replications to construct the confidence intervals (Cawley Reference Cawley2008).
We ran separate regressions for Florida and Texas. This is because the citrus production systems for the two states are different: growers in Texas primarily produce organic oranges, while Florida growers are less likely to produce organic oranges.
Data
Out of the 173 respondents who identified as citrus growers, several responses were unusable because they were partially complete. We dropped responses from growers who had less than 0.5 acres of planted citrus and those that did not participate in our valuation method. Respondents were asked to provide the zip codes of their groves, which we used to identify their state. One respondent from Florida answered “yes” when asked whether they were currently using cover crops and “no” to whether they would be willing to implement cover crops at $0 cost. We assigned the benchmark price of $850 for cover crops to the upper and lower bounds for that respondent. We also dropped one response from Florida who was not currently using cover crops in citrus and did not want to implement them at $0 cost. Our final data consist of 79 observations – 59 from Florida and 20 from Texas.
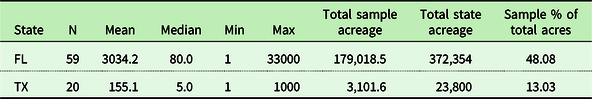
Table 1 gives the summary statistics of orange acreage by state from the sample. The average acreage for a grower from the Florida sample is 3,034.2 acres, while that for Texas respondents is 155.1 acres. However, the median acreage is 80 acres for respondents from Florida and only 5 acres for those from Texas. Thus, the distribution of citrus acreage is skewed to the right for respondents for the two states. Based on total orange acreage and the number of orange groves in the Census of Agriculture, 2017, we estimated that the average orange grove size is between 187 and 199 acres for Florida. These include both commercial and non-commercial groves. The respondents to our survey were primarily commercial growers with larger groves. Moreover, if we exclude the outlier groves that have 10,000 acres or more under citrus, the average grove size is less than 400 acres for the Florida sample. For the Texas sample, the average grove size of 155.1 acres was higher than the estimated average grove size of 23.7 acres from the 2017 Census of Agriculture. However, 80% of the respondents have less than 100 acres of grove on average. Table 1 also gives the total orange acreage from the sample and the total orange acreage for each state, where the latter are USDA 2019–2020 estimates. Respondents from Florida represented a little more than 48% of the total orange acreage in the state, and respondents from Texas represented about 13% of the total orange acreage in their state. Thus, our sample is a strongly representative sample for Florida in terms of citrus acres.
Table 1. Orange acreage summary statistics (state acreage data from USDA 2019–2020)
In our sample, on average 3/4 of the area of a grove is covered with mature citrus trees, that is, by citrus trees that are 3 years or older. However, while 82% of citrus acreage was covered with mature trees in Texas, 76% of the citrus acreage were covered with mature trees in Florida, on average. In terms of tree density, most of the groves across the two states had 100–200 trees per acre, and between 30 and 35% of the groves had 200–300 trees per acre. Table 2 gives the summary statistics of the variables that we used in our WTP analyses.
Table 2. Summary statistics of key variables
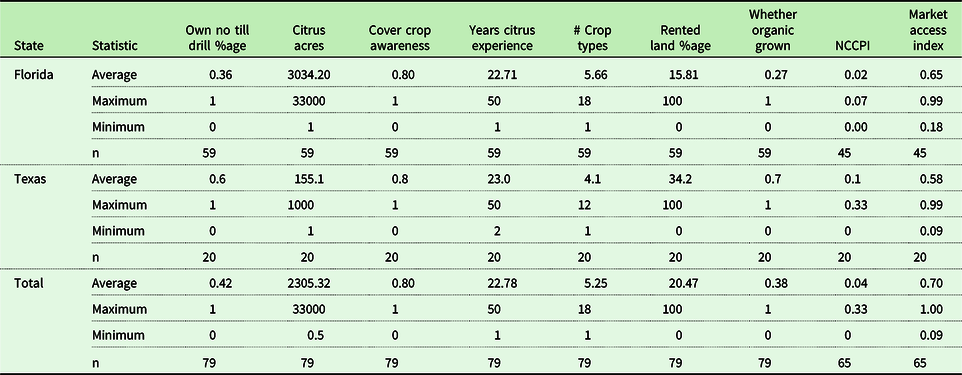
Owning a no-till drill/planter could be an indicator of a grower’s inclination toward adopting a technology for conservation practice. Moreover, the ownership of a no-till drill is inherently exogenous to WTP for cover crops and is also included in our analyses to understand growers’ experience with specialized machinery. We hypothesize that ownership of a no-till drill would have a significant positive effect on growers’ WTP for cover crops. In our sample, 36% of growers in Florida own a no-till drill compared to 60% in Texas.
We include awareness of using cover crops in citrus in our analyses to check whether a grower who is aware of cover crops has significantly different WTP for cover crops than one who is not aware. On average, 79–80% of the respondents were aware of cover crops across both states. To maximize response rates, the survey did not ask questions on personal information. Instead, we use years of experience in citrus farming as a proxy for age as well as knowledge of citrus farming, and farm size instead of income in our analyses. On average, Florida and Texas growers had similar years of experience growing citrus. Farm size is strongly correlated with citrus acreage. Therefore, we used the latter since our survey is concerned about cover crop usage in citrus.
We include the number of crop types that a grower produces as an indicator of the amount of diversity within a grove. This could represent growers’ adaptability and stake in one crop. A grower from Florida on average had greater crop diversity than one from Texas. The primary benefits from using cover crops, such as increased SOM and nutrients, and consequent savings from reduced fertilizer use, take time to accrue. We included the percentage of a grower’s citrus grove that is planted on rented land as an indicator of how much an average grower may be willing to personally gain from long-term investments that enhance soil and crop quality. Roughly 16% of the sample citrus acreage in Florida is on rented land. This figure is much lower than Texas’ 34.2%.
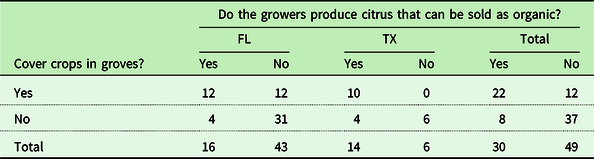
Out of the 59 respondents in Florida, 24 respondents or roughly 40% of the sample were using cover crops in citrus, while 50% of the respondents in Texas were using cover crops in their groves (Table 3). Using cover crops in citrus is more common among growers that also grow organic citrus, with 12 out of 16 organic producers in Florida and 10 out of 14 organic producers in Texas using cover crops. Growing organic citrus is prevalent among growers in Texas, where 70% of the growers produced organic citrus as well. However, in Florida, only 27% of the growers produced organic citrus. Overall, 30 out of 79 respondents also produced organic citrus. Among growers that were not growing organic citrus, there was no cover crop usage for those in Texas, while 28% of such growers in Florida used cover crops.
Table 3. Cover crop use by respondents
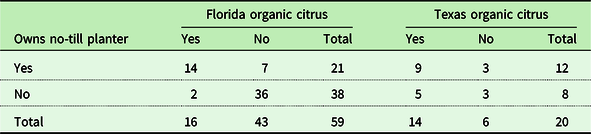
Growers that grew organic citrus were also more likely to own a no-till planter than those who did not grow organic citrus (Table 4). This relationship is significant for Florida since we reject the null hypothesis of independence between the two variables using a chi-square test [chi2 test statistic (1) = 10.72, pr. = 0.001]. The relationship is however not significant for respondents from Texas. Therefore, we did not include the status of organic production in the regression specifications for Florida.
Table 4. No-till planter ownership and organic citrus production
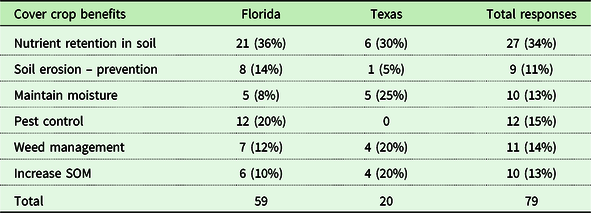
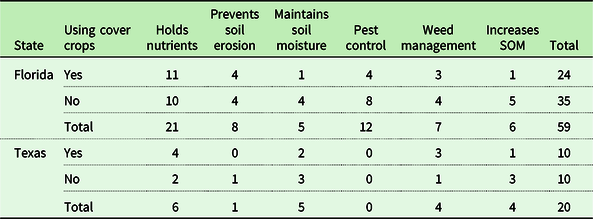
Respondents were asked how they ranked potential benefits from using cover crops. Table 5 shows the state-wide distribution of benefits that were ranked 1 by the respondents. Most of the respondents – 36% from Florida and 30% from Texas – ranked nutrient retention in soil as the most important benefit that cover crops would provide. Also, 25% of the respondents from Texas indicated that maintaining soil moisture was the most important benefit of cover crops, while 20% of respondents from Florida ranked pest control as the most important benefit from using cover crops.
Table 5. State-wide distribution of benefits that were ranked 1 by growers. Percentages given in parentheses
Most of the respondents from Florida that were using cover crops ranked nutrient retention as the number one benefit of using cover crops (11 out of 24). Out of the 35 respondents in Florida that were not using cover crops, 10 ranked nutrient retention and 8 ranked pest control as the most beneficial outcome of using cover crops (Table 6). Although the distribution of the number 1 ranked benefits varies by status of cover crop adoption, we did not find any significant relationship between the two for either Florida or Texas (Fisher’s exact = 0.592 and 0.505 for FL and TX, respectively). In our regression specifications for Florida, we included the highest ranked perceived benefit of cover crops for each respondent. However, we did not include the ranked 1 perceived benefits in the regression specifications for Texas because the number of observations in the Texas sample is only 20 and adding the perceived benefits would require estimating coefficients for five additional variables.
Table 6. Distribution of growers by their status of cover crop use and their highest ranked perceived benefits of cover crops
In addition to variables obtained from our survey, we also included a soil quality indicator and an index of market access in the regression models. The market access index and the index of soil quality are geospatial data sets that are obtained in the form of gridcells. For market access, we used Verburg et al. (Reference Verburg, Ellis and Letourneau2011)’s market accessibility index. The index is estimated by combining travel times to major cities, ports, and towns and accounts for a region’s topography and other physical characteristics. The extracted index ranges from 0 to 1, with 1 being the closest to markets. The data are in 5 arcminute resolution which roughly translate to an area of 74.49 sq. km. in Florida. Since the market accessibility index data are in the form of gridcells, we took the set of gridcells for Florida and Texas and mapped the centroids of the growers’ grove zip codes, which we obtained from our survey, to the gridcells. For soil quality, we used the National Commodity Cropland Productivity Index, NCCPI as the indicator. To be precise, we used cropland weighted NCCPI, in which we weighted NCCPI by the proportion of cropland obtained from USDA’s Cropland Data Layer (CDL). We obtained the NCCPI data from USDA-NRCS’ Gridded Soil Survey Geographic (gSSURGO) database. The index divides soil quality based on several attributes such as moisture, soil carbon content, weather, and crop type and classifies them according to the unique combinations of the attributes. The index ranges from 0 to 1 indicating low soil to high soil productivity. NCCPI is a geospatial data product at 10 m resolution provided by gSSURGO. We aggregated the 10 m × 10 m pixels to 30 m × 30 m pixels, which is the resolution at which CDL data are available and multiplied them by the cropland proportion in the 30 m × 30 m CDL pixels. We combined 2019 gSSURGO data with cropland proportions from 2017 CDL data. Next, we aggregated the combined 30 m × 30 m gridcells to 5 arcminute-level gridcells, which we used in our analysis.
Grower reported zip codes for groves varied in size. Moreover, the distribution of respondent zip codes is not uniform across the citrus growing regions of the two states. Therefore, it is possible that some of the zip code centroids were located at the border of two or more 5 arcminute gridcells. For such respondents, we took the mean of the accessibility index and the soil quality index. It is also possible that there are multiple respondent zip codes within a particular gridcell. For such observations, the cropland weighted NCCPI and the market accessibility index had equal values. Overall, we were able to match 45 respondents from Florida and all 20 respondents from Texas to the 5 arcminute gridcells used in our study. To keep the locations and identities of our respondents confidential, we do not show a distribution of respondents by zip codes, nor do we explicitly show them on a map. In total, there were 51 unique gridcells in which 65 zip codes of the respondents were located. Table 7 gives the state distribution of unique gridcells by the number of respondents in them. Florida has 1 gridcell with 4 respondents in it, and 2 gridcells with 3 respondents in each of them, and 4 gridcells with 2 respondents in each gridcell. Texas has 3 gridcells with 2 respondents in each of them. In total, there were 41 respondents that are mapped to unique gridcells.
Table 7. State-wide number of gridcells by number of respondents located in them
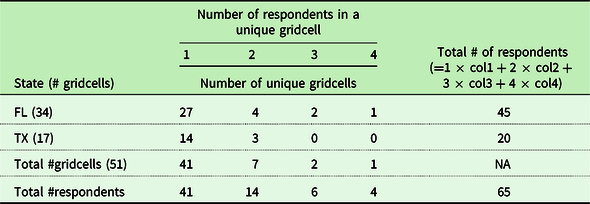
The average NCCPI for growers in Florida is 0.02 and for Texas growers it is 0.1 (Table 2). However, the market accessibility index shows a reverse trend, with growers in Florida having higher index on average at 0.65 followed by those in Texas at 0.58. There is possible negative correlation among the two variables, which we discuss in the results and discussion section.
Our survey included additional questions such as access to credit, soil health, and agricultural practices that had either a low response rate or were correlated with other variables that we use in our model.
Results and discussion
In our initial regression model, we combined samples for Florida and Texas and included fixed effects for one of the states. In doing so, we assumed that the error term had the same distribution for both states. The citrus production systems for the two states are, however, different, and thus the unobserved effects would be different across their samples. Therefore, we ran separate regressions for samples from Florida and Texas. We present the results from the combined model in the appendix Tables A1 and A2.
Table 8 shows regression results for four specifications for Florida. Among the survey questions, owning a no-till drill had the highest effect on the WTP for growers in Florida. The number of crop types also had significant positive effects on WTP. This implies that with more crop diversity, a grower is willing to pay a higher price for cover crop adoption. However, this effect was not significant when we controlled for market accessibility index and NCCPI. The market accessibility index had a significant positive effect on the respondents’ WTP, implying that growers with better connectivity to markets had higher WTP. Regarding the respondents’ rank of attributes, we also included the highest ranked perceived benefit of cover crops in our specifications. Respondents’ number 1 perceived benefits of soil nutrient retention and erosion control had significant positive marginal effects on their WTP. However, these effects were not significant when the exogenous market accessibility index and NCCPI were included in the model. Although the effect NCCPI was not significant, we found that when controlling for the soil productivity of the gridcells where respondents’ groves were located, their ranked 1 perceived benefit in terms of soil nutrient retention and erosion control did not have significant impacts on their WTP.
Table 8. Regression results from interval regression for WTP for Florida samples
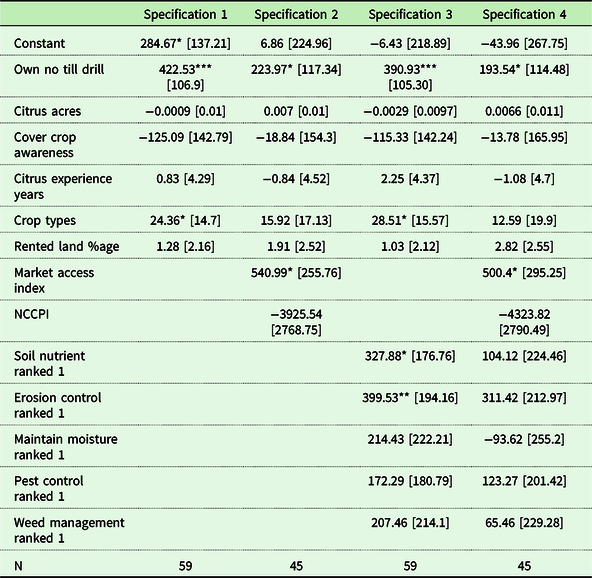
Note: For cover crop benefits ranked 1, increase in soil organic matter is the base level in the 3rd and 4th regression specifications.
***, **, and * indicate the significance levels at 1%, 5%, and 10%, respectively.
The median and mean WTP for cover crops for growers from Florida are given in Table 9. The median WTP for cover crops varied from $400.57/acre per year to 465.74/acre per year. The mean WTP for cover crops varied from $476.27/acre per year to $509.51/acre per year. The difference between the median and the mean WTP reduced when we included the geospatial covariates, while the difference was the highest for the model with the least number of covariates. Including the number 1 perceived benefit of cover crops yielded the highest median WTP of $465.74/acre per year and a mean WTP of $509.48/acre per year. We consider WTP estimates from the 3rd regression specification as our primary estimates since this model included growers’ perceived number 1 benefits of cover crops in addition to other questions from the survey while not losing observations due to the inclusion of additional geospatial variables.
Table 9. Median and mean WTPs with bootstrapped normal distribution-based 95% CI for Florida (using regression outputs from Table 8)
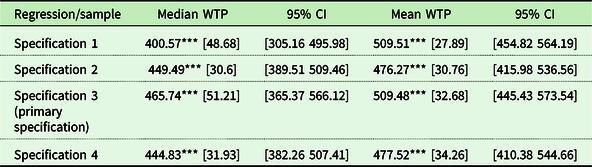
Note: *** indicates the significance level at 1%.
We present the results for two regression specifications for Texas in Table 10. Unlike the results for the Florida samples, no-till planter adoption did not have significant effects on growers’ WTP. Moreover, growing organic citrus also did not have significant impacts on growers’ WTP. The number of citrus acres had a significant negative effect on WTP of growers, while percentage of grove that is rented had positive effect on their WTP. We also controlled for exogenous factors that could impact the growing conditions and thus the respondents’ WTP. We did not include both market access index and NCCPI in our regression specification for the Texas sample. This was because the two variables had a Pearson correlation coefficient of -0.75. Moreover, among the two variables, we did not include NCCPI since its data were skewed right unlike market access index which was not skewed. We did not find a significant impact of the accessibility index on the respondents’ WTP.
Table 10. Regression results from interval regression for WTP for Texas
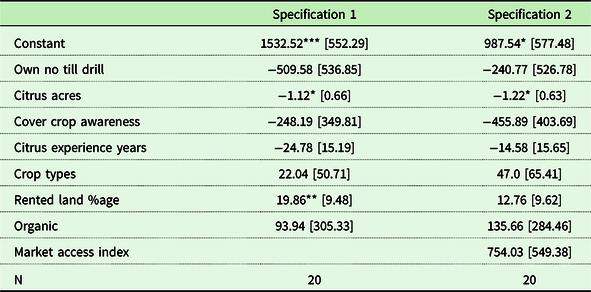
Note: ***, **, and * indicate the significance levels at 1%, 5%, and 10%, respectively.
The median WTP for cover crops for growers from Texas was $1203.76/acre per year and $1236.81/acre per year with the latter when we controlled for market accessibility index (Table 11). The mean WTP was $1118.68/acre per year and $1114.39/acre per year for the two specifications, respectively. We consider WTP estimates from the 2nd regression specification as our primary estimates since the 2nd model included an additional geospatial covariate.
Table 11. Median and mean WTPs with bootstrapped normal distribution-based 95% CI for Texas (using regression outputs from Table 10)
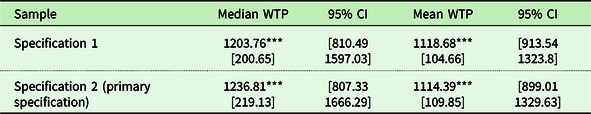
Note: *** indicates the significance level at 1%.
The standard errors for the WTP estimates for the Florida sample are substantially less than those for Texas. This could be a result of the larger and more representative sample for Florida, and because growers’ responses may not have been very different from each other. The WTP estimates for the Florida sample were more credible than those for Texas due to the spatial distribution of the growers that was more representative of actual grove locations.
Growers that adopted cover crops before the survey could be better informed about the costs of cover crop adoption in citrus production than those who did not use cover crops. For example, adopters of cover crops would have information on the appropriate mixes of cover crop species, their seed costs, management costs, and costs of terminating cover crops. We tested for difference in mean estimated WTP for cover crops between the two groups. We found significant differences in the mean WTP between the two groups for both Florida and Texas. Moreover, growers that had adopted cover crops had higher WTP for cover crops than those who did not (Table 12). A higher WTP indicates that growers that were using cover crops were probably better informed about the savings from cover crops through experience and were willing to pay the additional premium to adopt cover crops than those that were not cover crop adopters at the time of the survey. Thus, the differences of $212.78/acre and $457.61/acre in WTP between the two types of growers in Florida and Texas, respectively, account for the information on the costs and savings of cover crops that adopters of cover crops have.
Table 12. Test of difference in mean WTP between respondents that are using cover crops and those that are not using cover crops
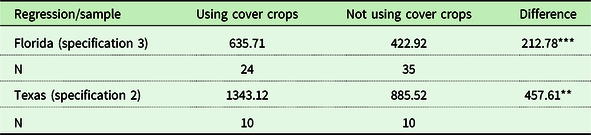
Note: *** and ** indicates the significance level at 1% and 5%, respectively.
Given that all respondents from Texas that used cover crops were organic growers (Table 3) and for Florida there is a strong correlation between no-till planter ownership (a significant variable) and organic production, we examine the relationship between growers’ status of organic production and their WTP. We found significant difference in mean WTP for cover crops between growers who grew organic citrus as well and those who did not grow organic citrus for respondents in Florida (Table 13). In the regression results for Florida, ownership of a no-till planter had the largest positive impact on growers’ WTP among the covariates from the survey. Since organic growers were more likely to own a no-till planter, the difference in the two average WTP was significant and large. We did not find significant differences for growers in Texas.
Table 13. Test of difference in mean WTP between respondents that grow organic citrus as well and those that do not grow organic citrus
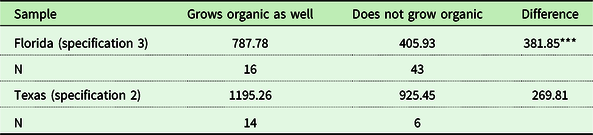
Note: *** indicates the significance level at 1%.
Conclusion
In this study, we provide credible estimates for WTP for growers, especially those from Florida. Our sample from Florida represents almost half of the total citrus acreage in the state. Controlling for demographic, production, farm level, as well as geospatial indicators, Florida growers on average are willing to pay $509.48/acre per year for adopting cover crops. The median WTP is $465.74/ acre per year. Owning a no-till planter had significant positive marginal effect on WTP for Florida growers. Thus, prior investment in technology that is required for cover crops is an important determinant of a grower’s willingness to adopt cover crops. Moreover, growers’ number 1 ranked perceived benefits of cover crops had varying impacts on their WTP. Soil nutrient retention and erosion control had significant positive impacts on WTP. Among the two geospatial variables included in our specifications for Florida, market accessibility had strong positive impacts on WTP. We provide estimates of WTP for citrus growers from Texas as well. The median WTP for Texas growers is $1236.81/acre per year and the mean WTP is $1114.39/acre per year. Although our sample represented around 13% of the total citrus acreage in Texas, we have low sample size. Additional responses from those states would benefit future estimations of WTP for growers from those states.
To our knowledge, our study is the first of its kind to provide estimates of growers’ WTP for adopting cover crops in citrus production or in the production of any horticultural crops. Moreover, by combining survey data with geospatial data, we control for both grove-specific and region-specific characteristics. Among the various reasons for cover crop adoption in citrus production, we find that benefit to soil nutrition has been ranked as the top reason by majority of the growers. Better soil health and growing conditions translate to healthier trees, as evidence suggests, which in turn could increase yields and fruit quality. Given that the citrus industry faces several challenges, such as HLB, our study attempts to inform citrus growers and researchers about the incentives and dis-incentives for cover crop adoption and about how much growers would be willing to pay for such a conservation practice in citrus.
Data availability statement
The data used in this paper are primary data that are based on a survey of citrus growers. The participants of our survey did not agree for their data to be shared publicly. Therefore, supporting data are not available.
Funding statement
This work was partially funded by USDA-NIFA Multistate Hatch project W4133, “Costs and Benefits of Natural Resources on Public and Private Lands: Management, Economic Valuation, and Integrated Decision-Making” and the Citrus Research Development Foundation project 18-059C, “Citrus Row Middle Management to Improve Soil and Root Health”.
Competing interest
The authors declare that they have no known competing financial interests or personal relationships that could have appeared to influence the work reported in this paper.
APPENDIX A
Table A1. Combined model – Regression results from interval regression for WTP

Note: *** and ** indicate the significance levels at 1% and 5%, respectively.
Table A2. Combined model – Median and mean WTP’s with bootstrapped normal distribution-based 95% CI (using regression outputs from Table A2)

Note: *** indicates the significance level at 1%.


 Open access