


Introduction
Overexploitation of natural resources and expansion of agriculture are the main threats to biodiversity (Maxwell et al., Reference Maxwell, Fuller, Brooks and Watson2016). Hunting is an important driver of the growing global biodiversity crisis (Ripple et al., Reference Ripple, Abernethy, Betts, Chapron, Dirzo and Galetti2016): in the tropics, densities of mammal populations, which are the primary targets, have declined by a mean of 83% in areas subject to hunting (Benítez-López et al., Reference Benítez-López, Alkemade, Schipper, Ingram, Verweij, Eikelboom and Huijbregts2017).
The conservation of game species relies not only on the quantification of hunting intensity but also on the understanding of its drivers (Torres et al., Reference Torres, Morsello, Parry, Barlow, Ferreira, Gardner and Pardini2017). There are several determinants of hunting pressure in a region, including cultural background (Fa et al., Reference Fa, Currie and Meeuwig2003) and factors related to food security and subsistence of communities (Brashares et al., Reference Brashares, Arcese, Sam, Coppolillo, Sinclair and Balmford2004; Damania et al., Reference Damania, Milner-Gulland and Crookes2005). Ultimately, however, hunting is limited by prey availability (Fa et al., Reference Fa, Currie and Meeuwig2003, Reference Fa, Farfán, Marquez, Duarte, Nackoney and Hall2014).
The vertebrates of the Amazon have been hunted for at least 11,200 years, since the arrival of the first Paleoindians in the region (Roosevelt et al., Reference Roosevelt, da Costa, Machado, Michab, Mercier and Valladas1996). However, human settlements in the Amazon have changed through time, with an increasing total population size and diversity of settlement types (e.g. Indigenous tribes, settler communities, urban areas). In Brazil, traditional communities are defined by specific characteristics, among which is that they ‘occupy and use natural territories and resources as a condition for their cultural, social, religious, ancestral and economic reproduction’ (Decree no. 6,040, 7 February 2007). Extraction of natural resources, including subsistence hunting, is thus often a key feature of the livelihood and culture of traditional communities.
Data limitations hinder our ability to determine whether subsistence hunting in the Amazon is sustainable (Fragoso et al., Reference Fragoso, Levi, Oliveira, Luzar, Overman, Read and Silvius2016). However, even low levels of hunting can lead to drastic declines of hunted populations in tropical forests (Peres, Reference Peres1997). Interventions to conserve game species in regions with subsistence hunting should address the local drivers of hunting and aim to diminish the dependency of local communities on wild meat and/or change their hunting profile towards less sensitive, non-threatened species (Bodmer et al., Reference Bodmer, Eisenberg and Redford1997; Damania et al., Reference Damania, Milner-Gulland and Crookes2005; Torres et al., Reference Torres, Morsello, Parry, Barlow, Ferreira, Gardner and Pardini2017).
Here we assessed the socio-economic and spatial drivers of hunting in the south-eastern Cerrado of Amapá, the fourth largest savannah complex in the Amazon (Carvalho & Mustin, Reference Carvalho and Mustin2017). We discuss the link between food security, local knowledge and the conservation of game species. We used the mean number of hunting trips per month to estimate hunting frequency, and the proportion of households with at least one hunter as an estimate of prevalence (related to the number of active hunters in the region). We tested six hypotheses regarding the effect of various socio-economic and spatial variables on hunting prevalence and frequency. (1) Hunting frequency and prevalence are positively associated with forest cover in the vicinity of households, as this variable reflects greater availability of prey and ease of access to hunting areas (Sampaio et al., Reference Sampaio, Lima, Magnusson and Peres2010). (2) Greater distance to urban centres positively affects hunting frequency and prevalence, because alternative sources of food and income are more readily available near urban centres, and the commercial use of wild meat is illegal in Brazil (Dias Junior et al., Reference Dias Junior, Cunha and de Castro Dias2014). (3) Plenitude of rivers surrounding the households has a negative effect on hunting frequency and prevalence because it probably increases access to alternative sources of animal protein (fish), decreasing the dependency on wild meat. (4) Hunting frequency and prevalence are higher in traditional vs settler communities, given the historical and cultural importance of this resource for traditional people. (5) The per capita monthly income and number of residents in the household have negative and positive effects on the frequency of hunting, respectively, because these variables may be associated with the dependency on wild meat for nutrition. (6) Hunting frequency is negatively related to the age of hunters because hunting is a physical activity expected to be more challenging for older hunters.
Study area
The state of Amapá, in the north-east of the Amazon region, has a Köppen's Am climate with a rainy season during December–July (IEPA, 2008; Alvares et al., Reference Alvares, Stape, Sentelhas, de Moraes, Leonardo and Sparovek2013). The biodiversity of the 10,021 km2 savannah region, known as the Cerrado of Amapá (Hilário et al., Reference Hilário, de Toledo, Mustin, Castro, Costa-Neto and Kauano2017) is still poorly known but includes endemic plant species and several species of fish, birds and mammals that have restricted distributions and/or are threatened (Mustin et al., Reference Mustin, Carvalho, Hilário, Costa-Neto, Silva and Vasconcelos2017). Only c. 9% of the Cerrado of Amapá is legally protected and 0.4% (40.2 km2) is within strictly protected areas (Hilário et al., Reference Hilário, de Toledo, Mustin, Castro, Costa-Neto and Kauano2017).
The Cerrado of Amapá is characterized by open woodlands with a dense layer of herbaceous plants and shrubs. Landscape features include gallery forests, patches of buriti palms Mauritia flexuosa, flooded fields and forest patches within predominantly open formations and plantations (IEPA, 2008; Mustin et al., Reference Mustin, Carvalho, Hilário, Costa-Neto, Silva and Vasconcelos2017). Our study area was the south-eastern Cerrado of Amapá (Fig. 1). This is the most densely populated area of the state, containing the largest urban centres, the highest density of roads and expanding soybean plantations (Hilário et al., Reference Hilário, de Toledo, Mustin, Castro, Costa-Neto and Kauano2017; Mustin et al., Reference Mustin, Carvalho, Hilário, Costa-Neto, Silva and Vasconcelos2017).

Fig. 1 The south-eastern Cerrado of Amapá, an Amazonian savannah complex in Brazil, showing the study area where we interviewed 68 households to assess hunting activities and socio-economic parameters.
Our study focused on the rural communities in the savannah region of two major municipalities, Macapá and Santana. This region comprised > 260,000 ha and a human population of c. 5,050 inhabitants in 1,154 households at the time of the last population census in 2010 (Fig. 1; IBGE, 2010). The majority of the traditional communities founded by people of African descent who escaped from slavery in the state of Amapá occurs in this region (Hilário et al., Reference Hilário, de Toledo, Mustin, Castro, Costa-Neto and Kauano2017).
Methods
Sampling design
We conducted structured interviews with representatives of 72 households (6% of the total) in the study region (Fig. 1) during February–March 2018. Using the sample size calculation for random sampling without replacement (Cochran, Reference Cochran1977), the most conservative optimal sample sizes (with a predicted proportion of households with hunters of 50%) were estimated to be 64 and 288 households, with an absolute error (δ) of 0.1 and 0.05, for a 90% and a 95% confidence interval (CI), respectively. Therefore, our sample size may furnish reliable estimates for hunting frequency within a 90% CI. For the prevalence of hunting our sample size may provide estimates close to a 95% CI as we used information on 223 households regarding the presence or absence of active hunters. SMS and BRCR had met 36 of the 72 interviewees during a separate study in October 2017 (S.M. Silvestre, B.R. Calle-Rendón, J.J. Toledo, R.R. Hilário, unpubl. data). At that time, those households were selected because they were located near forest patches related to that investigation. Considering the openness with which the interviewees talked about hunting in the region, despite this frequently constituting an illegal activity, we deemed it unnecessary to use an indirect research approach such as the quantitative randomised response technique (Conteh et al., Reference Conteh, Gavin and Solomon2015).
We hired local assistants to facilitate the communication between researchers and local people. They helped explain the objectives of the research to the participants and confirmed that it did not constitute surveillance, thereby establishing a trusting relationship. Local assistants were selected based on two main characteristics: expertise in hunting and their good reputation within the local communities. Local assistants also indicated 36 additional hunters/households to be interviewed. We evaluated the reliability of the interviews based on the interviewees’ behaviour, and discarded four of them because of contradictory responses and signs of scepticism or mistrust from the interviewees.
Interviews
We conducted interviews with the head of the family or with one of the hunters. Before each interview we informed participants about the study objectives, that their participation was voluntary and that information provided would be used anonymously and strictly for scientific purposes. After verbal consent was given, we conducted the interviews using an informal approach, in the form of a conversation between two researchers, one local assistant and the interviewee. During this conversation, the researchers sought the answers to six questions: (1) age of the interviewee, (2) monthly household income, (3) number of people (including children) in the household, (4) type of community (traditional or settlers), (5) number of households amongst the four nearest houses with at least one hunter, and (6) hunting frequency (days per month) of the interviewee (or the hunter of the household).
Variables
We estimated the total proportion of households with at least one hunter based on the information provided by interviewees regarding the presence of hunters in the four nearest neighbouring households. Some of the households visited had fewer than four neighbours; in those cases we based the estimate on the number of neighbours present. Because we asked local assistants to indicate other hunters to be interviewed, we did not include the interviewee households themselves in the calculation of hunting prevalence, to avoid sampling biases.
When the interviewee provided different estimates of hunting days per month (hunting frequency) for the rainy and dry seasons, we computed the weighted average of the estimates based on a rainy season of 8 months (IEPA, 2008). Frequencies were rounded to the nearest integer and used as count data.
We converted monthly income data to per capita monthly income, dividing the total monthly household income by the number of household residents. Spatial variables were extracted from Landsat 8 satellite imagery (scenes: 225/60 from 2015 and 226/59 and 226/60 from 2016). We calculated forest cover and the length of rivers within a 1, 2 and 5 km buffer radius around each household.
To estimate the forest cover we categorized the satellite images as forest or non-forest, based on the normalized difference vegetation index (scientific output; threshold = 0.7). We computed the total length of rivers within the three buffers around each household, based on the drainage shapefile of the state (IBGE, 2015).
We calculated the travel distances via roads from households to the nearest urban centre (defined as having a population > 10,000) using satellite imagery from Google Earth Pro 7.3.2.5491 (Google, Mountain View, USA). Urban centres in the study region were the state capital Macapá (474,706 inhabitants) and the cities of Santana (115,471 inhabitants) and Mazagão (20,387 inhabitants; IBGE, 2017). All spatial variables were extracted using ArcGIS 10.5 (Esri, Redlands, USA).
Data analyses
We used R 3.4.3 for all analyses (R Core Team, 2017). We used simple regression models to test the relationship between our response variables, forest cover and total river length in three buffers sizes (1, 2 and 5 km radius), to select the scale in which the relationship is strongest (e.g. Fahrig, Reference Fahrig2013). Based on the significance levels and AICc (Akaike information criterion corrected for small sample size) values, we chose the buffers with a 5 km radius for both forest cover and river length.
We first applied a binomial generalized linear model to assess the influence of the independent variables (forest cover, river length, distance to the nearest urban centre and type of community) on the number of hunters. However, because the model showed overdispersion, we changed it to a quasi-generalized linear model (Zuur et al., Reference Zuur, Ieno, Walker, Saveliev and Smith2009). The number of neighbours considered for each proportion estimate was the weight argument. The optimal model was selected through a backwards stepwise selection, based on the lowest QAICc (quasi-AICc) and best fit of the data (Zuur et al., Reference Zuur, Ieno, Walker, Saveliev and Smith2009). We used the R package MuMIn to calculate the QAICc (Barton, Reference Barton2018).
We used zero-inflated negative binomial models to assess the influence of the independent variables (hunter age, per capita monthly income, number of residents, forest cover, river length, distance to the nearest urban centre and type of community) on hunting frequency. This model was used to address overdispersion caused by the high frequency of zeros in the data (Zuur et al., Reference Zuur, Ieno, Walker, Saveliev and Smith2009). The optimal model was selected based on the lowest AICc and best fit of the data, as indicated by the model.avg function in the R package MuMIn (Barton, Reference Barton2018). The zero-inflated negative binomial models were created using the R package pscl (Jackman, Reference Jackman2017).
We tested the residuals of all models for spatial autocorrelation using variograms, created using the R packages gstat (Pebesma, Reference Pebesma2004) and sp (Pebesma & Bivand, Reference Pebesma and Bivand2005; Bivand et al., Reference Bivand, Pebesma and Gómez-Rubio2013). The variograms showed no spatial autocorrelation in the model residuals. We calculated the variance inflation factors, using the R package car (Fox & Weisberg, Reference Fox and Weisberg2011), to detect problems with multicollinearity. None of the variables had variance inflation factors > 3, so we kept all variables in the analyses (Zuur et al., Reference Zuur, Ieno, Walker, Saveliev and Smith2009).
Results
With interviewees indicating the presence of hunters in neighbouring households, we obtained information about 223 households, of which 111 (49.8%) had at least one hunter. This proportion was different from the mean because not all interviewees had four neighbours (Table 1).
Table 1 Summary of the variables used on the regression models to assess the socio-economic and spatial drivers hunting prevalence and frequency in the south-eastern region of the Cerrado of Amapá, in the state of Amapá, Brazil.

1 Conversion rate: BRL 1.00 = USD 0.27.
2 Used to calculate the proportion of neighbouring households with at least one hunter (maximum 4).
The optimal quasi-generalized linear model selected to explain the drivers of hunting prevalence included only forest cover, which had a positive effect on the proportion of households with hunters (t = 2.60; P = 0.0117; Fig. 2a).

Fig. 2 Socio-economic and spatial drivers of hunting in the south-eastern Cerrado of Amapá, Amapá, Brazil. (a) Relationship between proportion of households with hunters and forest cover within a 5 km radius buffer, as described by a quasi-generalized linear model, with binomial distribution, and the 95% confidence interval in dark grey. Relationships between estimated mean number of hunting trips per month and (b) forest cover within 5 km buffer, (c) river length within 5 km buffer, (d) distance to the nearest urban centre, (e) log per capita monthly income, and (f) age of hunter, as described by a zero-inflated negative binomial model.
The optimal zero-inflated negative binomial model selected to predict hunting frequency included five independent variables (Table 2). Forest cover was the only variable positively associated with hunting frequency (Fig. 2b). Hunting frequency decreased with increasing river length (Fig. 2c), distance to the nearest urban centre (Fig. 2d), log per capita monthly income (Fig. 2e), and hunter's age (Fig. 2f).
Table 2 Count model coefficients of the zero-inflated negative binomial model assessing the drivers of hunting frequency in the Cerrado of Amapá, Amapá, Brazil.
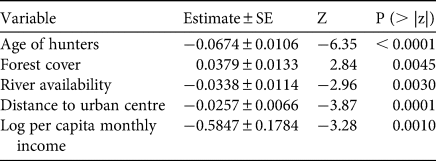
Our results corroborated the hypothesized positive effect of forest cover on hunting frequency and prevalence, as well as the negative influence of length of rivers, hunter's age and income per capita on hunting frequency. However, we did not find evidence to support any significant effects of distance to urban centre, length of rivers or type of community on hunter prevalence, nor of type of community and number of residents in the household on hunting frequency. Furthermore, and contrary to our hypothesis, we found evidence of a negative effect of distance to urban centres on hunting frequency.
Discussion
Spatial and socio-economic drivers of hunting
Forest cover is positively associated with the presence and abundance of game species (Sampaio et al., Reference Sampaio, Lima, Magnusson and Peres2010). It has been suggested as the main driver of hunting probability in some regions (Torres et al., Reference Torres, Morsello, Parry, Barlow, Ferreira, Gardner and Pardini2017). Hunting and the consumption of wild meat are an important aspect of the livelihoods of many rural communities, particularly in Amazonia (Nasi et al., Reference Nasi, Brown, Wilkie, Bennett, Tutin, van Tol and Christophersen2008). As expected a large proportion (c. 50%) of households in the study sample had at least one resident hunter. Forest cover was the only driver of hunter prevalence in our optimal model, corroborating our hypothesis that greater availability of forest would increase the prevalence of hunters.
In contrast, we found hunting frequency was influenced by five independent variables. Forest cover was again positively associated, but the age of the hunters was the main factor affecting hunting frequency in our sample. The negative effect of this variable is probably a reflection of the physical requirements of hunting trips, which may be more challenging for older hunters. Along with the positive effect of forest cover, it is the physical and logistic feasibility that primarily regulates hunting frequency.
Distance to urban centres, per capita monthly income and length of rivers, which could be associated with factors such as market demand for wild meat or accessibility/availability of alternative food sources, had greater influence on the frequency of hunting than on the number of hunters.
The overall effects of forest cover, per capita monthly income and length of rivers on hunting frequency corroborated our hypothesis that decreasing dependency on wild meat for nutrition would decrease hunting frequency. The effect of distance to urban centres, however, was contrary to our expectations. We predicted that greater distance to urban centres would have a positive effect on hunting frequency because communities that are more isolated are probably more dependent on wild meat for subsistence as domesticated meat is less available, and because we expected subsistence hunting (rather than commercial hunting) to be the prevalent type of hunting in the study region. The dependence of isolated communities on wild meat for subsistence is supported by the observed negative effects of river length and per capita monthly income on hunting frequency. However, the fact that hunting occurs more frequently near urban areas suggests that commercial hunting may be more prevalent than we expected.
Urban populations can create a high demand for wild meat and play a key role in the overexploitation of game species (Milner-Gulland & Bennett, Reference Milner-Gulland and Bennett2003). Higher levels of hunting near urban centres are expected when this proximity increases the demand for wild meat as a result of greater human population density or the intensification of commercial hunting (Damania et al., Reference Damania, Milner-Gulland and Crookes2005; Pangau-Adam et al., Reference Pangau-Adam, Noske and Muehlenberg2012; Torres et al., Reference Torres, Morsello, Parry, Barlow, Ferreira, Gardner and Pardini2017). We therefore suggest that the observed higher frequency of hunting near urban centres is related to the role of wild meat as a source of income in the region.
In contrast, presence of rivers is an unambiguous measure of the availability of an alternative source of animal protein and is intrinsically related to the dependency of the local human population on wild meat for nutrition (Saffirio & Scaglion, Reference Saffirio and Scaglion1982). Fish is one of the main sources of animal protein for rural communities in the Amazon (e.g. Passos et al., Reference Passos, Da Silva, Lemire, Fillion, Guimarães, Lucotte and Mergler2008). As we predicted, hunting frequency was lower when there were a greater number of rivers in the vicinity of households.
Implications for conservation
Increasing cattle farming or wages paid to local workers could decrease illegal hunting in some regions (Moro et al., Reference Moro, Fischer, Czajkowski, Brennan, Lowassa, Naiman and Hanley2013). The availability of an alternative to wild meat may thus reduce hunting in the Cerrado of Amapá. However, given that pasture expansion is the predominant driver of deforestation in the Amazon (Barona et al., Reference Barona, Ramankutty, Hyman and Coomes2010), support for the local production of chickens or small-scale fish farming could be effective strategies to reduce hunting, while also avoiding an increase in local deforestation. In contrast, we expect that reduced fishery resources would increase hunting activity. Soybean plantations in the region increased by > 200% during 2013–2016 (Hilário et al., Reference Hilário, de Toledo, Mustin, Castro, Costa-Neto and Kauano2017) and Brazil is the country with the third highest annual consumption of pesticides worldwide (FAO, 2019) and pesticides used on soybean plantations could negatively affect local fish communities (Ullah et al., Reference Ullah, Zuberi, Alagawany, Farag, Dadar and Karthik2018). Soybean expansion in the region could therefore indirectly contribute to an increase in hunting frequency.
Trade in wild meat plays a key role in the impact of hunting on global biodiversity (Benítez-López et al., Reference Benítez-López, Alkemade, Schipper, Ingram, Verweij, Eikelboom and Huijbregts2017). Investments in hunting equipment may be covered by the sale of wild meat and hunting quotas tend to increase when economic profit is generated (Altherr, Reference Altherr2007). Most types of hunting, and wild meat trade, are prohibited in Brazil (Law no. 5,197, 3 January 1967). However, subsistence hunting may be legal in some circumstances, including where it is necessary to provide food for the hunter and their family, and in traditional communities within their territories (Law no. 6,001, 19 December 1973; Law no. 9,605, 12 February, 1998). This means that in legal terms there are two potential solutions: the maintenance of the prohibition with stricter enforcement, or the regulation of professional hunting, aiming to sustainably manage this resource.
Rigorous law enforcement alone is often not able to prevent illegal hunting in large areas. It may also affect hunters differentially based on their wealth, deterring mostly poorer hunters who are probably more dependent on wild meat for subsistence (Moro et al., Reference Moro, Fischer, Czajkowski, Brennan, Lowassa, Naiman and Hanley2013). Wide support from community leaders for a ban on wild meat trade may be attained by education programmes, which could raise awareness of the threats of overexploitation to the native fauna and the livelihoods of local communities, and the benefits that the change could yield (Nasi et al., Reference Nasi, Brown, Wilkie, Bennett, Tutin, van Tol and Christophersen2008). In this context, encouraging the formation of local councils dedicated to the participatory creation of management plans could be a powerful tool to empower local communities towards making more sustainable decisions regarding the use of local wildlife. The implementation of those actions relies on further research that should focus on four main topics: (1) quantifying hunting pressure in local rural communities, (2) assessing the status of the main targeted game species in the region, (3) assessing the potential for sustainable economic activities in the region and (4) quantifying hunting pressure originating in the urban centres, including hunting prevalence and frequency and the trade of wild meat.
Acknowledgements
We thank the local communities for sharing the knowledge upon which this study was based, and Karen Mustin and two anonymous reviewers for their valuable inputs. This investigation was funded by The Rufford Foundation (22322-1), the Conservation Leadership Programme (02327917) and Idea Wild. SMS and BRCR were supported by student stipends from CAPES.
Author contributions
Study design: SMS, BRCR, RRH; fieldwork: SMS, BRCR; data analysis: SMS, RRH; writing: all authors.
Conflicts of interest
None.
Ethical standards
The research abided by the Oryx guidelines on ethical standards. All methods complied with the Brazilian legal requirements for research involving human subjects and were approved by the ethics committee of Universidade Federal do Amapá.


 Open access