

4.1 Introduction
The public research system in the United Kingdom is composed of many universities and a smaller number of public research institutes. Over time, knowledge transfer has been institutionalized as a key mission of public research performers, as important as their longstanding commitment to research (Reference Lockett, Wright and WildLockett et al. 2014). As in other countries, the institutionalization of the knowledge transfer mission has largely been driven by policy incentives (Reference Sánchez-BarrioluengoSánchez-Barrioluengo 2014; Reference Pinheiro, Langav and PausitsPinheiro et al. 2015). The purpose of this chapter is to analyze, on the one hand, the United Kingdom’s institutional setup (including the characteristics of the country’s public research system and of the policies implemented therein), and, on the other hand, the variety of knowledge transfer activities undertaken and of governance models adopted in order to carry them out.
The United Kingdom provides an interesting case study for several reasons. First, the UK public sector research system has a variegated structure that can support a variety of models of knowledge transfer engagement. Indeed, the wide variety of knowledge transfer activities undertaken, and the diversity of approaches adopted, suggests that institutions pursue the strategy of knowledge transfer engagement that best suits their comparative advantages. This also leads to strong path dependency and a symbiotic relationship with the underlying socioeconomic structure of the country and its regions. Second, as UK universities have operational flexibility reminiscent of that of the United States of America (U.S.), but are also dependent on public funds very much like their European neighbors, this case can offer insights for countries with predominantly publicly-funded systems that intend to adopt an incentive-based approach to policy. The main policy tool used by the UK government to foster university–industry interaction and knowledge transfer has been the provision of performance-based funding in order to create a financial incentive for universities to engage in knowledge transfer activities and achieve measurable results that can be rewarded economically. Moreover, since knowledge transfer activities are income-producing in themselves, in a period of prolonged decline in public funding, universities have had strong incentives to engage in knowledge transfer activities irrespective of the presence of policy schemes. Consequently, there seems to have been a reorientation of the public science system toward more commercializable research. In turn, this raises the question whether the UK system is generating enough basic research on its own to keep it at the science frontier and make it possible to quickly absorb and exploit new technology. Investment in basic science – the original argument for public funding of education – could get lost in the thrust of policy to promote research commercialization.
This chapter is structured as follows. Section 4.2 provides a brief overview of the organization of the United Kingdom’s public research system. Section 4.3 describes the historical evolution of policies in support of university–industry knowledge transfer in the United Kingdom, considering both the evolution of the institutional setup and of the supply- and demand-side policy instruments implemented. Section 4.4 examines the variety of knowledge transfer channels used by universities and public research institutes, with a particular focus on their performance in intellectual property (IP) commercialization, and compares the differential performance of universities and public research institutes in knowledge transfer, investigating some possible causes. It also considers the demand for university knowledge from the private sector. Section 4.5 delves into the institutional infrastructures that universities have set up to manage their knowledge transfer activities, and their practices. Finally, Section 4.6 concludes with some policy lessons.
4.2 Universities and Public Research Institutes in the United Kingdom
The earliest universities in Britain were founded in the Middle Ages, with Cambridge’s charter dating back to 1209. Only a handful of institutions were created between then and the early nineteenth century, which saw the progressive establishment of many further education colleges that provided vocational training in a range of subjects, including teaching (teacher training colleges), various branches of engineering or agriculture (polytechnics), and the arts (arts colleges). These institutions (which were part of the public sector under the control of local education authorities, and sometimes religious foundations) contributed collectively to a binary higher education system, with universities educating the elite and colleges providing vocational education for the middle class.
This system began to change in the 1960s, with a shift toward mass university education thanks to the creation of twenty-five new universities. This trend received further impetus in 1992, as several existing polytechnics gained degree-awarding powers,Footnote 1 and the process has continued since then with the transformation of teacher training colleges, art colleges, and other colleges into universities. Today, the UK university system includes 161 officially recognized degree-awarding higher education institutions. Figure 4.1 shows the cumulative number of universities founded since 1900. The 1960s, 1990s, and 2000s saw the largest increases in the number of institutions.

Figure 4.1 Cumulative number of degree-awarding institutions active since 1900
Eighty-three percent of institutions are based in England (of these, one-third are in London), 10 percent in Scotland, 5 percent in Wales, and the remaining 2 percent in Northern Ireland. Their nature is varied: some universities specialize in world-class research and others (particularly those that were previously focused on vocational education) in specialist training often closely linked to local industry. The UK university system is traditionally public, but particularly since the 2000s, a small but growing number of entirely private universities have emerged (the first of these, the University of Buckingham, was founded in 1973). Even those universities that receive most of their funding from the government are not formally part of the public sector as they are in some countries (such as in Germany, where academics are civil servants). Instead, UK public universities are regulated as nonprofit institutions governed by the Charities Act 2006, and, as such, enjoy considerable operational autonomy.
The United Kingdom’s science, research, and higher education policy is the responsibility of the Department for Business, Energy, and Industrial Strategy (BEIS) and of the Department for Education (DfE). Funding allocation is devolved to the higher education agencies of the four countries of the UK: the Higher Education Funding Council for England (HEFCE), the Department for Employment and Learning Northern Ireland (DELNI), the Scottish Funding Council (SFC), and the Higher Education Funding Council for Wales (HEFCW). Each is responsible for funding universities’ ordinary teaching and research activities as well as for implementing policy instruments in support of knowledge transfer engagement.
Research and teaching are funded through separate streams. Since the mid-1980s, recurrent research funding is distributed on a quality-related basis building on a periodic nationwide assessment of the quality of university research. Over time, the research assessment exercise has changed its name (from Research Selectivity Assessment to Research Assessment Exercise to Research Excellence Framework), its frequency (currently every six to seven years), the method of assessment (peer review of scientific output has been complemented by bibliometric measures and by an assessment of impact case studies), and the formula used for the funding distribution (Reference Geuna, Piolatto, Sylos-Labini, Geuna and RossiGeuna, Piolatto and Sylos-Labini 2015). Research funds are also allocated to academics on a competitive basis by seven research councils.Footnote 2
Until recently, recurrent funding for teaching was distributed to universities entirely according to a formula based on student numbers, weighted according to, among others factors, field, mode, and level of study (HEFCE 2015). In 2012/13, the government introduced a new system whereby universities receive a large share of their income directly from loan-backed tuition fees, while the amount of recurrent funding for teaching distributed by HEFCE has substantially decreased. A new teaching quality assessment system, the Teaching Excellence Framework (TEF), was introduced in 2017 with the objective of allowing institutions that gain a higher teaching quality score to increase their tuition fees in line with inflation.
Figure 4.2 shows how the sources of funding for universities have changed over the last ten years. Recurrent funding for teaching has been curtailed sharply since 2011/12, only partly compensated by a temporary increase in research funding. Universities have compensated for this drop in public funding by increasing undergraduate tuition fees to up to £9,000 per year. Income from knowledge transfer activities consists of two categories: research grants and contracts, which includes income from collaborative research (competitively allocated grants from the research councils, government departments, and the European Commission as well as trusts and charities) and from research contracts with industry and the public sector; plus other income, which includes income from the sale and licensing of intellectual property (IP) (including sales of equity shares in spinoffs), consultancies, facilities and equipment, professional development (CPD) and continuing education (CE) courses, and regeneration programs. These sources of income have increased slowly but steadily and together currently amount to about £12 billion – about 36 percent of overall income. IP income is a small share, just 3–4 percent of the income from knowledge transfer activities (Reference Geuna and RossiGeuna and Rossi 2011). A few universities (namely, Oxford and Cambridge colleges) benefit from considerable land endowments.
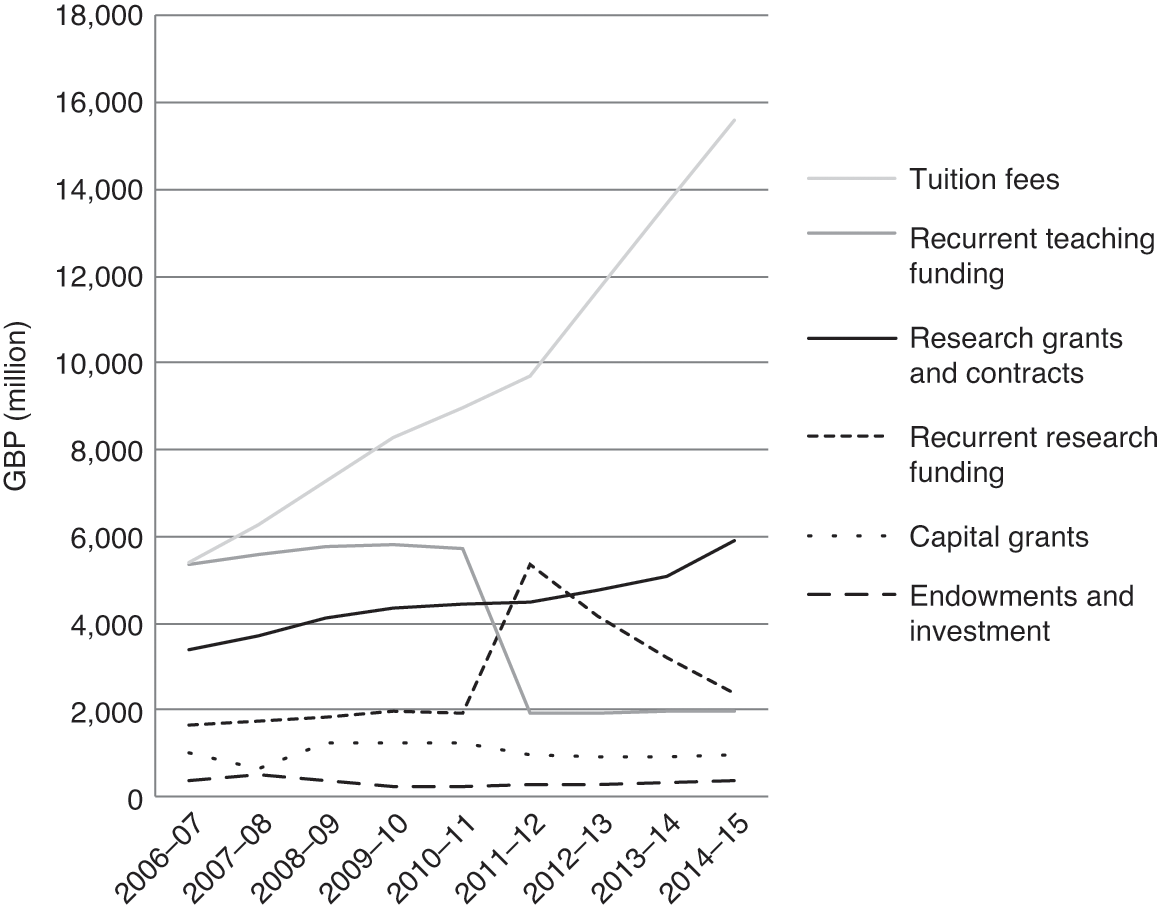
Figure 4.2 Universities’ sources of income
Public research institutes, funded by government departments or research councils, are collectively known as public sector research establishments (PSREs). They are important actors in the United Kingdom’s research system. Unlike the university sector, the PSRE sector in the United Kingdom has shrunk due to mergers, closures, and numerous transfers to the private sector. There are currently thirty-five active PSREs (Reference SmithSmith 2015), each funded by a specific government departmentFootnote 3 or research council.Footnote 4 In addition, there are twenty-six research institutes that are part of the Medical Research Council (MRC) and twenty-four cultural institutions funded mainly by the Department of Culture, Media, and Sport and by the Welsh and Scottish governments (Reference SmithSmith 2015).Footnote 5 The main difference between departmental PSREs and research council PSREs, besides their different sources of funding – the former are funded directly from the budgets of the departments they belong to, the latter are funded through the science budget – is that the former perform “responsive research” on topics directly mandated by the government, while the latter are more autonomous in setting their research priorities within their field.Footnote 6 Figure 4.3 shows the cumulative number of PSREs over time. PSREs associated with government departments have shown the largest decrease, in keeping with the idea of “lean government.”

Figure 4.3 Cumulative number of public sector research establishments active since 1950
PSREs receive a much smaller amount of funding than the university sector. The Office for National Statistics (ONS 2016) reports that in 2014 the research councils spent £819 million on in-house R&D while government departments spent £1,391 million. Although reconstructing the amount of government funds that accrue to the PSRE sector is quite difficult, these approximate figures suggest that the sector currently receives about 30–35 percent of the recurrent funds allocated to universities. Interestingly, the ratio between the number of current PSREs (including cultural institutions but excluding MRC university-based units) and the number of university institutions is similar (about 36 percent), so we can estimate the size of the PSRE sector to be about one-third the size of the university sector.
Very limited information has been collected on the different sources of income of PSREs. A study of PSREs’ knowledge transfer activities (BIS 2014) estimated that in 2012/13, PSREs gained £195 million from intellectual property licensing, £166 million from consulting activities, and £133 million from the use of facilities and equipment and training.Footnote 7 Therefore, income from knowledge transfer is about 23 percent of the income that PSREs derive from government funding. In contrast to universities, PSREs’ IP income is a high share (about 65 percent) of their overall income from knowledge transfer activities.
PSREs operate under a variety of governance arrangements: they can be fully owned by a government department or research council, government-owned but contractor-operated (GOCO), registered charities, executive agencies, trading funds or nondepartmental public bodies. This variety of governance arrangements in the PSRE sector and the universities’ status as charities have meant that both these institutions have greater operational autonomy in the United Kingdom than do similar institutions in Europe, and, in turn, this freedom has enabled them to be nimble and responsive to emerging market trends.
Table 4.1 compares public funding of universities and PSREs between 2008/9 and 2013/14. The table shows different trends, with public funding of PSREs remaining stable and public funding of universities declining – although the decline has occurred in relation to university teaching funding (a 67 percent drop in the period), while university research funding has increased.
Table 4.1 Public funding of universities and PSREs
| Universities | PSREs | |
|---|---|---|
| 2008/9 | 8,819 | 2,128 |
| 2009/10 | 9,043 | 2,216 |
| 2010/11 | 8,878 | 2,287 |
| 2011/12 | 8,271 | 2,199 |
| 2012/13 | 7,032 | 2,045 |
| 2013/14 | 6,080 | 2,153 |
4.3 An Overview of Knowledge Transfer Policy in the United Kingdom
4.3.1 A Short History of Knowledge Transfer Policy in the United Kingdom
The UK government’s concern with supporting university–industry knowledge transfer began in the late 1970s, when a debate emerged on the United Kingdom’s presumed failure to exploit research (Reference Grady and PrattGrady and Pratt 2000). Institutional and cultural barriers at the time had made cooperation between academic and industrial scientists difficult, and academia lacked incentives to engage with industry. The National Research Development Corporation (NRDC), a governmental body charged with facilitating the commercialization of research produced by public R&D (particularly defense) laboratories, had been created in 1948, but it played a limited role. John Hendry’s Innovating for Failure (Reference Hendry1993), which recounts the early attempts to drive the creation of a computer industry in Manchester in the 1950s, is instructive. Despite having the new technology at the University of Manchester, an identified champion (Ferranti) and a government willing to provide funds for the enterprise, a technology industry based on computing failed to emerge, as the required interaction between the scientists and the managers at Ferranti did not take place. An industry based on computing technology did emerge in the 1980s, but at Cambridge, supported by the Cambridge colleges, and largely free from government influence (Reference Athreye, Breshanan and GambardellaAthreye 2004). This early failure to seize the opportunity in a sector where the United Kingdom had numerous advantages may have contributed to policymakers moving away from directly supporting specific technologies. Instead, policy interventions increasingly involved promoting general framework conditions for innovation, including promoting universities’ engagement with business.
Several initiatives to support university–industry interactions implemented since the mid-1970s exemplified such an indirect approach to technology policy. These included the Teaching Company Scheme, launched in 1975, which involved placing graduates in companies on projects jointly supervised by academics and company staff (Reference Senker and SenkerSenker and Senker 1994) and the LINK scheme, launched in 1986, which aimed to support collaborative research partnerships between industry and the research base (Reference Grimaldi and von TunzelmannGrimaldi and Von Tunzelmann 2002). In the early 1980s the government assigned the exclusive right to commercialize university-generated intellectual property to the British Technology Group (BTG, formed through the merger of the NRDC with the National Enterprise Board), and, a few years later, in 1985, universities were given the choice whether to commercialize academic inventions independently or to rely on the services provided by BTG.Footnote 8
Starting from the mid-1990s, government policy documents began to explicitly identify universities as the central focus for economic development, and to emphasize the importance of partnerships between industry, government, and the science base (OST 1993). With the move of the Office of Science and Technology (OST) from the Cabinet Office to the Department for Trade and Industry (DTI) in 1995, responsibilities for science and technology policy were centralized in a single department, which facilitated the emergence of a coordinated national policy on university knowledge transfer (Reference Grady and PrattGrady and Pratt 2000).
Reference Rosli and RossiRosli and Rossi (2016) argue that UK policymakers’ views about how universities engage in knowledge transfer, and how policy should support them, have evolved over time. Until the early 2000s, policymakers envisioned a model of university engagement that borrowed heavily from the sciences and engineering (Reference Kitagawa and LightowlerKitagawa and Lightowler 2012): innovation was viewed as a linear process whereby universities would transfer technology to business, by selling patents and licenses, performing contract research (National Committee of Enquiry into Higher Education 1997; DTI 1998), or directly commercializing their technology through spinoff companies (Reference Lockett, Wright and WildLockett, Wright, and Wild 2014).
During the 2000s, policy documents began to reflect a more nuanced view, supported by growing empirical evidence highlighting the diversity of channels through which universities engage with businesses and with other economic and social actors (Reference D’Este and PatelD’Este and Patel 2007; Reference Bekkers and Bodas FreitasBekkers and Bodas Freitas 2008; Reference Hughes and MartinHughes and Martin 2012). Having identified the drawbacks of focusing too much on patenting and on the pursuit of narrow financial returns (Lambert Review: HM Treasury 2003; Gowers Review: HM Treasury 2006; Saraga report: DIUS 2007), universities were encouraged to realize the potential of their intellectual property beyond their patent portfolio, focusing on other areas such as copyright (Hargreaves Review: BIS 2011b). They were also encouraged to focus on their comparative strengths, since different universities had different contributions to make, some as world-class centers of research excellence and players in global markets, and others primarily as collaborators engaged with local businesses, communities, and regional bodies (DTI/DFES 2005; DIUS 2008a, 2008b). It was argued that public funding should encourage such choice, by providing incentives for institutions to become more entrepreneurial, build closer links with business and the community, and have proper arrangements for exploiting the results of their work. The term “knowledge transfer” gained prominence (DES 2003; HM Treasury 2003), suggesting that universities transfer more than just technology produced by science and engineering departments, and contribute through the whole spectrum of academic disciplines.
More recently, a broader view has emerged whereby universities are seen to be part of complex ecosystems of innovation characterized by collaboration and exchange among a variety of stakeholders, aimed at addressing complex social and economic challenges (Reference Andersen, Brinkley and HuttonAndersen, Brinkley, and Hutton 2011; BIS 2015). The bidirectional and collaborative nature of the interactions between universities and businesses (or other stakeholders), is reflected in the increasing use of the term “knowledge exchange” (DIUS 2008b; BIS 2012, 2013, 2015).
Another aspect of the evolution of knowledge transfer policy concerns the level of implementation. In the first decade of the 2000s, attention was paid to the regional dimension of universities’ knowledge transfer engagement (Reference PottsPotts 2002; DES 2003; Lambert Review: HM Treasury 2003), and a new Regional Innovation Fund worth £50 million per year was set up to enable regional development agencies (RDAs) in England to support clusters, incubators and networking among scientists, entrepreneurs, managers, and financiers. However, all RDAs were closed in 2010, leading the government to abandon this regional focus (Reference Cochrane and WilliamsCochrane and Williams 2013). In the absence of regional policy institutions, the implementation of regional policies for knowledge transfer has become more difficult, and universities’ efforts to engage in knowledge transfer within their region are neither monitored nor encouraged. While numerous local enterprise partnerships (LEPs) between local authorities and businesses were established in 2011, covering all areas of England (BIS Committee 2014), how innovation and knowledge transfer policies can be implemented in the LEP context remains unclear. LEPs argue that their remit has expanded over time, and that their resources are insufficient (National Audit Office 2016). Although university representatives sit on the board of many LEPs, a recent review suggests that the relationship expected between LEPs and universities appears ill-defined and that engagement between them is patchy (BIS 2015), with LEPs lacking any firm obligation or support to help businesses connect with universities. In consequence, universities may have been discouraged from pursuing an agenda of contributing to regional development, focusing instead on different objectives (Reference Kitagawa, Sanchez-Barrioluengo and UyarraKitagawa et al. 2016). However, little empirical evidence exists at the moment to show whether this has been the case.
4.3.2 Supply-Side Policy Instruments Supporting Knowledge Transfer
Most of the policy instruments devised by the government in order to promote knowledge transfer have been targeted at universities (Science and Technology Committee 2017). The first comprehensive package, the Knowledge Exploitation Programme, was launched in 1999 and included three instruments (HEFCE 1999):
(i) The Higher Education Reach-out to Business and the Community (HEROBAC) Fund (£60 million allocated competitively in 1999–2004). Its aim was to help universities to build organizational capability and infrastructures to engage with business and the wider community.
(ii) The Science Enterprise Challenge (SEC) fund (£45 million allocated competitively in 1999–2004). It aimed to support entrepreneurially oriented education and training within universities.
(iii) The University Challenge Seed Fund (£60 million overall allocated via two competitions, in 1999 and 2001). It provided access to seed funds to exploit science and engineering research outcomes and support the creation of university spinouts.
The Higher Education Innovation Fund (HEIF), a permanent stream of funding to support universities’ knowledge transfer activities, was announced in 2001/2 and implemented the following year. The activities originally funded by HEROBAC, the SEC and the University Challenge Seed Fund were progressively brought within HEIF’s remit. After a marked increase between 2004 and 2008, the fund later stabilized at about £130 million per year, which is almost three times as much as it had been in 2001. The amount distributed through HEIF and parallel funding streams in Scotland, Wales, and Northern Ireland equates to approximately 2.4 percent of the recurrent government funding allocated to universities for teaching and research, and about 9 percent of the recurrent government funding allocated to research alone (Kitagawa and Lightowler 2013). Over time, HEIF has become a very important source of support for knowledge transfer activities, with about 34 percent of universities’ knowledge transfer income resulting from HEIF-funded activities (Reference Coates UlrichsenCoates Ulrichsen 2014).
HEIF’s allocation system has changed over time. Initially, funds were allocated to universities competitively on the basis of the project proposals that they presented, with the objective of helping them build capacity for knowledge transfer (Reference Kitagawa and LightowlerKitagawa and Lightowler 2012). Since 2006 this has been progressively replaced by a formula based on the income that universities accrue from knowledge transfer, so that money is channeled to the institutions that are already more commercially successful. The introduction of a minimum eligibility threshold of £250,000, an increase in the maximum award that can be received by each university (£2.85 million), and the allocation of additional funds to top performers (£6 million to twelve institutions in 2012/13 and £20 million to twenty-seven institutions in 2014/15) have also contributed to greater funding concentration since 2011 (Reference Coates UlrichsenCoates Ulrichsen 2014; Reference Day and FernandezDay and Fernandez 2015), reversing the previous trend whereby smaller institutions used to have higher income growthFootnote 9 (Reference Day and FernandezDay and Fernandez 2015).
In addition to HEIF, several other instruments support universities’ knowledge transfer activities. HEFCE runs the Catalyst Fund, which distributes funds competitively to projects aimed at driving innovation in higher education (£37.6 million in 2013/14) and the UK Research Partnership Investment Fund, which funds large-scale collaborative projects between universities and private partners (£136 million in 2013/14). Innovate UK also runs a number of schemes. The Knowledge Transfer Partnership (KTP) scheme, launched in 2003, is a revamped version of the Teaching Company Scheme. In 2013/14 it allocated £16.9 million. The Catapult Centres, launched in 2013, are research and technology innovation centers set up as collaborative ventures between universities and businesses, each focused on a specific area of research and technological development. The twelve “catapults” were allocated £121.30 million in 2013/14. Innovate UK also funds collaborative R&D projects and feasibility studies involving businesses and research organizations (£172.9 million in 2013/14), collaborative research in biomedicine (Biomedical Catalyst, £30 million in 2013/14), Knowledge Transfer Networks (£15.2 million in 2013/14), and Innovation and Knowledge Centres (£1.9 million in 2013/14).
The overall set of government-supported knowledge transfer schemes allocated by HEFCE and Innovate UK amounted to approximately £696 million in 2013/14, which was about 37 percent of the recurrent government funding allocated to university research in the same period (NCUB 2016a). Small funding schemes supporting knowledge transfer activities, often restricted to specific academic fields, are also implemented by the devolved governments (Reference Huggins and KitagawaHuggins and Kitagawa 2012), by many of the research councils and by selected charities such as the Wellcome Trust and the Royal Society (Lockwood 2012, cited in Reference Coates UlrichsenCoates Ulrichsen 2014).Footnote 10
Few policy instruments have been set up in support of the knowledge transfer activities of PSREs. In 2001, the government set up the Public Sector Research Exploitation Fund, awarding nineteen PSREs a total of £10 million of public venture capital to develop potential products to the point where they could be successfully marketed to the private sector. Two additional rounds of funding in 2004 and 2006 allocated a further £40 million. Since the demise of this instrument, there are no lines of funding specifically dedicated to supporting PSREs’ knowledge transfer activities.
Not all policy instruments consist of the provision of funding. The Lambert Agreements are a set of decision tools and standard agreements created in 2005 to simplify contracting for business–university collaborations. Evidence on the success of these tools is mixed: most users report that they simplify processes and provide useful information and precedents (BIS 2015); however, their use is not widespread. While universities are generally aware of these tools and 63 percent use them to some extent (Reference Tang, Wecowska, Campos and HobdayTang et al. 2009), less than 10–15 percent by value of collaborative research between universities and business is based on a Lambert-type agreement (BIS 2015). For the most valuable agreements, companies are more likely to impose their preferred contractual forms. Scotland has mandated the use of template contracts for interactions funded by the Scottish Funding Council’s innovation voucher and related schemes (BIS 2015).
A crucial nonfinancial policy instrument that affects knowledge transfer is the government regulation of IP rights. In the United Kingdom, there is no strong legislative framework regulating academic patenting, and, unlike other countries that have enacted specific laws on university IP, the assignment of IP rights over research outputs is governed by the general provisions on employee inventions contained in the Patent Law of 1977. The United Kingdom has a system of “automatic ownership,” such that the university is the first owner of the IP, which usually cannot revert to the inventor.Footnote 11 However, if research is sponsored fully or in part by external contractors, parties may negotiate a different agreement on the allocation of IP rights. In some cases, the university may override existing regulations by developing internal IP rights regulations and procedures to enforce them. Issues such as the share of royalties to be assigned to the academic inventors, the rights of inventors who are PhD students, and the timing of patent filing procedures can vary widely among universities.
Mainly because of its fluidity, the policy framework around IP has not undergone radical changes over time. The main policy change, introduced in 1985, has been the possibility for universities to directly commercialize their intellectual property. This has encouraged an increase in the patenting activities of universities. In fact, UK universities tend to own a large share (over 50 percent) of patents invented by academics, similar to the U.S. (where the share is 69 percent) and unlike many other European countries, where the majority of academic-invented patents are owned by private companies; for example, Reference Lissoni, Llerena, McKelvey and SanditovLissoni et al. (2008) show that university-owned patents constitute no more than 11 percent of all academic patents in France, Italy, and Sweden.
4.3.3 Demand-Side Policies Supporting Knowledge Transfer
Business also has a vital part to play in successful knowledge transfer. A number of policies exist to support business investment in R&D, which in turn should increase businesses’ commercial demand for university research. These include (BIS 2011a):
R&D tax credits, which offer relief from corporation tax (equal to 22.5 percent of qualifying expenditure) with the objective of incentivizing companies in all sectors to undertake more R&D. The government has also introduced a simplified tax regime for small companies and made it easier for them to claim the R&D tax credit.
Open funding competitions (formerly Smart Programme) to support firms’ R&D projects that are “likely to lead to sustainable gains in productivity and/or access to new overseas markets through export led business growth.”Footnote 12
The Small Business Research Initiative (SBRI), which aims to enable innovative companies to solve challenges for government departments.
Support for venture capital funding, through government investment in the Enterprise Capital Funds program, in the Co-Investment Fund (aimed at backing business angels), and in the UK Innovation Investment Fund (one of Europe’s largest technology funds investing in life sciences, digital, advanced manufacturing and clean-tech companies). Additionally, several schemes provide tax relief to investors providing venture capital to qualifying seed companies (the Seed Enterprise Investment Scheme, SEIS), SMEs (the Enterprise Investment Scheme, EIS), or social enterprises (Social Investment Tax Relief, SITR).Footnote 13
The recent Industrial Strategy White Paper (BEIS 2017) has outlined a more proactive role for the UK government in driving industrial policy in the wake of the United Kingdom’s exit from the European Union and proposed several supply-side and demand-side interventions. On the supply side, the government has committed to increase investment in R&D by around 20 percent via an additional £4.7 billion of government R&D funding by 2020–1. Additional spending of £100 million has been committed to measures to incentivize universities to collaborate with businesses. These might include the expansion of existing mechanisms such as HEIF and KTPs, the introduction of new schemes aimed at funding industry placements for scientists, and supporting world-class clusters of research and innovation. A new Industrial Strategy Challenge Fund is planned to back technologies at all stages where the United Kingdom has the potential to take an industrial lead. This Fund will support a range of industrial R&D activities: joint research projects between business and academic researchers, graduate placements, setting up demonstrators to test near-to-market technologies in real-world environments and creating centers to bring together academic experts with entrepreneurs to promote commercialization (BEIS 2017).
On the demand side, a few measures aimed at driving up the level of business R&D investment have also been announced. These include: a review of the tax environment for R&D, a new challenge prize to support “everyday entrepreneurs” and a review of the IP system to stimulate collaborative innovation and licensing opportunities. The Science and Technology Committee (2017), while welcoming the government’s renewed emphasis on knowledge transfer, remained concerned that its previous efforts had focused disproportionately on the “supply” of research by universities rather than the level of “demand” from businesses, and that the overall R&D intensity and productivity of the UK business sector continue to be low compared to that in other OECD countries.
4.4 Knowledge Transfer Activities of Universities and PSREs
4.4.1 The Variety of Knowledge Transfer Activities
Knowledge transfer channels have been comprehensively classified in recent work by the National Centre for Universities and Business (NCUB 2016a, 2016b) into four categories: commercialization, problem-solving, people-based, and community-based activities. Commercialization activities include patenting, licensing research, consulting, and spinning out companies. Problem-solving activities include joint publications, joint research, consultancy services, prototyping and testing, research consortia, contract research, hosting personnel, providing informal advice, external secondment, and setting up physical facilities. People-based activities include standard-setting forums, participating in networks, attending conferences, student placements, giving invited lectures, curriculum development, sitting on advisory boards, employee training, and enterprise education. Community-based activities include social enterprises, museums and art galleries, public exhibitions, heritage and tourism, community-based sports, performing arts, school projects, and lectures for the community. While universities have been engaging in people-based and community-based activities for a long time, the literature has only relatively recently begun to acknowledge their importance in disseminating and sharing academic knowledge to the public (British Academy 2008, 2010; Reference Olmos-Peñuela, Benneworth and Castro-MartínezOlmos-Peñuela, Benneworth and Castro-Martínez 2014; Campaign for Social Science 2015).
Figure 4.4 shows the shares of academics and of PSRE staff who engage in each type of activity. Commercialization and problem-solving activities are relatively more important for PSRE staff than for academics, while the converse is true for people-based and community-based activities. This may be due, in part, to differences between fields of science, since commercialization and problem-solving are particularly important in engineering and materials science, while the arts and humanities and the social sciences, which are not represented in the set of PSREs considered in this study, lead in community-based and people-based activities respectively (NCUB 2016a). It is also apparent that both academics and PSRE staff engage far less in commercialization activities than in all other activities. In line with a large amount of evidence suggesting that IP-based activities are concentrated in a few fields, commercialization is particularly high among engineering and materials science academics, and among BBSRC-affiliated PSRE staff.

Figure 4.4 Shares of university and PSRE staff involved in different types of knowledge transfer activity
A more fine-grained analysis comparing the shares of academics (excluding those in the social sciences and the arts and humanities, for greater comparability) and the shares of PSRE staff who engage in each of the activities listed under the four main categories of commercialization, problem-solving, people-based, and community-based activities, suggests that the pattern of engagement is very similar. Academics are marginally more engaged in most activities, except for joint research, research consortia, giving informal advice, and attending conferences, while PSRE staff are marginally more active in several community-based activities. It appears that, in spite of the lack of specific policy schemes supporting PSREs’ knowledge transfer activities, PSRE staff engage with external stakeholders through a variety of channels.
4.4.2 Engagement in IP Commercialization
While commercialization of IP has historically been considered an important avenue for university–industry knowledge transfer, in practice, it involves fewer academics and generates less income than all other knowledge transfer channels. There is a substantial amount of research investigating the patterns and determinants of university patenting, licensing, and spinouts in the United Kingdom. Table 4.2 presents the evolution of a subset of indicators of IP-related activities for the period from 2003–4 to 2014–15. IP income increased at about 11 percent per year, excluding the exceptionally good performance of 2008, which was largely due to one university selling its share of a well-established company (HEFCE 2010). Income from other knowledge transfer activities increased on average by 10.9 percent per year. However, these two types of income are very different in magnitude, with income from IP accounting on average for only 2.8 percent of total annual income from knowledge transfer. The number of patents applied for and granted (both national and international filings, but not counting multiple filings of the same patent in different countries) increased on average by 5.3 percent and 8.3 percent respectively each year. From the mid-2000s there appears to have been a leveling-off in the growth of university-owned patents. This matches the experience of the U.S., another country with a long tradition of institutional IP ownership (Reference Mowery, Sampat, Fagerberg, Mowery and NelsonMowery and Sampat 2005; Reference Tang, Wecowska, Campos and HobdayTang et al. 2009). Over time, knowledge transfer offices (KTOs) have gained experience in realistically assessing inventions’ commercial and licensing potential, and have therefore become more selective in deciding whether patent applications should be made (Reference Tang, Wecowska, Campos and HobdayTang et al. 2009). As a consequence, the quality of university patents has improved, as suggested by several trends: an increase in the number of nonsoftware license agreements, an increase in the share of spinouts surviving for more than three years, and an increase in the share of patent applications that are eventually granted.
Table 4.2 Indicators of research commercialization activities in UK universities
| 2003–4 | 2004–5 | 2005–6 | 2006–7 | 2007–8 | 2008–91 | 2009–10 | 2010–11 | 2011–12 | 2012–13 | 2013–14 | 2014–15 | |
|---|---|---|---|---|---|---|---|---|---|---|---|---|
| FTE staff employed in commercialization offices | 1,508 | 1,518 | 1,612 | 1,829 | 1,910 | 2,001 | 2,975 | 2,209 | 2,269 | 3,395 | 3,720 | 3,936 |
| A) Patent applications | 1,308 | 1,648 | 1,536 | 1,913 | 1,898 | 2,097 | 1,994 | 2,256 | 2,274 | 1,936 | 2,076 | 2,156 |
| B) Patents granted | 463 | 711 | 577 | 647 | 590 | 653 | 820 | 757 | 826 | 951 | 969 | 953 |
| C) Formal spinouts established | 167 | 148 | 187 | 226 | 219 | 191 | 207 | 236 | 170 | 131 | 130 | 129 |
| D) Formal spinouts still active after three years | 688 | 661 | 746 | 844 | 923 | 982 | 806 | 825 | 818 | 793 | 802 | 836 |
| E) IP income (£ million)1 | 49 | 71 | 70 | 69 | 76 | 140 | 92 | 74 | 83 | 89 | 133 | 155 |
| F) Other knowledge transfer income (£ million),2 of which: | 2,479 | 2,549 | 2,688 | 3,054 | 3,158 | 3,188 | 3,284 | 3,448 | 3,487 | 3,588 | 3,840 | 4,020 |
| Collaborative research | 699 | 665 | 725 | 791 | 802 | 821 | 819 | 930 | 915 | 979 | 1,156 | 1,257 |
| Consultancy | 272 | 281 | 294 | 340 | 385 | 372 | 397 | 395 | 418 | 412 | 446 | 442 |
| Contract research | 745 | 773 | 792 | 925 | 960 | 1,052 | 1,075 | 1,123 | 1,148 | 1,201 | 1,205 | 1,210 |
| CPD | 282 | 347 | 349 | 415 | 442 | 430 | 445 | 439 | 437 | 435 | 430 | 443 |
| CPD and CE | 99 | 127 | 142 | 159 | 176 | 197 | 189 | 207 | 236 | 237 | 255 | 272 |
| Facilities and equipment-related services | 103 | 95 | 109 | 110 | 119 | 124 | 126 | 137 | 146 | 146 | 165 | 191 |
| Regeneration and development programs | 279 | 261 | 276 | 314 | 274 | 193 | 233 | 217 | 189 | 177 | 183 | 205 |
| Ratio E/F (%) | 2.0 | 2.8 | 2.6 | 2.3 | 2.4 | 4.4 | 2.8 | 2.1 | 2.4 | 2.5 | 3.5 | 3.9 |
1 Includes income from license agreements involving patents, copyright, design registrations, and trademarks.
2 Includes income from collaborative research, research contracts, consultancies, facilities and equipment, CPD, CE courses, and regeneration programs.
Despite the large number of universities that engage in patenting and spinning out (between 2009–10 and 2014–15, 122 universities filed at least one patent, generated income from IP, or created at least one spinout company), the bulk of these activities are concentrated in a subset of research-intensive universities with a substantial presence in engineering, materials science, biology, chemistry, and veterinary science (NCUB 2016a). In 2014–15, six institutions (3.7 percent) produced 40 percent of patent applications, and twenty-five institutions (16 percent) produced 80 percent of patent applications. The distribution of IP income is even more concentrated: just three institutions (1.8 percent) produced 41 percent of IP income, and seventeen institutions (11 percent) produced 80 percent of IP income. Twenty-seven institutions (17 percent) produced 80 percent of income from research contracts. The skewed distributions of patent income might suggest a skewed ability of institutions to produce high-quality patents, since evidence suggests that patents licensed to industry are of better quality than patents that are not licensed (Reference SterziSterzi 2013).
Figure 4.5 summarizes some of the data from Table 4.2. The number of new spinouts established each year has been quite stable (although declining in recent years), but the number of spinouts surviving at least three years has increased. While failure rates remain high and a great number of spinouts may still not survive in the long run (HM Treasury 2003), the survival rateFootnote 14 of university spinouts in the United Kingdom is high by comparison with many other countries (Reference Lawton Smith and HoLawton Smith and Ho 2006).

Figure 4.5 Patenting and spinout activities of universities
One interesting aspect of Figure 4.5 is the close relationship between patents granted and spinout activity. It has been argued that patent licensing and spinning out companies are alternative modes of commercializing research results, and that one or the other will prevail depending on institutional and context conditions. International evidence suggests that those countries that have maintained an inventor-ownership model (such as Sweden and Italy) focus more on spinouts than countries that have a university-ownership model, which tend to focus on patent licensing. The University of Cambridge seems a case in point. Before its switch to the institutional-ownership model in 2005, the University of Cambridge had, for a long time, uniquely maintained a professor’s privilege system similar to that implemented in Germany and the Nordic countries. Cambridge’s historic success at spinout creation (Reference Athreye, Breshanan and GambardellaAthreye 2004) might suggest that the lack of institutional ownership acted as an incentive to commercialize research results via spinout companies instead of relying on patent licensing.
However, the analysis of patenting and spinout data over time suggests that universities that make more income from technology licensing and file more patents may also create more successful spinouts. This relationship is consistent with the skew in the generation of new science noted earlier and suggests that universities have developed a range of competencies that allow them to engage in both licensing and spinouts. A growing literature on university KTOs appears to tell a similar story. Reference Tang, Wecowska, Campos and HobdayTang et al. (2009) reported that KTOs have improved their ability to explain the commercialization processes and options to academics, and to work with academics on defining appropriate IP ownership arrangements and financial incentives. Most KTOs continually review and restructure their strategies, and promote themselves as interface organizations between the academics (and university) and external parties, including venture capitalists (Reference ChughChugh 2004). The number, experience, and knowledge of KTO staff have been found to be positively related to the number of spinouts (Reference Lockett and WrightLockett and Wright 2005; Reference Powers and McDougallPowers and McDougall 2005) and to the quality of the advice and contacts they provide (Reference Franklin, Wright and LockettFranklin, Wright, and Lockett 2001). The number of university spinouts is also positively correlated with university R&D spending, spending on IP disclosure, and the ability to develop new business (Reference Lockett and WrightLockett and Wright 2005) – but it is quite likely that these factors also determine how many patents the university can apply for. The ability to generate spinout companies also depends on university characteristics (such as institutional reputation, which makes it easier for academics to bring together resources to create spinouts, and the presence of cultures or norms that nurture entrepreneurial activity (Reference DiGregorio and ShaneDiGregorio and Shane 2003), and on external factors like the availability of local venture capital: the level of investment in firms located ten miles from a venture capital head office is double that of firms sited 100 miles away (Reference Wright, Vohora and LockettWright et al. 2004), and on individual attributes and experience (Reference Clarysse, Tartari and SalterClarysse, Tartari, and Salter 2011).
Information about the commercialization activities of PSREs is collected less systematically than information about universities’ knowledge transfer activities. Between 2003 and 2004, the Department for Business, Innovation, and Skills (BIS 2011a, 2014) carried out seven surveys of knowledge transfer activities in all the PSREs funded by government departments and by the research councils, as well as in cultural institutions and regional NHS hospital trusts. Table 4.3, drawn from the latest available study (BIS 2014), shows grossed-up estimates for the whole sector. PSREs’ commercialization activities have grown over time –the number of FTE staff in commercialization offices has grown by about 36 percent – as has business representation on their governing boards. As a group, PSREs outperform universities on a range of metrics. If we compare data from universities and PSREs in the last year for which they are available (2012–13), it is interesting to observe that while the number of patent applications by PSREs is much lower (322 versus 1,936 by universities), their probability of being granted is much higher (two-thirds versus less than half) and so is their income from licensing (£195 million versus £61 million). Consequently, the average licensing income per granted patent is much higher for PSREs (£570,175) than for universities (£64,143), although we do not have information about the distributions: it is possible that a small number of blockbuster patents account for the largest share of income, for either or both PSREs and universities.
Table 4.3 Summary indicators of research commercialization activities in UK PSREs
| 2003–4 | 2004–5 | 2005–6 | 2006–7 | 2007–8 | 2008–9 | 2012–13 | |
|---|---|---|---|---|---|---|---|
| Number of PSREs covered | 107 | 116 | 135 | 138 | 138 | 143 | grossed-up values |
| FTE staff employed in commercialization offices | 385 | 368 | 513 | 669 | 486 | 448 | 611 |
| A) Patent applications | 316 | 335 | 290 | 316 | 379 | 392 | 322 |
| B) Patents granted | 228 | 148 | 193 | 172 | 188 | 230 | 342 |
| C) Formal spinouts established | 69 | 84 | 74 | 101 | 89 | 83 | 143 |
| D) IP income (£ million) | 33 | 46 | 186 | 116 | 146 | 198 | 195 |
| E) Income from consultancy (£ million) | 36 | 31 | 26 | 43 | 37 | 100 | 166 |
| F) Income from use of facilities and equipment and training (£ million) | 133 | ||||||
| Ratio D/(E+F) (%) | 91.7 | 148.4 | 715.4 | 269.8 | 394.6 | 198.0 | 65.2 |
Table 4.3 also shows that PSREs’ commercialization activities have been on the rise. Although patent applications have not increased much, the number of patents granted has increased. The number of spinouts doubled between 2008–9 and 2012–13, with PSREs owning some equity in 93 percent of these cases. Income from commercialization activities including business consultancy has also increased dramatically over time, and particularly since 2008–9. By way of contrast, a steady increase in licensing agreements (and corresponding income) in the early years has been followed by a decline in the last three years. Unlike universities, PSREs derive most of their knowledge transfer income from IP; for most of the period covered, income from IP was several times larger than income from consulting and other sources. Only in the most recent survey has the situation has changed: with IP income stable and rapid growth in other sources of knowledge transfer income, the former has dropped to only 65 percent of the latter. By contrast, universities’ income from other knowledge transfer activities is much higher than that of PSREs (£2,269 million versus £299 million), indicating that universities engage in a broader range of activities.

In comparing the commercialization activities of universities and PSREs, we may wonder whether we are comparing like with like. With 161 universities, the university sector is likely to be far more diverse than the thirty-five PSREs focused narrowly on a few subject areas. A narrow focus is more likely to generate economies of specialization in research, which are much harder for universities to achieve given their broader mandate.
Data collected from two surveys by NCUB, one of academic staff (NCUB 2016a) and one of PSRE staff (NCUB 2016b), allows us to perform some comparisons. It is apparent that PSRE staff can dedicate the majority of their time to research rather than teaching and administration, which instead take up a large part of university academics’ time. Even though academics in the sciences spend on average a greater share of their time on research than academics in the social sciences and humanities, they still devote much less time to research than PSRE staff. However, while this might explain why a PSRE researcher produces more output than an academic, it still does not explain why their research enjoys greater commercial success.
PSREs’ greater success in commercialization may be explained by their greater focus on more applied, mission-oriented research. However, whether PSREs’ research is more applied than that conducted at universities is not clear. A comparison using NCUB data (2016a and 2016b) of the time allocated by academic and PSREs researchers between pure basic, user-inspired basic and applied research (as defined by the Frascati Manual, OECD 2003, pp. 77–9) suggests that the differences between research fields are greater than those between universities and PSREs: in both sectors, researchers in health and engineering spend relatively more time doing applied research, while researchers in biology, chemistry, and the natural sciences spend relatively more time doing basic research. Hence, categorizing research according to its objectives does not seem to reflect the commercialization potential of the resulting outcomes.
Another explanation might be that PSREs are more oriented to fields that are characterized by immediate commercial applicability, such as computer science and biotechnology. Data on the distribution of PSRE staff across fields of research are not collected systematically. By integrating information on the orientation of PSREs to various research fields (BIS 2015) with data on the number of staff employed in PSREs in 2012–13 (BIS 2014), we can estimate the share of PSRE staff in each field. These shares can be compared with the distribution of academics in each field in the same year. Considering only academics and PSRE staff employed in the sciences, we find that universities have greater shares of staff in medicine and in engineering and technology, while PSREs have greater shares of staff in the natural sciences (particularly biology, environmental, and sustainability studies) and in agriculture and veterinary science. While this shows different patterns of specialization in the two sectors, it is not immediately possible to deduce information about the ease of commercial applicability of the resulting research outcomes.
One reason why it is not so easy to explain the differential commercialization success of universities and PSREs is that the government is likely to have privatized, over time, exactly those PSREs whose research results could be commercialized more easily, since these would be more likely to survive without government funding. Therefore, the remaining PSREs are more likely to focus on the production of research outcomes that are less likely to generate large private returns, and which are thus more similar to the kind of research outcomes produced by universities. Academics and PSRE staff appear to have similar patterns of engagement in different channels of knowledge transfer, and to initiate interactions with external partners in similar ways. Further research in this area should adopt more fine-grained units of analysis. In particular, given that PSREs focus on narrow fields of research, their knowledge transfer performance should be compared with that of university departments or even research centers engaged in similar fields. Data at this level are currently not available systematically and would require ad hoc data collection.
4.4.3 Industry Demand for Knowledge from Universities and PSREs
Universities in the United Kingdom interact with a variety of industries. According to data from HESA, almost all universities work with organizations in the education, health and arts sectors, while three-quarters work with manufacturing. Almost every industrial sector draws on university knowledge: only five sectors approached fewer than eighty universities, and of these, only two sectors approached fewer than forty. However, when businesses are asked about their sources of knowledge for innovation, universities are not ranked highly: the most frequently cited sources of knowledge are the company itself, clients or customers, suppliers, and competitors in the same line of business (Reference Hughes and MartinHughes and Martin 2012). The fact that only 1 percent of the businesses report using the business sector alone, while 18 percent report using the business sector together with intermediaries, and over 80 percent report using some combination of sources from all three groupings, suggests that businesses use university knowledge in combination with other sources.
Data from the most recent Community Innovation Survey (BIS 2016) provide additional information about business engagement with universities. In the CIS sample of 15,091 companies,Footnote 15 between January 1, 2012 and December 31, 2014, 7 percent of the companies collaborated on innovation activities with universities or other higher education institutions, and 5 percent collaborated on innovation activities with government or public research institutes. Table 4.4 shows a cross-tabulation of information on collaboration on innovation activities with universities and government or public research institutes. A total of 729 companies collaborated with the government, 1,068 with universities, 593 with both government and universities, 136 with the government but not with universities, and 475 with universities but not the government. The vast majority of firms (13,887) collaborated with neither universities nor government.
Table 4.4 Collaboration with universities and governments
| Collaborated with government? | Total | |||
|---|---|---|---|---|
| No | Yes | |||
| Collaborated with university? | No | 13,887 | 136 | 14,023 |
| Yes | 475 | 593 | 1,068 | |
| Total | 14,362 | 729 | 15,091 | |
Breaking down these data further, we find that of the CIS sample of 15,091 companies, 13 percent collaborated on innovation activities in the United Kingdom at the regional level, 19 percent collaborated at the national level, 9 percent collaborated with European countries, and 8 percent collaborated with non-European countries. However, relatively few companies collaborated with either universities or government, as can be seen from Table 4.5.
Table 4.5 Cooperation on innovation activities with universities and government at different geographical levels
| Cooperates on innovation activities with government or public research institutes | |||||
|---|---|---|---|---|---|
| Cooperation on innovation activities with universities or other higher education institutions | None | Nationally | Internationally | Nationally and internationally | Total |
| None | 13,887 | 120 | 10 | 6 | 14,023 |
| Nationally | 422 | 358 | 10 | 16 | 806 |
| Internationally | 20 | 9 | 117 | 2 | 148 |
| Nationally and internationally | 33 | 25 | 8 | 48 | 114 |
| Total | 14,362 | 512 | 145 | 72 | 15,091 |
According to Reference Abreu, Grinevich, Hughes, Kitson and TernouthAbreu et al. (2008), who surveyed 1,449 UK firms, the channels most frequently used by firms to access university knowledge were the distribution of scientific knowledge through open science (publications and scientific conferences) and the appointment of graduate personnel. These far outstripped direct research collaborations between universities and firms (through research collaborations, research contracts and consultancies), while patents and licenses were used least of all. Data from HESA show differences between large firms and SMEs in the use of university IP: SMEs and non-commercial organizations generate 42 percent of universities’ non-software licensing income, 64 percent of software licensing income, and 98 percent of other IP income (including income from copyright licensing).
4.5 Organizational Practices in Knowledge Transfer
Universities in the United Kingdom have very different knowledge transfer strategies (Reference Hewitt-DundasHewitt-Dundas 2012) which tend to be aligned to their organizational goals and objectives (Reference BucklandBuckland 2009) and to their tangible and intangible resources (research intensity, subject specialization, entrepreneurial culture, competencies within the KTO) (Reference Hewitt-DundasHewitt-Dundas 2012; Reference Kitagawa, Sanchez-Barrioluengo and UyarraKitagawa et al. 2016; Reference RossiRossi 2017). Typically, knowledge transfer channels based on exploiting IP (patent licensing, spinouts) and research contracts are more prevalent in research-intensive institutions and in those that include science, engineering, and medical subjects. In these institutions, the research and grants office may manage a larger share of university income than the KTO. By contrast, more teaching-intensive institutions tend to focus on consultancy, the provision of CPD, and regeneration programs (Reference Hewitt-DundasHewitt-Dundas 2012) aiming to provide skills and knowledge to their local communities (Reference Jones and CravenJones and Craven 2001; Reference Meagher, Lyall and NutleyMeagher, Lyall, and Nutley 2008; Reference Wright, Clarysse, Lockett and KnockaertWright et al. 2008). Universities specialized or oriented toward engineering, natural sciences, or information technology mainly interact with industry partners, while those specialized in the humanities, arts, and social sciences usually interact with public bodies, nonprofit organizations, and other community groups with lower purchasing power (Reference Benneworth and JongbloedBenneworth and Jongbloed 2010).
While different types of universities may prioritize different types of knowledge transfer activities, it is unclear which of these approaches bring the greatest economic returns: universities that are less research-intensive often receive more funds from industry than those that have a profile of research excellence (Reference GeunaGeuna 1999). Compared with top universities, mid-range universities engage in a wider range of knowledge transfer activities (Reference Wright, Clarysse, Lockett and KnockaertWright et al. 2008) and serve a broader range of stakeholders (Reference De LaTorre, Rossi and SagarraDe La Torre, Rossi, and Sagarra 2017).
The knowledge transfer management practices adopted by universities are likely to play a role in their performance. Several studies have attempted to categorize different models for managing knowledge transfer activities. Reference Rogers, Helmers, Baghurst and PollardRogers et al. (2009) identify four main models of research commercialization: the Cambridge Inventor-Ownership Model, based on academics’ direct ownership of the IP originating from their research; the In-House Model, where the university manages the entire knowledge transfer process through an internal organization; the Stand-Alone Company Model, where the university establishes a dedicated, independent limited company to act as a conduit between university research and business; and finally the Hybrid Model, where the university signs a long-term partnership agreement that grants a private company a share in the university’s IP (and income generated from its commercialization) in exchange for advice, funding, and expertise. A not-dissimilar classification was provided by Reference Tang, Wecowska, Campos and HobdayTang et al. (2009), who distinguished between having an internal organization wholly within the university structure, an organization operating outside of the university but reporting to it, an external nonprofit-making organization wholly owned by the university but operating autonomously and reporting to a board for all decisions, and an external profit-making commercial organization listed on the stock exchange.
Using survey data for 2006 and 2007, Reference Rogers, Helmers, Baghurst and PollardRogers et al. (2009) showed that the share of universities using the services of external agents was increasing. Unsurprisingly, the universities that managed their IP licensing and filing internally tended to have larger KTOs. Even those universities that fully outsourced their IP activities and those that did not engage in IP at all still maintained an internal department for the management of other types of knowledge transfer activities. However, despite the variety of models, KTOs tended to centralize all university invention and commercialization activities and required all academic staff to notify them of their discoveries and to delegate all rights to negotiate licenses on their behalf. This prompted some (Reference Rogers, Helmers, Baghurst and PollardRogers et al. 2009; Reference Tang, Wecowska, Campos and HobdayTang et al. 2009) to call for more varied approaches to knowledge transfer.
In a more recent study, Reference Sengupta and RaySengupta and Ray (2017) suggest that models of knowledge transfer governance have indeed grown more decentralized over time. By focusing on two dimensions – the extent to which knowledge transfer management is outsourced or performed in-house, and the extent to which knowledge transfer responsibilities are centralized or devolved to individual departments – their study identifies four models: coordinating KTO: most knowledge transfer functions are devolved to departments and performed in-house; absentee KTO: most knowledge transfer functions are devolved to departments and outsourced; traditional KTO: most knowledge transfer functions are controlled centrally and performed in-house; outward-facing KTO: most knowledge transfer functions are controlled centrally, with some outsourced. They also argue that: (1) universities whose strategy involves engagement with research users are more inclined to devolve a higher proportion of knowledge transfer responsibilities to departments, and (2) universities that exhibit relatively high volumes of application-oriented research outputs are more inclined to wholly or partly outsource key KTO functions to external organizations.
According to data from HESA, in 2013–14 only nineteen universities out of 161 (11.8 percent) did not have a formal KTO. The remaining 142 had an internal KTO or a subsidiary company (either majority or minority owned), or both. The functions of the KTO included providing support for SMEs (82 percent), drawing up contracts for various kinds of knowledge transfer interaction (66 percent), and providing indemnity insurance for staff (87 percent).
Most universities had some infrastructure to manage the filing and commercialization of patents and other types of IP. As many as 146 universities (91 percent) had a formal structure (whether an internal office or external agency) in place to support the process of seeking protection for their IP. Eighty-four percent also had a formal structure (whether an internal office or external agency, or both) to support IP commercialization. Infrastructures to support academic and student entrepreneurship were also widespread: most universities provided business advice and entrepreneurship training services, followed by seed-corn investment and incubators, and finally by venture capital and science park accommodation. All these services were provided either directly by the university or by a partner organization, or both.
Most universities implemented incentives for academics to engage in knowledge transfer and to disclose their activities to the institution. Compulsory disclosure requirements were widespread. Furthermore, 80 percent of universities rewarded their staff individually (financially or by other means) for the IP they generated, and most universities (91 percent) believed that staff had medium or high incentives to engage in knowledge transfer. Academics’ freedom to engage in private consulting activities presented a more mixed picture, since only 34 percent reported that they had a policy allowing them to do so; those that did allowed academics to spend, on average, twenty-eight days per year on private consulting.
Despite the vast improvement in KTOs’ resources, competencies and strategies, a number of bottlenecks and barriers to knowledge transfer persist (Science and Technology Committee 2017). These include lack of access to finance to commercialize research, particularly early-stage funding and sustained funding for longer-term commercialization projects; difficulty in valuing IP assets and a lack of negotiating skills; the complexity of the policy support mechanisms for research and innovation; and the lack of a clear role for regional policymaking bodies in supporting knowledge transfer.
4.6 Conclusion
In the United Kingdom, as in many other countries, there has been a recurrent concern that university engagement with industry is not part of the institutional ecosystem for innovation in the way that such engagement is for US universities (Reference Rosenberg and NelsonRosenberg and Nelson 1994). In order to promote knowledge transfer, the UK government, while concerned to make the academic sector accountable for the public science funding it receives, has always preferred a light-touch approach based on the creation of appropriate incentives rather than centralized management. This incentive-based approach to policy, combined with universities’ extensive operational flexibility and autonomy (whereby they have extensive freedom to alter courses, compete for students and research with other universities, hire faculty and develop new revenue streams), makes the UK university system more similar to the U.S. one than to higher education systems in continental Europe. At the same time, the reliance on public funding has made it less similar to the U.S. and more similar to Europe. This halfway positioning of the UK model provides an interesting case study for those countries with predominantly publicly-funded systems that intend to adopt an incentive-based approach to policy.
The UK case study confirms that knowledge transfer as a phenomenon is characterized by strong path dependency and a symbiotic relationship with the underlying socioeconomic structure of the country and its regions. The United Kingdom’s older, most research-intensive institutions have historically maintained strong relationships with industry, including with large industrial firms and the public sector, including defense. Policies directed at supporting knowledge transfer have allowed these universities to institutionalize knowledge transfer processes that were previously carried out by individual academics and research groups, and to increase the scale of their knowledge transfer engagement. Intensive engagement with industry via research contracts and patent commercialization remains typical of a small number of institutions. Other universities, particularly those that were previously vocational training colleges, also had historical relationships with industry, but these mainly revolved around training and problem-solving activities. For these universities, the institutionalization of knowledge transfer has mostly implied a scaling-up of their training and consultancy operations. Hence, universities’ growing incentives to engage in knowledge transfer have led them to build on their preexisting networks, competencies and capabilities, and to develop models of engagement that are in harmony with the needs of the actors in their local social and economic context.
We can also draw some lessons from the specific kind of incentives that the UK system has generated. The main policy tool used by the UK government to foster university–industry interaction and knowledge transfer has been the provision of performance-based funding in order to create financial incentives for universities to engage in knowledge transfer activities and achieve measurable results that can be rewarded economically. This is different from the U.S. model, where individuals are rewarded for better performance by direct income-generating activities, often taxed very lightly. However, universities in the United Kingdom do reward their star scientists and researchers with better pay and promotion prospects, reflecting their reliance on such individuals’ performance to attract research income. Moreover, since knowledge transfer activities are income-producing in themselves, in a period of prolonged decline in public funding, universities have had strong incentives to engage in knowledge transfer activities irrespective of the presence of policy schemes.
Universities’ incentive to play to their strengths by engaging in those activities where they are more likely to be successful, and the government’s lack of precise direction on what activities they should be engaging in, has led universities to adopt a varied range of modes of engagement, in terms both of the variety of knowledge transfer activities undertaken and of the organizational models they have adopted in order to carry them out. The variety of approaches shows a broad experimentation with a strategy that best suits the comparative advantages of the university.
At the same time, there are some risks inherent in having a system of incentives to engage in knowledge transfer that are primarily monetary in nature. First, they may encourage universities to refrain from engaging in activities that are beneficial for society while generating little or no income for the university (Reference Rossi and RosliRossi and Rosli 2015). Second, these incentives may encourage universities to focus predominantly on forms of research that are certain to bring economic rewards in the relatively short term, moving away from more uncertain and risky basic research. A reorientation of the system toward more commercializable research appears to have occurred in the PSRE sector, too. However, this raises the question whether the UK system is generating enough basic research on its own to keep it at the science frontier and make it possible to quickly absorb and exploit new technology – a question that is particularly pressing in the context of the present productivity stagnation in the UK economy (see, e.g., The Economist 2017). Evidence from the United Kingdom that high levels of engagement in patenting on the part of academics (in both applied and theoretical fields) reduces their scientific productivity (Reference Crespi, D’Este, Fontana and GeunaCrespi et al. 2011; Reference Banal-Estanol, Jofre-Bonet and LawsonBanal-Estanol, Jofre-Bonet, and Lawson 2015) suggests that a broader debate on the effects of strong incentives to engage in knowledge transfer on the amount and nature of basic research pursued in academia should be had.
Hence, policymakers should think very carefully about the consequence of performance-based funding on the performance of the overall system. Public funding of R&D rests on the argument that there is a market failure that leads to private underinvestment in basic research. Creating a system of monetary incentives for universities based on success at commercialization risks undermining this basic goal. If universities are to continue to engage in basic research, we have to accept that some universities may never do knowledge transfer – there must be slack in the system.
As in everything else, we have come full circle but the golden mean remains elusive.
5.1 Introduction
The transfer of knowledge and technology is a key task of publicly financed research in Germany. This chapter analyzes the structures and processes for such transfer, based on a review of scholarly literature as well as original qualitative and quantitative research.
Germany is a federal republic, and some major governmental tasks, including science and education, are administered at the level of each state (Land; plural Länder). Germany’s sixteen states thus administer their own education systems, including universities and other institutions of higher education (HE). As a result, the public science landscape in Germany is very diverse.
Universities and other HE colleges are not the only significant research organizations in Germany. In addition, the governments of the Länder and the federal government maintain a number of important public research institutes, some of which are much more focused on science and knowledge transfer than universities and other HE colleges are. The Fraunhofer Association in particular engages in highly industry-relevant research, and the Helmholtz Association, the Max Planck Association, and the Leibniz Association are also important players in public science. These institutions are supplemented by a number of public research institutes financed by the Länder.
Because the public science and education system is decentralized across the sixteen states, there is a dearth of centrally collected data about knowledge transfer. This chapter draws on several different sources but only a few official public statistics; most data were collected manually from the Internet, academic publications, and various policy reports, mostly published only in German.
The chapter is structured as follows. In Section 5.2, we outline the German landscape of public scientific organizations. This is followed in Section 5.3 by a discussion of common channels of knowledge transfer. Section 5.4 discusses policies designed to enhance science and knowledge transfer, while Section 5.5 reviews the main findings of the scholarly literature concerning knowledge transfer in Germany. We then present our own research findings from interviews with selected university knowledge transfer offices (KTOs) and policymakers as well as results from a survey sent to all KTOs at German universities. A final section summarizes our conclusions.
5.2 The Role of Universities and Public Research Institutes in Germany’s National Innovation System
According to the German Federal Statistical Office,Footnote 1 the higher education system consisted of 427 institutions in 2014/2015, including 107 universities and 217 universities of applied sciences (Fachhochschulen).Footnote 2 In addition, there were six pedagogical colleges, sixteen theological colleges, fifty-two colleges for arts and twenty-nine public administration colleges. Without question, the main knowledge transfer channel from these institutions to industry is the education of highly skilled labor. Figure 5.1 shows trends in numbers of students at different types of HE college. Between 1994 and 2015, the overall number of students increased from about 1.9 million to almost 2.8 million. While the share of colleges of arts, pedagogics, theology, and administration remained small at between 3 to 4 percent, the share of students at universities of applied sciences increased from 21 percent to 34 percent.

Figure 5.1 Number of students at different types of HE college in Germany
In addition to the HE colleges, Germany has several important research institutes: the Fraunhofer Association, the Helmholtz Association of German Research Centres, the Max Planck Association, the Leibniz Association, and several others with research missions that are financed either by the federal government or the Länder.
Figure 5.2 shows the distribution of R&D expenditure in Germany in 2010. According to the Federal Ministry of Education and Research (BMBF), total R&D expenditure amounted to about EUR 67 billion, with about EUR 45 billion spent by the private sector, and EUR 22 billion by the public sector. Universities and other HE colleges spent about 54 percent of that EUR 22 billion. The rest was distributed among public research institutes, with the largest share of 15 percent being spent by the Helmholtz Association, followed by the Max Planck and Fraunhofer Associations with about 7 percent each, and the Leibniz Association with 5 percent. The other public research institutes spent about 12 percent of the total public research budget.

Figure 5.2 Distribution of R&D expenditure in 2010.
The Fraunhofer Association’s research activities are conducted by sixty-nine institutes and research units at locations throughout Germany. It employs around 24,500 people, who work with an annual research budget totaling EUR 2.1 billion. Of this, EUR 1.9 billion is generated through contract research. More than 70 percent of its contract research revenue is derived from contracts with industry and from publicly financed research projects (Fraunhofer Association 2015).
The Helmholtz Association of German Research Centres was created in 1995 to formalize existing relationships between several independent research centers that are mainly engaged in “Big Science.” It employed 38,237 people in 2015, and distributes core funding from the BMBF to its eighteen autonomous research centers. The 2015 budget amounted to EUR 4.45 billion, with roughly two-thirds coming from public sponsors (split 9:1 between federal and state authorities). The individual Helmholtz Centres attract more than 30 percent of funding themselves through contracts with public and private sector sponsors (Helmholtz Association 2016).
The Max Planck Association consists of eighty-three institutes (including five abroad) and mainly engages in basic research. As at January 2016, it had a total of 22,197 staff. The federal and state governments each provide half the institutional funding for its budget, which totaled around EUR 1.8 billion in 2016 (Max Planck Society for the Advancement of Science 2016).
The Leibniz Association is a conglomerate of research institutes that are members of the so-called Blue List – institutes that were originally founded by the Länder, but which are now regarded as being of federal importance and therefore cofinanced by the federal government. In 2015, Leibniz comprised eighty-nine institutes employing 18,476 people with a total budget of EUR 1.73 billion, of which around 21 percent came from third-party funding.Footnote 3
Table 5.1 summarizes some key features of the major public research institutes.
| Fraunhofer | Helmholtz | Max Planck | Leibniz | |
|---|---|---|---|---|
| Orientation | Applied | Big Science | Basic | Diverse |
| Institutes | 69 | 18 | 83 | 89 |
| Staff | 24,500 | 38,237 | 22,197 | 18,476 |
| Budget | EUR 2.1 billion (EUR 1.9 billion from contract research) | EUR 4.45 billion (2/3 from public sponsors; 9:1 federal–state split) | EUR 1.8 billion (50:50 federal–state split) | EUR 1.73 billion (21 percent third-party funding) |
5.2.1 Knowledge Transfer Prior to the 2000s
The knowledge and technology transfer (KTT) activities of German universities/HE colleges and public research institutes differ, reflecting their differing missions. Based on a survey of professors at universities and Fachhochschulen plus heads of departments at public research institutes, Reference Czarnitzki, Rammer and SpielkampCzarnitzki et al. (2000) assessed the extent to which different institutions met preconditions for KTT and how much KTT they actually carried out. This analysis was further developed by Reference Edler and SchmochEdler and Schmoch (2001), and is shown in Figure 5.3.

Figure 5.3 KTT missions and activities of different institutions in German public science
Information on the preconditions for KTT was derived from institutions’ mission statements supplemented by their size in terms of budgets and staff as well as their thematic orientations. These preconditions were then compared to the actual extent of KTT activities, as derived from the survey responses of almost 1,000 professors and heads of department. The extent of KTT takes into account the industry affinity of each institution’s research, its interaction with industry, staff mobility between the institution and industry, and research funding obtained from industry.
Institutions are localized on the “KTT activity map” roughly according to their missions. The Fraunhofer Association had the highest predisposition for KTT to industry and also achieved the highest extent of KTT. It was followed by technical universities as a distinct subgroup of universities that are well suited to KTT because they generally focus on subjects that are highly relevant to industry. The Helmholtz Association seemed to meet many preconditions for KTT but was less active in practice than the technical universities. There were then significant variations among other universities and universities of applied sciences in terms of preconditions for KTT. Some faced significant barriers, such as understaffed KTOs and misaligned incentives. Of all the institutions, the Max Planck Association was least active in KTT, reflecting its basic research mission within the public science system.
5.2.2 Knowledge Transfer at a Glance
Knowledge Transfer from Universities
As the universities and Fachhochschulen are administered by the Länder, no comprehensive metrics on KTT exist centrally and we are obliged to use secondary data sources. The Munich Innovation Group (2013) published a study comparing patent applications by German universities with those by Chinese institutions, and analyzed the PATSTAT database of the European Patent Office, which contains data from many different national patent offices.Footnote 4 The fifteen German universities with the highest patent activity between 1990 and 2009 are shown in Table 5.2. To compare this ranking with research activity, the table also includes the fifteen top-scoring universities in terms of research publication citations based on the Scopus database as well as the highest ranking in terms of academic reputation according to the QS World Ranking of Universities. As can be seen, top patenting correlates with top research, but not as strongly as one might expect.
Table 5.2 Top-ranking universities for patent applications, 1990–2009, and research
| University | Rank: patent applicationsa | Number of patent applicationsa | Rank: citations per facultyb | Rank: academic reputationc |
|---|---|---|---|---|
| KIT, Karlsruhe Institute of Technologyd | 1 | 3,780 | 5 | 12 |
| Technische Universität Dresden | 2 | 1,495 | 3 | 16 |
| Albert-Ludwigs-Universität Freiburg | 3 | 1,103 | 6 | 7 |
| Freie Universität Berlin | 4 | 1,038 | 9 | 4 |
| Eberhard Karls Universität Tübingen | 5 | 1,027 | 36 | 13 |
| Humboldt-Universität zu Berlin | 6 | 839 | 18 | 2 |
| Universität Stuttgart | 7 | 770 | 19 | 18 |
| Universität Jena | 8 | 769 | 33 | 28 |
| Friedrich-Alexander-Universität Erlangen-Nürnberg | 9 | 708 | 1 | 22 |
| Technical University of Munich | 10 | 635 | 24 | 5 |
| Ruprecht-Karls-Universität Heidelberg | 11 | 598 | 16 | 3 |
| Ludwig-Maximilians-Universität München | 12 | 536 | 10 | 1 |
| RWTH Aachen University | 13 | 515 | 13 | 6 |
| Georg-August-University Goettingen | 14 | 389 | 27 | 8 |
| Technische Universität Berlin (TU Berlin) | 15 | 381 | 22 | 9 |
| Leibniz Universität Hannover | n/a | n/a | 2 | 29 |
| Technische Universität Darmstadt | n/a | n/a | 4 | 23 |
| Julius-Maximilians-Universität Würzburg | n/a | n/a | 7 | 24 |
| University Ulm | n/a | n/a | 8 | 27 |
| Universität Rostock | n/a | n/a | 11 | 43 |
| WHU – Otto Beisheim School of Management | n/a | n/a | 12 | 45 |
| Ruhr-Universität Bochum | n/a | n/a | 14 | 25 |
| Justus-Liebig-University Giessen | n/a | n/a | 15 | 42 |
| Rheinische Friedrich-Wilhelms-Universität Bonn | n/a | n/a | 28 | 11 |
| Universität Hamburg | n/a | n/a | 35 | 10 |
| Universität Frankfurt am Main | n/a | n/a | 37 | 14 |
| University of Cologne | n/a | n/a | 38 | 15 |
Notes:
a. Source: Munich Innovation Group (2013).
b. Source: QS World University Ranking 2016/2017; www.topuniversities.com/university-rankings/world-university-rankings/2016. Ranks are within Germany and are based on a citation-to-paper ratio per faculty member in order to remove size effects. The publication and citation analysis is based on the Scopus database.
c. Source: QS World University Ranking 2016/2017; www.topuniversities.com/university-rankings/world-university-rankings/2016. Ranks are within Germany and are based on a survey of scientists.
d. The Karlsruhe Institute of Technology is a merger between the former University of Karlsruhe and the Forschungszentrum Karlsruhe, an institute of the Helmholtz Association.
Unfortunately, patent applications are almost the only indicator of KTT from universities and Fachhochschulen that can be traced systematically with moderate effort. Other indicators such as licensing, spinoff activity, joint research projects with industry, and other more informal contacts are not collected on any systematic basis. Such data could only be gleaned from the annual reports of individual institutions (and even then comprehensive data are not available) or collected through surveys.
Knowledge Transfer by Public Research Institutes
A decade after the analysis by Reference Rammer, Czarnitzki, Schmoch, Licht and ReinhardRammer and Czarnitzki (2000) and Reference Edler and SchmochEdler and Schmoch (2001), a survey of public research institutes conducted in 2009 by the Centre for European Economic Research (ZEW) offered an updated perspective. The heads of different public research institutes were asked whether various tasks featured in their institute’s main mission. Public research institutes are often associations of many different institutes, and so there was scope for considerable variation among replies from heads within a single umbrella public research institute. Interestingly, the heads’ subjective assessment in this survey generally chimes with the earlier findings reported in Figure 5.3.
Table 5.3 shows some key results of the 2009 survey. The most emphatic replies came from the Max Planck Association and the Fraunhofer Association. As expected, Max Planck views itself as provider of basic research insights: 100 percent of its heads view basic research as one of their main tasks. This is followed by providing PhD and other education (22 percent), which can be seen as an indirect channel of knowledge transfer (not necessarily to industry), and the provision of scientific information to the public (19 percent). Note the striking gap between basic research (100 percent) and the next most important task, PhD education (22 percent) – the most pronounced unimodal orientation among all public research institutes. Active knowledge transfer is not seen as one of the institute’s main tasks.
| Total | Max Planck | Fraunhofer | Helmholtz | Leibniz | PRO (Federal) | |
|---|---|---|---|---|---|---|
| Basic research | 44 | 100 | 9 | 46 | 62 | 7 |
| Applied research | 57 | 3 | 91 | 57 | 48 | 74 |
| Technical development | 18 | 3 | 46 | 26 | 6 | 7 |
| Testing, standardisation, and certification | 11 | 0 | 17 | 6 | 6 | 26 |
| Information and documentation | 11 | 3 | 3 | 3 | 23 | 22 |
| PhD education, Further education | 16 | 22 | 3 | 34 | 19 | 7 |
| Providing scientific infrastructure | 15 | 6 | 11 | 37 | 13 | 15 |
| Tech transfer to private sector | 26 | 3 | 57 | 31 | 12 | 7 |
| Scientific information of public | 15 | 19 | 0 | 14 | 23 | 15 |
| Counseling services public administration | 20 | 3 | 9 | 17 | 19 | 78 |
| Fulfillment of regulatory tasks | 13 | 3 | 3 | 9 | 10 | 56 |
This stands in stark contrast to the Fraunhofer Association, which has traditionally focused more on applied research. Here 91 percent of heads see applied research as a main task of their institute, followed by knowledge transfer to industry (57 percent) and technical development (46 percent).
The Fraunhofer and Max Planck Associations take extreme positions in terms of basic versus applied research and development and active knowledge transfer. Other public research institutes have more balanced missions. For instance, the heads of the Helmholtz institutes regard basic and applied research as almost equally important (57 percent versus 46 percent). Helmholtz represents Big Science in Germany, and its heads see the provision of scientific infrastructure (which can also be accessed by non-Helmholtz researchers) as their third most important task. Direct knowledge transfer to industry is ranked fifth after providing PhD education. In sum, although Helmholtz still places more importance on basic and applied research, knowledge and technology transfer is on the agenda of its constituent institutes.
Like Helmholtz, the Leibniz Association is a hybrid between basic and applied research that does not see knowledge transfer as its main goal. Information, documentation, and the dissemination of scientific information to the public feature among its perceived missions.
The 2009 survey also provides interesting information about other public research institutes. These institutes have a strong focus on applied research (mentioned by 74 percent of their heads) and on monitoring and advising public administration (78 percent). A good example is the Robert Koch Institute, Germany’s central institution for disease prevention and control, which operates under the Federal Ministry of Health and conducts research into vaccination and related fields. It has about 1,110 employees, including 450 scientists.
Another example is the German Meteorological Office (Deutscher Wetterdienst, DWD), which is attached to the Federal Ministry of Transport and Digital Infrastructure and whose principal tasks include warning against weather-related dangers and monitoring and rating the impact of climate change in Germany. The DWD runs atmospheric models on its supercomputer for precise weather forecasting as well as managing the national climate archive and one of the world’s largest specialized libraries on weather and climate issues. While it does undertake climate research, its main tasks relate to information and documentation.
For more information about knowledge transfer from public research institutes to industry specifically, annual reports are a useful source. The main transfer channel is undoubtedly direct research collaboration with industry, but data on this are not readily available. Instead, Table 5.4 reports key figures on KTT based on annual reports. As expected, the Fraunhofer Association is very active in patenting due to the applied nature of its research, and secured EUR 641 million revenue from projects with industry in 2015. The Helmholtz Association is also very active in patenting – perhaps more than one might expect given its focus on Big Science – but earns much less than Fraunhofer from industry partnerships. The various Max Planck institutes patented only 131 inventions between them in 2014, in line with their basic research focus.
Table 5.4 KTT by leading German public research institutes at a glance
| Patenting | Licensing | Spinoffs | Other | |
|---|---|---|---|---|
| Fraunhofer | 563 applications in 2014, 506 in 2013 | Not available | Not available | EUR 641 million revenue from projects with industry in 2015 |
| Max Planck | 131 applications in 2014, 127 in 2013 | 80 exploitation agreements in 2014 generating revenues of EUR 23.5 million; 93 agreements in 2013 and revenues of EUR 22.5 million | 117 spinoffs since 1990, 83 of them actively managed by Max-Planck Innovation; c.3,000 jobs created as of 2014 | c.2,000 collaborative projects with industry per year generating annual revenues of c.EUR 158 million in 2014 |
| Helmholtz | c.400 per year | Revenues of EUR 20 million in 2012 and 2013, and EUR 11.7 million in 2015 | 118 spinoffs between 2005 and 2014, 21 in 2015 | c.EUR 150 million per year revenue from industry partnerships |
| Leibniz | 2,605 between 1990 and 2009 | n/a | n/a | Third-party funding of c.EUR 363 million in 2014 (22.1 percent of all funding) |
According to the Munich Innovation Group (2013), the Leibniz Association patented 2,605 inventions between 1990 and 2009, giving a similar annual total to that of Max Planck. Third-party funding amounted to about EUR 363 million, but it is unclear how much of this came from industry.
For Max Planck and Helmholtz, licensing income and spinoff numbers are also available, but these are difficult to compare across institutions. Max Planck reports that it has created117 spinoff companies since 1990, which in turn created about 3,000 jobs as of 2014, but it is unclear whether those jobs still existed in 2014, or whether the figure refers to employment in terms of “person-years” since 1990. Helmholtz outperformed Max Planck by creating 118 spinoffs between 2005 and 2014, but reported only EUR 20 million of research revenues compared with Max Planck’s EUR 23.5 million. Furthermore, Helmholtz’s revenues trended downward during the period of the study.
In summary, German universities and Fachhochschulen are not the only relevant institutions for knowledge and technology transfer from science to industry; public research institutes without teaching obligations play a crucial role in the public science landscape. Knowledge transfer seems to be actively supported by most universities and public research institutes.
5.2.3 Leading Users of Commercially Valuable Knowledge
In the Mannheim Innovation Panel (MIP), which constitutes the German part of the pan-European Community Innovation Surveys (CIS), firms are regularly asked about their innovation activities. The survey takes a representative sample of German manufacturers and selected services and its results can thus be extrapolated to all German firms in these sectors.
Among many other questions, firms are asked to report on their partners in innovation projects. As well as lead customers, suppliers, firms from the same industry and consultants, they also indicate whether they collaborate with universities, including universities of applied sciences, and public research institutes.
As can be seen in Table 5.5, of firms in the R&D service sector, 66 percent collaborate with universities and 40 percent with other public research organizations. This is followed by the pharmaceutical sector, where 54 percent of firms report collaboration with universities and 30 percent with public research institutes. Other sectors that collaborate extensively with public science include ICT equipment, vehicles, machinery, chemicals, metal, and the ICT industry.
Table 5.5 Leading collaboration partners by sector, 2008–10
| Collaborations with: | ||||
|---|---|---|---|---|
| Universities and Fachhochschulen | Other public research organizations | |||
| Rank | Share of innovators* (in percent) | Rank | Share of innovators* (in percent) | |
| R&D services | 1 | 66 | 1 | 40 |
| Pharmaceuticals | 2 | 54 | 2 | 30 |
| ICT equipment | 3 | 47 | 3 | 29 |
| Vehicles | 4 | 43 | 4 | 26 |
| Machinery | 5 | 38 | 6 | 19 |
| Chemicals | 6 | 33 | 5 | 25 |
| Metal | 7 | 32 | 7 | 15 |
| ICT services | 8 | 32 | 8 | 14 |
* Share of innovating firms reporting collaboration within the context of innovation projects.
Interestingly, universities are generally reported more frequently than public research institutes. In part, this may simply be because they outnumber public research institutes, but it also shows that universities are frequently involved in knowledge transfer activities through joint research. These activities may well exceed the patenting of university inventions by the university KTOs themselves in terms of both frequency and importance.
For public research institutes, there is also survey data on the users of their research results. In the 2009 ZEW public research institutes and universities survey, heads of institutes were asked to report on their most important user groups. Interestingly, their most important user group was universities, mentioned by 52 percent of respondents, followed by other public research institutes on 37 percent. Small and medium-sized firms and large firms were each mentioned by around one-third of respondents (see Table 5.6).
Table 5.6 Main users of public research institute research, as identified by public research institute heads
| Total | Max Planck | Fraunhofer | Helmholtz | Leibniz | PROs (Fed.) | Others | |
|---|---|---|---|---|---|---|---|
| Universities | 52 | 84 | 11 | 54 | 77 | 33 | 40 |
| PRIs | 37 | 40 | 3 | 34 | 64 | 33 | 33 |
| Public administration | 27 | 0 | 9 | 23 | 31 | 96 | 19 |
| Large firms | 30 | 0 | 83 | 37 | 15 | 11 | 31 |
| SMEs | 33 | 0 | 91 | 17 | 19 | 7 | 54 |
| Industry associations | 7 | 0 | 14 | 3 | 4 | 7 | 10 |
| Broader public | 12 | 3 | 0 | 9 | 15 | 22 | 19 |
Notes: Figures show the percentage of respondent public research institute heads who reported a specific user group as using their institution’s research.
Once again, the biggest differences between public research institutes occur between Max Planck and Fraunhofer. While Max Planck heads almost exclusively report other scientific institutions as their main user group (universities and public research institutes with 84 percent and 40 percent, respectively), the Fraunhofer institutes focus unambiguously on industry, with large firms mentioned by 83 percent of heads and SMEs by 91 percent.
For the other institutions, the picture is again more mixed but public science as user dominates, except for other federal public research institutes that do not belong to one of the four major associations, where public administration is evidently the most important “client.”
5.2.4 Changes in the German Knowledge Transfer System
In the period 1998–9, the BMBF commissioned a study of knowledge and technology transfer in Germany, the results of which were published (Reference Schmoch, Licht and ReinhardSchmoch et al. 2000). In response to the study, the BMBF launched a campaign called “Knowledge Creates Markets” in 2001 with four major objectives: (i) a valorization campaign to increase patenting by public research organizations; (ii) a spinoff campaign to encourage them to found companies; (iii) a collaboration campaign to foster bilateral research agreements between public research organizations and companies; and (iv) a competence campaign to increase awareness of the potential usefulness of public science among companies. In total, the four campaigns included twenty-six sub-schemes.
Major subsequent changes with respect to KTT in Germany included the abolition of professor’s privilege and the establishment of regional “patent valorization agencies” (PVAs) intended to support university KTOs and researchers in commercializing their discoveries.
The Abolition of Professor’s Privilege
The abolition of professor’s privilege was a major change both legally and culturally. Under Clause 42 of the German employee invention law, university researchers owned inventions made in the course of their work. This was a unique legal privilege – ownership of all other inventions created in the course of employment are vested in the employer – and reflected Article 5 of the German constitution, which protects the freedom of science and research.
Under the new law, introduced in 2000, German university researchers are now required to scrutinize their research findings and report any inventions to the university – unless they decide to keep their inventions secret by not publishing or patenting. The university has four months to consider patenting any inventions so submitted. If it does not claim the invention, rights to patent and commercialize it revert to the researcher. If it does claim it, the inventor is entitled to at least 30 percent of revenues from successful commercialization, but nothing otherwise. Furthermore, the university handles the patenting process and pays all related expenses such as processing fees, translation costs, and legal expenses. University researchers retain the right to disclose the invention through publication two months after submitting it to the university. Prior contractual agreements with third parties also remained valid during a prescribed transition period.Footnote 5
A handful of studies have examined the effects of abolishing professor’s privilege on patenting rates and ownership patterns in Germany. Reference SchmochSchmoch (2007) found that the number of university-owned patents increased. Based on inventor lists, his data also suggest that the new law changed the propensity to invent among academics, discouraging those who had previously filed their own patents while encouraging non-patenters. In a follow-up study, Reference Cuntz, Dauchert, Meurer and PhilippsCuntz et al. (2012) showed that the share of university-owned inventions increased after 2002 while the share of individually or industry-owned university inventions decreased. Reference Von Proff, Buenstorf and HummelVon Proff et al. (2012) found that the policy change did not increase university-invented patents, but that ownership merely shifted from individual- and firm-owned patents to universities.
Reference Czarnitzki, Doherr, Hussinger, Schliessler and TooleCzarnitzki et al. (2015c) analyzed the effects of the change in law through a more rigorous micro-econometric study using the difference-in-difference methodology, comparing university-based patenting to the patenting activity of a control group of inventors before and after the change.
In essence, Reference Czarnitzki, Doherr, Hussinger, Schliessler and TooleCzarnitzki et al. (2015c) argue that university patenting cannot be compared to general patenting activity in Germany, which is dominated by inventors employed in firms. As the reward systems in firms and public science are very different, they instead aim to compare patenting by university researchers with patenting by researchers employed by public research institutes.
Choosing a good control group of inventors is clearly crucial to evaluate the impact of policy changes. Figure 5.4 shows patenting activity in Germany, with the dotted line at the top showing the overall trend.

Figure 5.4 Patenting in Germany before and after the abolition of professor’s privilege
The underlying data are applications filed with the German Patent and Trademark Office (DPMA) and the European Patent Office (EPO) between 1978 and 2008 involving at least one German inventor. Data were collected from PATSTAT. Treating 1995 as the baseline (100 percent), patenting grew until the year 2000 and reached about 145 percent, then fell to about 140 percent in 2002, and then grew again to reach 160 percent in 2008. However, academic patenting developed very differently. Patent filings based on university and public research institute inventions both grew from 100 percent in 1995 to roughly 110 percent in 1998, but then both fell, to 70 percent and 80 percent respectively, in 2002 when the law changed. This pattern was found by prior researchers (Reference SchmochSchmoch 2007; Reference Cuntz, Dauchert, Meurer and PhilippsCuntz et al. 2012; Reference Von Proff, Buenstorf and HummelVon Proff et al. 2012). Analysts have speculated about the reasons for the decrease: suggestions include an increasing emphasis on publication in academic performance evaluations, decreased entry into academic jobs, the end of the New Economy boom and legal uncertainty surrounding patenting in the field of biotechnology (Reference SchmochSchmoch 2007: 5–8; Reference Cuntz, Dauchert, Meurer and PhilippsCuntz et al. 2012: 21–2).
Patenting by public research institutes did at first recover slightly after the change in law, but university patenting continued to decline.
For more rigorous analysis, Reference Czarnitzki, Doherr, Hussinger, Schliessler and TooleCzarnitzki et al. (2015c) collected a panel of patent and publication data at the level of individual inventors at universities and public research institutes. The panel methodology allows one to control for individuals’ ability to commercialize research, annual macroeconomic shocks, and each researcher’s career age and publication record. Publications may serve as a control variable, reflecting potentially patentable new knowledge.
Figure 5.5 shows trends for the study group (university researchers) and the control group (public research institute researchers) as “within” demeaned average time series, that is, average patenting activity for each person over the whole panel time period is subtracted from their actual observed patenting. This wipes out differences in levels of the time series which might be due to individuals’ specific ability to patent. Here, we are more interested in changes over time rather than different levels of patenting activity among individuals. The figure shows that patenting by researchers at universities and public research institutes followed a similar trend before the law changed and diverged slightly between 1998 and 2001, when abolition of professor’s privilege was under discussion, but that they diverged strongly after abolition. While public research institute patenting first stabilized in 2005, university patenting dropped steadily until 2008.

Figure 5.5 Trends in German patenting for university and public research institute researchers (“within” transformed), 1995–2008
Having run micro-econometric fixed-effect panel regressions that also control for researchers’ career ages and publication records, Reference Czarnitzki, Doherr, Hussinger, Schliessler and TooleCzarnitzki et al. (2015c) conclude that the law change caused patenting by university researchers to fall by about 17 percent. Thus, the policy failed in its goal of increasing patenting. The authors argue that policymakers misperceived the incentives of university researchers. It was assumed that university researchers were mainly interested in publishing their work in academic journals and most were not interested in commercializing their research results. Instead, however, researchers who were interested in commercialization before the law changed maintained viable networks of industry contacts and often patented in collaboration with companies. These networks were disrupted by the law change, and university researchers instead had to involve university KTOs in negotiations about contract research, IP, and related collaborations.
Reference Czarnitzki, Doherr, Hussinger, Schliessler and TooleCzarnitzki et al. (2015c) argue that the cost-and-benefit schedules for university inventors have shifted because of the change in IP ownership. On the one hand, KTOs now cover the cost of patent applications and associated fees, and are also supposed to look for industry partners for commercialization. Prior to the law change, researchers had to invest effort and their own money to realize commercial opportunities. On the other hand, researchers have lost the opportunity to appropriate all revenues from their patenting activity. Prior to the law change, they could theoretically enjoy 100 percent of potential revenues; now, they obtain a 30 percent royalty on all revenues, and the universities own the other 70 percent. In addition, bargaining has become more complex as now, in addition to the researchers, the university’s KTO is involved in negotiations with the firm. The empirical results of Reference Czarnitzki, Doherr, Hussinger, Schliessler and TooleCzarnitzki et al. (2015c) suggest that the negative incentives (forgone private benefits of commercialization) outweigh the positive incentives (lower private cost of commercialization).
Reference Czarnitzki, Doherr, Hussinger, Schliessler and TooleCzarnitzki et al. (2016) separates patenting by university researchers by applicant type (see Table 5.7). Before 2002, total patenting per university inventor per year amounted to about 0.58 patent applications per year. After the law changed, this total dropped to 0.34. However, the decline causally related to the law change is about 17 percent of the initial value of 0.58 only (according to the results from Reference Czarnitzki, Doherr, Hussinger, Schliessler and TooleCzarnitzki et al. 2015c). More interestingly, Table 5.7 shows that a large chunk of the decline in patenting is due to a fall in patents where university researchers appear as inventors on corporate patent applications. These patents related to industry have declined by around 50 percent, from 0.45 before the law change to 0.23.
Table 5.7 University researchers’ patent activity by applicant type, 1995–2008
| Applicant type | Before 2002 | After 2002 | ||
|---|---|---|---|---|
| Average patents per inventor per year | Relative frequency (in percent) | Average patents per inventor per year | Relative frequency (in percent) | |
| Industry | 0.45 | 74 | 0.23 | 62 |
| Individual | 0.14 | 23 | 0.04 | 11 |
| University | 0.02 | 3 | 0.10 | 27 |
| Sum | 0.61 | 100 | 0.37 | 100 |
| Total* | 0.58 | 0.34 | ||
* Note: In total, the average number of patent applications per identified university inventor per year amounted to 0.58. However, a few patents are co-assigned to multiple types, e.g., a firm and a university file a joint patent application. These are counted for each type, so the total by type amount to 0.61 before 2002 instead of 0.58.
In addition, patents may be filed by individuals, typically university inventors themselves, or by the university. Before 2002, an average of 0.14 patents were filed individually by each university inventor, and 0.02 by each university. As can be seen in Table 5.7, these numbers basically switched around, in line with the change in the law on IP ownership. After 2002, patents filed by individuals fell to 0.04 while university-filed patents increased from close to zero to 0.10, amounting to 27 percent of total patent applications based on university inventions. Applications by individual researchers amount to just 11 percent. These are inventions where the KTO was not interested in claiming ownership or the university researcher did not report the invention to the university. Patent applications with industry are still the largest share with 62 percent. Note that universities are not required to claim ownership of the IP. They may well contract to transfer ownership to firms. The key change is that prior to 2002, the researcher was able to negotiate directly with industry, while now it is the university KTO that does so.
Patents filed along with industry applicants dropped dramatically from 0.45 to 0.23 per inventor per year. These most likely stem from direct research collaborations or contract research between industry and university researchers, strongly suggesting that the abolition of professor’s privilege reduced actual knowledge and technology transfer. The loss of private income opportunities seems to have outweighed the possible benefits in terms of the reduced cost of commercialization for researchers.
The Introduction of Patent Valorization Agencies
As part of the Knowledge Creates Markets campaign, the BMBF established patent valorization agencies (PVAs). By 2012, twenty-nine PVAs had been created, with at least one in each state (Reference Cuntz, Dauchert, Meurer and PhilippsCuntz et al. 2012). Their primary mission is to help universities commercialize their research by providing advice on patenting, licensing and forming spinoffs. They also help to find business partners and licensees.
The main public funding for the PVAs is provided through the SIGNO program of the Federal German Ministry of Economics (BMWi). Funding is assigned to universities, which then use it to request services from the PVAs. The SIGNO budget amounted to EUR 29 million between 2001 and 2003, EUR 38 million between 2004 and 2007, and EUR 29 million between 2008 and 2010. Universities must top this up through co-payments. Reference Cuntz, Dauchert, Meurer and PhilippsCuntz et al. (2012) calculated that the PVAs’ annual budgets totaled between EUR 9 and EUR 10 million in the period 2002–9.
Reference Cuntz, Dauchert, Meurer and PhilippsCuntz et al. (2012) also calculated that the revenues generated by the PVAs did not cover their cost: between 2002 and 2009, they never exceeded EUR 6 million.
It may be, however, that although the PVAs operate at a loss, their KTT activities bring indirect benefits. For instance, the foundation of more spinoff companies would not necessarily be reflected in higher PVA revenues. Researchers may be more likely to found their own companies, possibly in collaboration with a university KTO, after the establishment of PVAs and the abolition of professor’s privilege, as KTOs may now be more actively pushing commercialization through spinoffs and this process may be strengthened by the presence of the PVAs. To test this hypothesis, Reference Czarnitzki, Doherr, Hussinger, Schliessler and TooleCzarnitzki et al. (2016) investigated whether more or fewer spinoff companies have been founded since the abolition of professor’s privilege and the establishment of PVAs. They collected data by searching for identified academic inventors among the population of firm founders in Germany. The Creditreform database (the German part of Bureau van Dijk’s Orbis database) includes the names of all firm founders along with information on the foundation year, shareholdings, basic firm-level accounting, and supplemental data. Importantly, this captures not only spinoffs established by university or public research institute KTOs, but also those launched by researchers independently.
Table 5.8 summarizes their findings. Before 2002, university researchers were involved in about 46 startups per year and this number reduced to about 43 per year. The annual probability of a researcher founding a company remained constant at 4 percent. For public research institute researchers, the number of companies founded was lower and constant over time, with 29 spinoffs per year – 1 percent per researcher per year.
Table 5.8 Academic entrepreneurship before and after the 2002 policy reform (annual mean values), 1995–2008
| Startups founded per year | Startups founded per year per inventor | ||
|---|---|---|---|
| University researcher | Before 2002 | 46.43 | 0.04 |
| After 2002 | 42.57 | 0.04 | |
| PRI researcher | Before 2002 | 29.43 | 0.01 |
| After 2002 | 28.71 | 0.01 |
Note: The sample included 1,946 patenting university researchers and 4,551 public research institute researchers.
Annual within-demeaned spinoff probabilities at the researcher level are shown in Figure 5.6. As can be seen, while average annual spinoff probabilities fluctuate, they remain broadly constant over time and are unaffected by the law change. This is in line with micro-econometric findings by Reference Czarnitzki, Doherr, Hussinger, Schliessler and TooleCzarnitzki et al. (2016). Using panel fixed-effects estimators in a difference-in-difference setup, they found no direct effect of the law change on university spinoffs. In summary, it seems that university KTOs and PVAs have not successfully pushed spinoff creation as the prime channel for commercializing academic inventions.

Figure 5.6 Average trends of spinoff activity (within demeaned)
Other Major Funding Schemes
A major program involving KTT goals was the German University Excellence Initiative (www.dfg.de/en/research_funding/programmes/excellence_initiative/index.html). This was intended to promote science and humanities to enhance Germany’s international competitiveness and increase the visibility of top-level universities. It ran from 2005 to 2017 and comprised three funding lines:
the establishment of graduate schools at universities to promote young researchers;
funding “clusters of excellence” to promote top-level research; and
institutional strategies to strengthen the institution “university” and its research setting as a whole.
In total, EUR 4.6 billion of funding was approved through the three funding lines, EUR 1.9 billion in the program’s first phase (2006–12) and EUR 2.7 billion in its second phase (2012–17). While the program was not directly targeted at knowledge transfer, it helped universities strengthen their staffing and equipment, and some of these additional resources may have been used for business-relevant research and knowledge transfer.
Another relevant policy is the Spitzencluster (“top cluster”) initiative (www.spitzencluster.de), in which universities, public research institutes, and firms team up to boost their research and innovation activities. Fifteen clusters were selected in three different program rounds, and each could obtain funding up to EUR 40 million over a five-year period.
A very recent program launched in 2016 and directly targeted at KTT is the Innovative Hochschule scheme (www.bmbf.de/de/innovative-hochschule-2866.html), which targets Fachhochschulen and small and medium-sized firms and has a budget of up to EUR 550 million to be disbursed in two five-year rounds until 2027. The main applicants are universities but firms can also be supported within project consortia. The goal is to strengthen universities’ KTT activities, increase links within regional economies, and promote innovative forms of collaboration with business.
The EXIST program (www.exist.de) has supported academic entrepreneurship since 1998. It has three main pillars: (i) the “founder’s fellowship” supports potential firm founders in academia to develop their business idea and create a business plan; (ii) the “research transfer” is intended to help develop applied research projects with commercial potential; and (iii) the “foundation culture” aims to help universities strengthen their infrastructure and enhance researchers’ awareness of KTT.
5.3 Common Knowledge Transfer Channels
To identify important channels of knowledge transfer in Germany and see how they have changed over time, we can use two surveys by ZEW.
The first survey was carried out in the year 2000 and included 856 responses from university professors and public research institute department heads (Reference Czarnitzki, Rammer and SpielkampCzarnitzki et al. 2000).
Among many other questions, respondents evaluated the importance of different knowledge transfer channels on a four-item Likert scale (0 = no importance, 3 = high importance). Table 5.9 shows the average values per type of institution, including general universities, technical universities, and universities of applied sciences. In the period 1997–9, general universities regarded publication in academic journals as the main knowledge transfer channel. Technical universities rated joint research projects with firms as important as publication and also emphasized the importance of contract research, collaborations on master’s and PhD theses, and contacts from researchers’ former occupation in the corporate sector. For universities of applied sciences, thesis collaboration was the most important channel, followed by former work contacts, and joint research projects, all of which ranked above academic publication.
Table 5.9 Importance of main knowledge transfer channels, by universities and public research institutes, 1997–9
| UNI | TU | UAS | MPG | HGF | FhG | WGL | |
|---|---|---|---|---|---|---|---|
| Publication in academic journals | 2.2 | 2.1 | 1.3 | 2.8 | 2.2 | 2.0 | 2.4 |
| (–0.0) | (+0.1) | (+0.2) | (+0.1) | (+0.0) | (+0.1) | (+0.1) | |
| Joint research projects with firms | 1.6 | 2.1 | 1.7 | 1.6 | 1.7 | 2.9 | 2.2 |
| (+0.3) | (+0.2) | (+0.4) | (+0.4) | (+0.5) | (+0.1) | (+0.1) | |
| Presentations to firms or related organizations | 1.4 | 1.6 | 1.5 | 1.5 | 1.5 | 2.6 | 1.7 |
| (+0.2) | (+0.1) | (+0.3) | (+0.2) | (+0.3) | (+0.1) | (+0.3) | |
| Publication of research results in the press | 1.2 | 1.4 | 1.2 | 2.0 | 1.6 | 2.2 | 1.7 |
| (newspapers, magazines) | (+0.1) | (+0.2) | (+0.2) | (+0.1) | (+0.1) | (+0.2) | (+0.2) |
| Contract research for firms | 1.2 | 1.8 | 1.4 | 0.3 | 1.2 | 2.9 | 1.3 |
| (+0.3) | (+0.2) | (+0.5) | (+0.2) | (+0.5) | (0.0) | (+0.3) | |
| Master’s and PhD theses in collaboration with | 1.3 | 1.8 | 2.5 | 0.9 | 0.9 | 1.6 | 1.0 |
| firms | (+0.3) | (+0.2) | (+0.0) | (+0.2) | (+0.4) | (+0.2) | (+0.3) |
| Personnel mobility of researchers between research organizations and firms | 1.4 | 1.6 | 0.9 | 1.6 | 1.3 | 2.0 | 1.2 |
| (+0.4) | (+0.4) | (+0.4) | (+0.3) | (+0.4) | (+0.2) | (+0.5) | |
| Contacts from academics’ former occupation | 1.0 | 1.7 | 2.1 | 1.2 | 1.0 | 2.0 | 0.9 |
| in the corporate sector | (+0.1) | (+0.0) | (+0.0) | (0.0) | (+0.1) | (+0.2) | (+0.3) |
| Joint publications and patent applications | 0.8 | 1.0 | 0.8 | 1.1 | 1.0 | 1.9 | 1.3 |
| with firms | (+0.4) | (+0.2) | (+0.4) | (+0.5) | (+0.5) | (+0.2) | (+0.3) |
| Seminars and lectures for firms | 0.7 | 0.9 | 1.3 | 0.7 | 0.7 | 1.4 | 0.7 |
| (+0.4) | (+0.4) | (+0.5) | (+0.1) | (+0.3) | (+0.4) | (+0.3) | |
| Firm formation by academic employees | 0.6 | 0.8 | 0.6 | 0.9 | 0.7 | 1.0 | 0.8 |
| (+0.5) | (+0.5) | (+0.5) | (+0.6) | (+0.6) | (+1.0) | (+0.6) | |
Notes: The numbers are averages of the four response scores (0 = no importance, 1 = minor importance, 2 = moderate importance, 3 = high importance) for the importance of the different channels in the years 1997–9. The expected change in importance of each channel in the future is given in the parentheses (calculated as positive or negative deviation from the mean of its current importance).
Types of institutions: UNI = general universities, TU = technical universities, UAS = universities of applied sciences (Fachhochschule), MPG = Max Planck Association, HGF = Helmholtz Association, FhG = Fraunhofer Association, WGL = Leibniz Association (Wissenschaftsgemeinschaft Gottfried Wilhelm Leibniz).
Surprisingly, staff mobility was not rated as a major transfer channel for any type of university, but it was expected to gain importance in the future. All types of university also expected firm formation by academic researchers to become more important along with other KTT measures such as seminars and lectures for firms.
Overall, university respondents expected almost all KTT channels to become more important, indicating the growing importance of KTT generally as the third mission of the university system.
Responses from public research institutes reflected each institution’s mission. Generally, respondents from the Fraunhofer institutes focused on direct knowledge transfer channels such as joint research projects, contract research, and presentations to firms. Respondents from Max Planck and Helmholtz tended to emphasize basic research and academic publication. For the Leibniz institutes, the results were more mixed but generally closer to Fraunhofer than to the other public research institutes.
In 2008, the ZEW conducted another survey among around 1,500 researchers (Reference Grimpe, Cremers, Eckert, Doherr, Licht and SellenthinGrimpe et al. 2009). Although the questions in that survey are not fully comparable to the ones in Reference Czarnitzki, Rammer and SpielkampCzarnitzki et al. (2000), some insights can be gained.
First, most academic researchers reported having used some external funding (see Table 5.10). At universities and Fraunhofer research units, 88 percent of respondents said they had sourced external funding, but whereas 80 percent of the Fraunhofer researchers said they had received funding from industry, only 37 percent of university researchers obtained industry funds. Max Planck, Helmholtz, and Leibniz researchers received third-party funding less frequently than those at universities and Fraunhofer, but the rates of receipt were still high: 81 percent of researchers at Leibniz, 79 percent at Helmholtz, and 73 percent of Max Plank researchers said they had benefited from external funds. However, only 26 percent of researchers at Leibniz, 24 percent at Helmholtz, and 15 percent at Max Planck reported having received funding from industry.
Table 5.10 External funding and channels of commercialization as reported by researchers in 2008
| Uni | Fraunhofer | Max Planck | Helmholtz | Leibniz | |
|---|---|---|---|---|---|
| External funding: | |||||
| Third-party funding | 88 | 88 | 73 | 79 | 81 |
| Industry funding | 37 | 80 | 15 | 24 | 26 |
| Channels of knowledge transfer: | |||||
| Joint commercialization of technology | 43 | 87 | 21 | 39 | 44 |
| Joint publications | 24 | 43 | 15 | 14 | 20 |
| Consulting | 20 | 26 | 11 | 8 | 8 |
| Company formation | 20 | 18 | 12 | 10 | 9 |
| Companies based on research results | 12 | 16 | 8 | 7 | 6 |
As regards knowledge transfer channels, 87 percent of Fraunhofer researchers said they had been involved in joint research and joint commercialization of technology with industry – far higher than the corresponding numbers of researchers at Leibniz (44 percent), universities (43 percent), Helmholtz (39 percent), and Max Planck (21 percent). Joint publications were generally the second most important channel. Private consulting activities and company formation were mentioned much less frequently. Interestingly, university researchers were more likely than other respondents to have been involved in founding an enterprise (20 percent), followed by those from Fraunhofer (18 percent). It is noteworthy, however, that in 40 percent of cases, university researchers’ startups were not based on research results: while 20 percent reported involvement in establishing a firm, only 12 percent said it was based on research results. At Fraunhofer, 16 percent of respondents reported being involved in a startup based on research results. As expected, firm formation was less frequent among researchers at the other respondent public research institutes.
To investigate KTT channels at the firm level, we can use the Mannheim Innovation Panel Survey from 2003. Companies were asked to evaluate their contacts with research institutions according to their importance. Around 2,500 firms reported active contacts with public science between 2000 and 2002. The respondents were asked to rank every KTT channel according to its importance for the firm’s access to knowhow on a scale between 0 and 3 (no to high importance).
Interestingly, informal contacts were the most important. More than 70 percent of firms with any active contact with science rated these as either highly or moderately important. This was followed by collaborations on master’s and PhD theses, which almost 50 percent of firms ranked as highly or moderately important. Advisory services from academic institutions were highly or moderately important to 43 percent. Other formal channels such as joint research, contract research, training of employees in academic institutions, and temporary exchange of personnel as well as technology licensing played a less important role for most firms.

Figure 5.7 The firms’ perspective on KTT channels
5.4 Economic Literature on Knowledge Transfer in Germany
The picture of KTT in Germany given above can be supplemented through a discussion of the scholarly literature. Here, we are particularly interested in two issues: the limits to and opportunity costs of KTT from science to industry, and its benefits downstream in the manufacturing and service sectors.
5.4.1 Limits to and Opportunity Cost of KTT
Reference Czarnitzki, Glänzel and HussingerCzarnitzki et al. (2007, Reference Czarnitzki, Glänzel and Hussinger2009a) studied the growing importance of universities’ unpublished technology-relevant research and cooperation with industry. As more and more scientific researchers became active in commercializing their discoveries, policymakers and academics debated whether patenting as a channel of entrepreneurial activity might significantly reduce scientific output in the economy, with potentially detrimental implications for long-term growth, competitiveness, and employment. Productivity in science can be measured in terms of the publication output and research quality of scientists engaging in commercialization. Czarnitzki et al. combined bibliometric and technometric indicators and econometric techniques to investigate the correlation between patenting and publication output and quality for a large data set of academics active in several research fields in Germany. Their 2007 study found no overall negative correlation between patenting and the scientific output of the academics in their sample, but more detailed analysis revealed heterogeneity in patenting behavior. Whereas some patent applications might result from purely intrinsically motivated research, others were the output of specially funded contract research, especially for industry. Reference Czarnitzki, Glänzel and HussingerCzarnitzki et al. (2009a) classified academics’ patent applications into corporate patents and academic patents using applicant data, distinguishing between patents where one or more academics featured as an inventor but the patent was filed by a company and those filed by another applicant (e.g., the academic themselves or a university or public research institute). Factoring this distinction into their multiple regression models, they found that academic-filed patents did not harm academics’ scientific output, but company-owned patents were associated with (subsequent) lower publication output and also lower publication quality (as measured through subsequent citations by other academic papers). Czarnitzki et al. interpreted this as evidence that the researchers were likely to have engaged in company-relevant research for commercialization/knowledge transfer purposes and that such research could distract them from their own, original academic research.
If one accepts that company-relevant research is likely to be of a more applied nature than normal university research then intensified knowledge transfer efforts by universities may indeed partly crowd out the freely accessible knowledge produced in science in terms of (high-quality) academic publications, potentially harming technological progress and economic development in the long run.
The opportunity cost of knowledge transfer has also been documented. In general, academic patents are more basic than corporate patents, and patents by academic inventors filed along with corporations feature inventions that are based on more applied research than those academic-invention patents owned by universities, public research institutes, or academics personally (Reference Czarnitzki, Hussinger and SchneiderCzarnitzki et al. 2009b, Reference Czarnitzki, Hussinger and Schneider2012). Reference Czarnitzki, Hussinger and SchneiderCzarnitzki et al. (2011) revealed a steady decline in the quality of academic patents. They investigated forward citations received by patent applications – a measure often employed as capturing the social value of an invention, as forward citations approximate how many subsequent inventions build on the patented technology. Czarnitzki et al. compared the forward citations received for patents by German university academics with a randomly chosen control group of patents filed by corporations in the same application year and technology field. They found that in the early 1980s, the average academic patent received significantly more forward citations than the control group of corporate patents, and they took this to indicate that academic patents were more fundamental and basic, and therefore more relevant to subsequent technological progress, than corporate patents. But as efforts to foster KTT from universities to industry grew in subsequent decades, differences between the quality or social value of academic and corporate patents, as measured by forward citations, diminished. By the beginning of the 2000s, there was no longer any statistically significant difference between forward citations of academic and corporate patents. This suggests that the move toward commercialization in academia has had a negative impact on the average social value of academic activities such as patenting. The boundary between not-for-profit academic and for-profit business R&D has become blurred.
Further studies have examined the impact of private industry funding of scientific activities on the publication of academic research results and the sharing of research materials. Reference Czarnitzki, Grimpe and PellensCzarnitzki et al. (2015a) showed that increased industry funding in Germany had hindered the dissemination of research in public science through disclosure restrictions. Arguing that the viability of modern open science norms and practices depends on public disclosure of new knowledge, methods, and materials, they sought to examine the relationship between industry sponsorship and restrictions on disclosure using individual-level data on German academic researchers. Their evidence, which controls for self-selection into extramural sponsorship, strongly supports the proposition that industry sponsorship jeopardizes the public disclosure of academic research. Academic scientists who adopt industry sponsorship are subject to more stringent contract terms that restrict the disclosure of academic research results through delay and secrecy. Controlling for scientist selection, the results show that the likelihood of such restrictions more than doubles with industry sponsorship, because firms expect proprietary benefits from their sponsorship relationships and realizing these benefits often requires disclosure restrictions that academic researchers would not otherwise impose.
These results are in line with those of Reference Czarnitzki, Grimpe and TooleCzarnitzki et al. (2015b) on access and sharing of research inputs among public scientists. The authors found that scientists who received industry funding were twice as likely to deny requests for research inputs as those who did not. Receiving external funding in general did not affect denying others access, but scientists who received external funding of any kind – from industry or elsewhere – were 50 percent more likely to be denied access to research materials by others.
In summary, active knowledge transfer does not come without opportunity cost. There is mounting evidence that the research output of public scientists is affected by their engagement in active knowledge transfer. Some may move toward more applied research, with potentially negative long-run impacts on the basic science that underpins future progress. In other cases, the dissemination of new academic knowledge may be directly impeded through disclosure restrictions imposed by private industry partners or sponsors.
5.4.2 Benefits to Business of Knowledge Transfer
While knowledge transfer can clearly have some negative impacts on the academic side, there are obvious potential benefits too. First and foremost, knowledge transfer may include private research sponsorship that enhances academic research capacities, allowing more doctoral students to be educated and so on. And even in the absence of major budget increases for public science, KTT may bring societal benefits.
The most extreme form of academic commercialization is academics’ involvement in spinoff companies. In such cases, academic research is deemed valuable enough to warrant forming a company, transferring technology to the private sector and potentially adding social value by creating jobs and generating taxable revenues. Reference Czarnitzki, Rammer and TooleCzarnitzki et al. (2014) investigated how far German academic startups grew in their first few years. They collected representative sample data from German firm foundation cohorts between 1996 and 2000 in knowledge-intensive and high-tech sectors. More than 57,000 new ventures were contacted by means of computer-aided telephone interviews, and about 20,000 interviews conducted. In their empirical analysis, Czarnitzki et al. estimated a model of company growth. They identified academic entrepreneurs among the sample of newly founded firms, and controlled for “firm survivor bias” by applying a sample selection model.Footnote 6 They found that academic spinoffs grew by around 3 percent more per year on average than other startups.
In a companion paper based on similar data, Reference Toole, Czarnitzki and RammerToole et al. (2015) examined how university research alliances and other cooperative links with universities contribute to startup employment growth. They argued that “scientific absorptive capacity” at the startup is critical to reap the benefits from university research alliances, but not necessarily for other university connections. They estimated the aggregate employment contribution of startup firms and attributed those employment gains to university research alliances and other university connections. They found significant contributions to employment growth from university research alliances and other university connections, but also found that scientific absorptive capacity was critical for university research alliances. Only 7 percent of startups maintained a university research alliance, but 3.4 percent of all jobs created by those firms were attributable to their alliances.
These numbers obtained from econometric regression analysis can be extrapolated to the population. For the period from 1996 to 2001, German National Account statistics show that total employment in the knowledge-intensive sectors increased by 701,000 jobs. Based on the results of Reference Toole, Czarnitzki and RammerToole et al. (2015), 453,422 of these jobs were created by 171,833 companies founded between 1996 and 2000 that survived until the end of 2001. This is about 65 percent of total net jobs in the sectors covered. Among all the startups in this cohort, it can be estimated that 51,908 companies had some kind of university connection(s) in the post-foundation period and created 223,969 jobs. Using the Heckman regression model results, Toole et al. estimate that university connections (research alliances and all others) accounted for 9.2 percent (or 20,535) of these jobs. Turning to university research alliance relationships, they calculate that a total of 11,896 startups within the population had such relationships and created a total of 72,857 jobs. The model results indicate that 3.4 percent (or 2,453) jobs can be attributed to university research alliances.
These results suggest that university connections are quite important for job growth, and university research alliances contributed substantially to job creation for those firms that had such alliances.
When it comes to innovation by established firms, studies have considered spillovers from public science in general and also benefits to companies from direct interaction with public science in the form of research collaborations.
Reference Cappelli, Czarnitzki and KraftCappelli et al. (2014) focused on “essential knowledge spillovers” that companies received from public science. While some such spillovers may be obtained from simply reading academic publications, they may also result from direct interaction through contract research or joint research collaborations. In one wave of the Mannheim Innovation Panel, firms were asked about “essential inputs for innovation” that they had received from other actors in the economy including customers, suppliers, competitors, and public science. The term “essential” was defined in the survey to mean that an input had been indispensable for the development of a new product, service or process.
Cappelli et al. related firms’ sales of market novelties to these reported spillover measures and found that essential information received from customers and public science was associated with higher sales of new products. On average, innovative firms in their sample achieved 9 percent of their sales from products that were novel in their main product market. Regression results showed that spillovers from public science pushed this share to about 13.2 percent.
In a very recent study, Reference Comin, Licht, Pellens and SchubertComin et al. (2018) analyze the case of the Fraunhofer Association, the largest applied research public research institute in Germany. They investigate whether interacting with Fraunhofer institutes in research projects affects firms’ performance and strategic orientation. To do this, they assembled a data set based on Fraunhofer’s (confidential) internal project management system and merged it with the Mannheim Innovation Panel. They found that project interaction had a strong positive effect on firms’ turnover and productivity growth. They also showed that a major driver of these positive effects is the firms’ increased share of sales from new products and an increase in the share of their workers with tertiary education. More detailed analyses reveal, among other things, that performance effects become stronger the more often firms interact with Fraunhofer and that interactions aimed at generating technology have a stronger effect than those merely intended to implement existing technologies.
In summary, the literature has shown quite clearly that (active) knowledge transfer from public science to industry has positive effects on the business sector in Germany. The documented effects range from job creation to new product sales and productivity growth. These positive effects have been found in both startup companies (including academic startups) and established companies.
5.5 Supporting Interviews
To explore KTT in German universities in more depth, three supporting case studies including interviews were conducted for the research project on which this chapter draws – at the University of Heidelberg, Friedrich-Schiller-University (FSU) Jena, and Ludwig-Maximilian University (LMU) Munich. Table 5.11 shows some key characteristics of these institutions.
Table 5.11 Key characteristics of the three case study universities
| Heidelberg | Jena | Munich | |
|---|---|---|---|
| Number of academics | 444 | 384 | 747 |
| Number of students | 30,300 (including 1,300 PhDs completed per year) | 19,000 | 48,000 |
| Fields of study | Humanities, social sciences, law, economics, mathematics, physics, biotechnology and other natural sciences; two faculties of medicine and two hospitals; computer science | Humanities, social sciences, law, economics, mathematics, biology and other natural sciences, medicine | Humanities, social sciences, law, economics, mathematics, physics, biology, biotechnology and other natural sciences, medicine, computer science |
The University of Heidelberg is located in the state of Baden-Württemberg in an area characterized by a strong science base, close to many other leading scientific organizations such as:
the German Cancer Research Institute – a research institute of the Helmholtz Society with more than 3,000 employees;
the National Center for Tumor Diseases Heidelberg – a joint venture between the German Cancer Research Institute and the University of Heidelberg;
the European Molecular Biology Laboratory (EMBL) – one of the world’s leading research institutions and Europe’s flagship laboratory for the life sciences. This is an intergovernmental organization specializing in basic research in the life sciences, funded by public research monies from more than twenty member states, including much of Europe plus Israel and two associate members, Argentina and Australia;
a biotechnology science park and a growing number of local biotech startups;
the BioMed X Innovation Center, a collaboration model at the interface between academia and industry where interdisciplinary project teams conduct biomedical research in an open-innovation lab facility on the campus of the University of Heidelberg. Each team is typically sponsored by a corporate pharmaceutical or biotech partner. At the end of a fully funded project term, successful projects are either internalized into the development pipeline of the respective pharmaceutical or biotech sponsor or spun off into an independent startup company.
Furthermore, several large companies are also located near Heidelberg, including BASF, SAP, Roche, AbbVie, Böhringer-Ingelheim, and Merck Serono.
FSU Jena is also located in a region with a strong science base, particularly in physics and optics. The Helmholtz institute at Jena hosts a particle accelerator, while the main optics company is Jenoptik.
LMU Munich is located near the Technical University of Munich and the Helmholtz Centre for Research on Environmental Health. Munich also hosts the headquarters of the Max Planck Association and the Fraunhofer Association plus a number of large companies such as BMW.
The three universities’ KTOs share more or less the same tasks and services, such as:
information and support for researchers regarding funding opportunities;
handling research contracts with other research organizations, research funding organizations and the private sector;
implementation of the university’s intellectual property policy and the management of IP rights;
management of research-based spinoff processes;
identification of transferable IP; and
support for research conferences and research marketing.
Interviewees said they had benefited from major public funding programs such as the Excellence Initiative and the Spitzencluster program. As a result, their KTOs gained staff, at least temporarily, helping them achieve their goals.
Furthermore, some new forms of university–industry collaboration had been implemented, for example new types of startup such as InnovationLab and the CarLa Catalytics Research Lab – laboratories either run by industry with scientific support from universities or set up as joint ventures between a firm and a university, and ideally located within a technology park on campus. Also, more hybrid labs could be established whereby industrial researchers collaborate with university researchers and the latter are partly financed by industrial partners.
While the interviewees were happy to report success stories, it became apparent that a “cultural divide” between university and industry applies to the vast majority of both university and industrial researchers, and that the lion’s share of university research is largely irrelevant to the needs of business. Interviewees also mentioned that sometimes national or local businesses lack the capability to use relevant research results, but said this is not necessarily the case at the global level.
Knowledge transfer officers reported that they have inefficient technology evaluation mechanisms and that their efforts to look for patentable inventions or other forms of IP to exploit were underdeveloped.
Interviewees felt that while recent German public funding initiatives had focused on excellence, support was also necessary at the average level to boost the volume of transfer activities. By definition, only a few research units can aspire to meet the standard of scientific excellence. Furthermore, the scientific excellence criterion leads to a focus on basic rather than applied research, producing researchers with absolutely no experience of working in the business sector. Examples mentioned included engineering faculties that were developing new fields of research with less evident industry relevance than Germany’s traditionally strong engineering education.
Relationships with the recently established PVAs were said to be suboptimal, complicated by their for-profit nature. However, it was also reported that knowledge transfer officers sometimes found it difficult to engage with firms as they typically had to follow strict university IP policies. This was seen as negative political pressure – the imperative to maximize license income in the short term undermined the chance to develop long-run business relationships with company partners.
In summary, the interviews confirm that efforts have been made to foster systematic KTT from science to industry in the past decade. However, a longstanding cultural divide between science and industry still inhibits knowledge exchange between them. In addition, the relatively new phenomenon of rigorous IP management by universities may have complicated bilateral agreements between universities and firms.
5.6 Conclusions
The German public science landscape is complex, with many different actors undertaking diverse KTT activities. The different types of university and different public research institutes have different missions regarding knowledge transfer.
We described the German knowledge transfer system using large-scale survey evidence from both scientific institutions and for-profit firms. Primary data collection and the analysis of secondary data provide plenty of evidence of KTT from public research organizations, ranging from patenting and licensing of inventions through to joint research projects between science and industry, contract research, exchange of personnel, and more modern forms of public–private partnerships such as shared research laboratories.
We also noted some changes in the German KTT system and considered analyses of their impact in the scholarly literature. While there is evidence that some policy measures have improved conditions for KTT, the story is not uniformly positive. The abolition of professor’s privilege in the early 2000s may well have reduced academics’ incentives to commercialize their inventions while the success of patent valorization agencies is moot.
Case study evidence from interviews supports our overall conclusion that policy has been trying to systematically improve the conditions for KTT in Germany in the last two decades, and several improvements have been documented. However, policymakers need to balance the incentives for basic and applied research to ensure that Germany’s science base is not hollowed out in the long run.
The challenge for universities and public research institutes is to deepen the understanding of IP and business-relevant research and applications within their institutions and to further improve communication between their researchers and industry.
6.1 Introduction
With the arrival of the knowledge-based economy, universities and public research institutes have emerged as key components of the national innovation system (NIS). According to Reference FreemanFreeman (1987), the NIS is “a network of institutions in the public and private sectors whose activities and interactions initiate, import, modify, and diffuse new technologies.” In the NIS literature, one role of universities and public research institutes is to channel their knowledge into firms. Universities also diffuse knowledge by producing quality students and interacting with firms through cooperative programs.
One of the most important characteristics of the Republic of Korea’s NIS is the “twin dominance” (Reference Eom and LeeEom and Lee 2010) of big businesses (chaebols) and the government. This implies a relatively weak role for universities and small and medium-sized enterprises (SMEs) (Reference Kim and NelsonKim 1993; Reference LimLim 2006; Reference Cho, Hwang and KimCho et al. 2007). For instance, universities and industry employ around 70 percent and 20 percent, respectively, of all doctorates in the Republic of Korea and yet, paradoxically, universities conduct only 10 percent of research activities in the country, while industry conducts 77 percent (OECD 2008). Additionally, as of 2005, 39.7 percent of researchers and 52.2 percent of PhD researchers were employed by the top twenty firms (Reference Eom and LeeEom and Lee 2010).
While big business groups have dominated the Republic of Korea’s NIS through their large in-house R&D since the mid-1980s, the government and public research institutes and universities initially led the country’s NIS during its early takeoff period in the 1960s and 1970s. In the 1970s, the Republic of Korea was in transition from light to heavy and chemical industries, but its national R&D base was weak. The government developed its national R&D capacity by setting up public research institutes and universities. Several were established based on the Special Research Institute Promotion Law of 1973 in the fields of machinery, shipbuilding, chemical engineering, marine science, and electronics. From the mid-1970s, chaebol firms started to grow rapidly and enter heavy and chemical industry. Afterward, the government played a significant role by providing a selected number of big firms with privileges such as concessional bank loans and exclusive access to foreign exchange. Even in the 1980s and 1990s, big business groups were aided by government-led public–private research consortia in achieving key R&D goals, with examples such as the development of TDX (a system of telephone switches), memory chips, and digital TV projects (Reference Lee and LimLee and Lim 2001; Reference Lee, Lim and SongLee et al. 2005). According to a study by the OECD (2003), the Republic of Korea is the only country in which public research institutes play a more important role in national R&D than do the universities themselves.
In contrast to public research institutes, universities have played a minor role in boosting the R&D performance of the private sector in the Republic of Korea. Big private firms relied more on foreign knowledge sources than local sources and universities, as they wanted to hire quality scientists and engineers from abroad or acquire technology in collaboration with foreign partners. Reference Kim and NelsonKim (1993) argues that the lack of interaction between university and industry, due to the teaching-oriented nature of Korean universities, is one of the greatest weaknesses of the country’s NIS. Research has received increasing priority in universities in the Republic of Korea only since the 1990s. For example, while Korea ranked nineteenth overall in terms of the number of Science Citation Index (SCI) papers in 1996, universities accounted for 83.0 percent of contributions (Reference 262Lee and LeeLee 1998).
From the late 1990s, the policy agenda shifted to encourage the entrepreneurial role of universities in expanding national technological capability. The Technology Transfer Promotion Act 2000 symbolizes this growing interest in knowledge transfer from public science. The Act stipulates that public universities should establish units or institutions, such as knowledge transfer offices (KTOs), charged with knowledge transfer and training specialists. Promotion of university–industry cooperation gained further momentum with the Act on the Promotion of Industrial Education and Industry–University Collaboration 2003. While there were only seventeen KTOs in 2003, their number increased rapidly after that, especially in 2004, when 263 more were created (KRF 2016). By 2014, 356 universities – about 84 percent of the country’s total – had established KTOs.
The main aim of this research is to explore the progress of the knowledge transfer system following these policy initiatives. Early assessments, such as that of Reference Eom and LeeEom and Lee (2010), found that knowledge industrialization in the Republic of Korea remained at an early stage compared to advanced countries. Specifically, while government initiatives had had some nominal success (e.g., in generating more patents), such generated knowledge had not been successfully commercialized. Our research suggests that the situation has barely improved from the situation described in Reference Eom and LeeEom and Lee (2010). Further, we argue that one source of the problem is the Republic of Korea’s legacy of success with the twin dominance of big businesses and government dominating the process of economic catch-up, which has meant that both the manner and extent of knowledge commercialization have not fully accommodated or embraced the needs and specificities of SMEs and universities. Thus, SMEs tend to complain that organizations and university technologies are unsuitable for their conditions. Conversely, university KTO offices are very weak in terms of financial and human resources, leading to underutilization or under-commercialization of relatively good quality research outcomes from university professors.
The rest of this chapter is organized as follows. Section 6.2 reviews the policy changes since 2000 that were designed to improve knowledge transfer from public research institutes. Section 6.3 focuses on the overall performance of knowledge transfer activities in public research institutes. Section 6.4 identifies the important knowledge transfer channels in the Republic of Korea and presents some examples of them. Section 6.5 reviews the challenges that government policy and public research institutes face in achieving successful knowledge transfer. Section 6.6 provides conclusions.
6.2 New Policies to Improve Knowledge Transfer from the Public Research Base
The Technology Transfer Promotion Act 2000 was the first law to encourage knowledge transfer from the public sector research base. It required public research institutes and public universities to establish KTOs and allowed the government to financially support university KTOs. The Act specified that public research institutes and university researchers were eligible to obtain a portion of the income from knowledge transfer, providing researchers with an incentive for knowledge transfer and commercialization. This became possible because, as with the Bayh-Dole Act in the United States of America (U.S.), it allowed universities to retain ownership of IP from government-funded research.
In addition, Korea Technology Exchange was founded by the 2000 Act to manage the knowledge transfer market and mediate knowledge transfer. It also provided various services such as technology evaluation and support for technology transfer agents. The 2000 Act created a system of technology transfer agents: a person who satisfies standard qualifications, such as an experienced lawyer or a government official, can be authorized as a technology transfer agent by the government if he or she completes a specific curriculum.
The Act on the Promotion of Industrial Education and Industry–University Collaboration 2003 deemed that most universities should have KTOs and could establish and run a for-profit “university company” using technology that they had developed, thus enabling direct commercialization.
The Technology Transfer and Commercialization Promotion Act 2006 focused more on commercialization than knowledge transfer. It required the government to include a budget for commercialization in R&D funding. Previous laws had provided that R&D funding was to be mainly used for technology development rather than commercialization; the new Act changed that. Accordingly, part of the expenses of KTOs were to be provided by the government, equating to 29 percent in 2014. Public research institutes received more government funding than did universities: 38 percent of the expenses of public research institute KTOs came from government while the figure for universities amounted to only 14 percent.
The 2006 Act allowed public research institutes to establish technology holding companies if they developed cutting-edge technology. These holding companies were allowed, in turn, to establish subsidiaries using their technology; such subsidiaries include incubating, business consulting, and funding to improve technology commercialization. Researchers or staff could take leave to work at the technology holding companies.Footnote 1
The law also specified that KTOs should receive more than 10 percent of total license income. Public research institutes were allowed to invest in forms of technology if authorized institutes such as the Korea Institute for Advancement of Technology (KIAT) appraised and established the value of the technology. The government also promoted the securitization of technology assets by using technology as collateral for loans; this was designed to help SMEs borrow money using their technology.
To increase knowledge transfer from universities, the government also provided money through several initiatives. First, 150 billion Won (KRW) was spent on the Connect Korea project between 2006 and 2010, the main goal being to invigorate the regional economy by improving KTOs’ ability to support knowledge transfer and commercialization. Second, the Hub University for Industrial Collaboration (HUNIC) project from 2004 to 2011 saw a budget of KRW 31 billion per year split among seventeen to twenty-three universities and colleges chosen by the government, with each receiving between KRW 0.8 and 4 billion per year. Third, the Leaders in Industry–University Cooperation (LINC) project, from 2012 to 2016 increased the number of supported universities and colleges to eighty, while the project budget increased to approximately KRW 250 billion per year.
Reference YoonYoon (2013) estimates that from 2004 to 2012, the government provided 473 university companies with KRW 119 billion in total. Accordingly, the number of university technology transfer contracts increased from 1,615 in 2010 to 3,247 in 2014. Universities’ income from licensing also increased from KRW 37.6 billion in 2010 to KRW 57.6 billion in 2014. The ratio of license income to R&D expenditure at universities increased from 0.94 percent in 2010 to 1.23 percent in 2014 (KRF 2016).
A new Market-Driven IP and Technology Transfer Promotion Plan, announced in April 2015, emphasized the maximization of market value from knowledge transfer. First, protection of intellectual property rights was strengthened. Previously, a specialized patent dispute court had been available only for first-instance legal disputes; this was extended to cover second-round disputes, meaning rulings at both levels would be based on more specialized expertise. The Plan also contemplated increasing the maximum punitive damages limit to three times the estimated damage amount, as was the case in US practice (Presidential Council on Intellectual Property 2015).
Second, the government relaxed some regulations that had resulted in low efficiency of knowledge transfer. To encourage patent quality in terms of commercialization, it changed the major performance evaluation yardstick to efficiency of knowledge transfer (calculated as license income divided by the cost of R&D). However, the outcome of this change remains to be seen. Previously, knowledge transfer had focused exclusively on domestic SMEs, but this restriction has been relaxed to include large or foreign firms, which may now also benefit from obtaining technologies from public research institutes (Presidential Council on Intellectual Property 2015). Restrictions regarding exclusive licensing were also relaxed, and public research institutes were given greater autonomy in choosing between exclusive and nonexclusive licensing. Regarding co-owned patents, the Plan allowed third parties to practice such patents if firms with co-ownership were not practicing them.
The Plan encouraged technology transfer agents or KTOs to identify firms’ technology needs, then help firms to connect with public research institutes capable of developing the required technology. It also encouraged KTO staff to participate in R&D from the beginning so that R&D projects reflected firms’ needs. To improve KTOs’ capabilities, the government started to allow several public research institutes and universities to share one joint KTO, especially where a public research institute or university was unable to afford its own independent KTO. The government also gradually increased spending on KTOs as a share of total R&D expenditure from 1.3 percent in 2010 to 3.3 percent in 2015. It provided fifty KTOs with KRW 9 billion per year between 2011 and 2015 (Presidential Council on Intellectual Property 2015). However, as we discuss later, the expected results of this have yet to be realized.
6.3 The Extent of Knowledge Transfer from Public Research in the Republic of Korea
Public R&D expenditure increased from KRW 3.8 trillion (USD 3.37 billion) in 2000 to KRW 15.28 trillion (USD 14.5 billion) in 2014. The ratio of public R&D expenditure to GDP also increased, from 0.63 percent in 2000 to 1.03 percent in 2014. The number of public research institutes rose by 80 percent between 2000 and 2014. Table 6.1 shows the trend of public R&D expenditure and the number of public research institutes and universities from 2000 to 2014. The R&D activities of both universities and public research institutes are funded by the government – in 2014, 91.2 percent of public research institutes’ R&D expenditure and 86.6 percent of universities’ R&D expenditure was government funded.Footnote 2 R&D expenditure and the number of research institutes has increased, as has R&D output activity. Thus, the share of Korean-authored science and technology papers among world SCI papers increased from 1.74 percent in 2000 to 3.64 percent in 2013 while the Republic of Korea’s share of granted patents among total US utility patents grew from 2.1 percent in 2000 to 6.01 percent in 2015 (USPTO).
Table 6.1 Public R&D expenditure and number of Korean public research institutes and universities, 2000–14
| Year | Public R&D expenditure (KRW million) | Public R&D expenditure (USD million) | Public R&D expenditure as a share of GDP (%) | Number of public research institutes | Number of universities |
|---|---|---|---|---|---|
| 2000 | 3,816,850 | 3,375 | 0.63 | 164 | 368 |
| 2001 | 4,361,534 | 3,378 | 0.67 | 152 | 357 |
| 2002 | 4,739,957 | 3,789 | 0.66 | 141 | 389 |
| 2003 | 4,876,225 | 4,091 | 0.64 | 154 | 398 |
| 2004 | 5,446,050 | 4,756 | 0.66 | 159 | 403 |
| 2005 | 5,877,167 | 5,739 | 0.68 | 150 | 332 |
| 2006 | 6,632,101 | 6,945 | 0.73 | 151 | 294 |
| 2007 | 8,177,479 | 8,802 | 0.84 | 193 | 361 |
| 2008 | 9,249,253 | 8,393 | 0.9 | 202 | 376 |
| 2009 | 10,888,944 | 8,527 | 1.02 | 236 | 391 |
| 2010 | 12,270,228 | 10,614 | 1.05 | 237 | 385 |
| 2011 | 13,003,277 | 11,736 | 1.05 | 237 | 385 |
| 2012 | 13,822,078 | 12,275 | 1.09 | 245 | 378 |
| 2013 | 14,241,744 | 13,006 | 1.00 | 269 | 414 |
| 2014 | 15,275,007 | 14,506 | 1.03 | 296 | 411 |
* R&D expenditure includes expenditure on all subjects, including social sciences and humanities. It also includes expenditure on administrative support staff.
The enactment of the Technology Transfer Promotion Act in 2000 encouraged IP commercialization and as a result, 54.6 percent of public research institutes and universities had KTOs by 2014. The rate of knowledge transfer reached 31.7 percent in 2014, which is similar to the rates in Europe (33.5 percent in 2008) and the U.S. (25.6 percent in 2008) (KIAT 2012).Footnote 3 As shown in Table 6.2, there was a steep rise in the number of domestic patent applications by public research institutes, which increased thirteen-fold between 2000 and 2015. The number of domestic patent applications by universities increased even faster, by thirty-two times, during the same period.
Table 6.2 Number of domestic patent applications by public research institutes and universities 2000–15
| Year | Total | Public research institutes | Universities | ||||||
|---|---|---|---|---|---|---|---|---|---|
| Number | Per 1,000 researchers | Per USD 1 m R&D expenditure | Number | Per 1,000 researchers | Per USD 1 m R&D expenditure | Number | Per 1,000 researchers | Per USD 1 m R&D expenditure | |
| 2000 | 2,302 | 35.1 | 0.72 | 1,675 | 120.4 | 0.93 | 627 | 12.1 | 0.45 |
| 2001 | 2,735 | 40.4 | 0.92 | 2,024 | 145.4 | 1.21 | 711 | 13.2 | 0.55 |
| 2002 | 3,613 | 50.4 | 1.04 | 2,656 | 188.4 | 1.30 | 957 | 16.6 | 0.67 |
| 2003 | 4,877 | 64.4 | 1.28 | 3,185 | 202.6 | 1.45 | 1,692 | 28.2 | 1.04 |
| 2004 | 5,441 | 71.9 | 1.21 | 3,479 | 221.3 | 1.34 | 1,962 | 32.7 | 1.02 |
| 2005 | 6,862 | 85.4 | 1.26 | 4,292 | 276.9 | 1.38 | 2,570 | 39.6 | 1.10 |
| 2006 | 11,612 | 140.4 | 1.78 | 6,051 | 360.8 | 1.65 | 5,561 | 84.4 | 1.95 |
| 2007 | 14,936 | 145.0 | 1.87 | 6,857 | 327.3 | 1.55 | 8,079 | 98.4 | 2.25 |
| 2008 | 16,704 | 162.1 | 2.17 | 6,892 | 329.0 | 1.63 | 9,812 | 119.5 | 2.81 |
| 2009 | 19,490 | 172.7 | 2.55 | 8,334 | 342.7 | 1.91 | 11,156 | 126.0 | 3.39 |
| 2010 | 21,057 | 175.9 | 2.20 | 9,109 | 347.2 | 1.67 | 11,948 | 127.8 | 2.91 |
| 2011 | 23,781 | 190.9 | 2.25 | 10,220 | 354.9 | 1.70 | 13,561 | 141.6 | 2.98 |
| 2012 | 25,906 | 206.0 | 2.39 | 11,211 | 389.0 | 1.82 | 14,695 | 151.6 | 3.14 |
| 2013 | 27,395 | 213.3 | 2.35 | 11,356 | 364.7 | 1.71 | 16,039 | 164.8 | 3.20 |
| 2014 | 28,408 | 214.2 | 2.16 | 10,398 | 312.0 | 1.35 | 18,010 | 181.3 | 3.29 |
| 2015 | 29,991 | 221.5 | 2.38 | 10,078 | 283.5 | 1.38 | 19,913 | 199.4 | 3.75 |
* Domestic patent applications count unique patents applications at the Korean Intellectual Property Office.
* The figure for “researchers” includes those in all disciplines including social sciences and humanities. It also includes PhD students at universities.
Table 6.3 shows that other outputs of R&D activity from universities and public research institutes also increased from 2007.Footnote 4 The average number of newly developed technologies per institute increased from 70.4 in 2007 to 107.1 in 2014. The average number of transferred technologies per institute rose from 13.4 in 2007 to 30.2 in 2014.
Table 6.3 Output of R&D activities by Korean public research institutes and universities – new technologies and knowledge transfer, 2007–14
| Year | Number of new technologies | Number of transferred technologies | ||||
|---|---|---|---|---|---|---|
| Per institute | Per 1,000 researchers | Per USD 1 m R&D expenditure | Per institute | Per 1,000 researchers | Per USD 1 m R&D expenditure | |
| 2007 | 70.4 | 139.89 | n.a. | 13.4 | 38.38 | n.a. |
| 2008 | 59.8 | 152.12 | n.a. | 12.4 | 33.62 | n.a. |
| 2009 | 80.7 | 140.78 | 2.65 | 14.0 | 32.02 | 0.60 |
| 2010 | 88.2 | 180.48 | 2.54 | 16.8 | 41.69 | 0.59 |
| 2011 | 81.3 | 155.08 | 2.32 | 20.6 | 40.28 | 0.60 |
| 2012 | 94.9 | 205.21 | 2.47 | 25.5 | 55.55 | 0.67 |
| 2013 | 88.4 | 258.83 | 2.65 | 27.6 | 80.64 | 0.83 |
| 2014 | 107.1 | 256.97 | 2.72 | 30.2 | 81.51 | 0.86 |
However, the efficiency of commercialization of research output from public research institutes and universities did not improve, even though outputs from R&D activity increased. The ratio of license income to R&D expenditure in public research institutes and universities was 1.38 percent in 2009; it remained at 1.35 percent in 2014. Korean public research institutes and universities had over 190,000 technologies in 2012, but 154,000 of these were not commercialized (Reference Lee and KimLee and Kim 2015). One explanation could be the short history of IP commercialization by licensing. Korean public research institutes and universities previously provided the country’s firms with many free new technologies and KTOs were only established after 2000. Thus, the KTOs of Korean public research institutes and universities have not acquired enough experience in, or developed enough capacity for, IP commercialization. The average number of KTO staff per institute was only 2.7 full-time equivalent in 2014 with an average work experience within the KTO of just 2.6 years (KIAT 2016).Footnote 5
These average figures mask very different performance between the best and worst public research institutes and universities. Licensing incomes are highly concentrated among a small number of top public research institutes, but less concentrated in the case of universities. The five leading public research institutes received 64 percent of total public research institute license income in 2014, whereas the top five universities obtained 27.9 percent of total university license income in 2014. The leading public research institutesFootnote 6 had a ratio of license income to R&D expenditure of 2.11 percent in 2014. In contrast, university knowledge transfer was less efficient, with a ratio of license income to R&D expenditure of 1.16 percent. Leading universities performed much worse than the average – the ratio of license income to R&D expenditure of the five leading universities was only 0.93 percent. As Reference Ok and KimOk and Kim (2009) note, Korean universities focused on education rather than research until the 1980s, so their research capability and commercialization ability was even lower than that of public research institutes.
The emphasis on knowledge transfer since 2000 has led public research institutes and universities to develop more transferrable technologies at the expense of technology quality. Further, universities and public research institutes may have split technologies into many small patents to help maximize their scores in performance evaluation. There are several indicators of this. The share of transferred technology among the total number of valid knowledge transfer contracts that resulted in increased sales was 14.1 percent in 2009, but had fallen to 12.4 percent in 2014. License-based incomes per institute from knowledge transfer did not increase. The average license income per institute was KRW 625.2 million (USD 0.67 million) in 2007, falling to KRW 561.3 million (USD 0.53 million) in 2014. Since the average number of transferred technologies per institute has increased since 2007 (see Table 6.3), we can infer that the average license income per transferred new technology has fallen. Average license income per transferred technology was KRW 40 million (USD 36,300) in 2008, but KRW 18 million (USD 16,440) in 2013. Table 6.4 presents these statistics.
Table 6.4 Output of R&D activities by Korean public research institutes and universities – license income, 2007–14
| Year | License income | License income as a share of R&D expenditure (%) | Knowledge transfers resulting in sales as a share of the total number of valid knowledge transfer contracts (%) | ||
|---|---|---|---|---|---|
| Per institute (USD million) | Per 1,000 researchers (USD million) | Per transferred technology (USD thousand) | |||
| 2007 | 0.67 | 1.24 | n.a. | n.a. | n.a. |
| 2008 | 0.45 | 1.22 | 36.30 | n.a. | n.a. |
| 2009 | 0.33 | 0.74 | 22.71 | 1.38 | 14.1 |
| 2010 | 0.49 | 1.05 | 25.09 | 1.48 | 18.3 |
| 2011 | 0.59 | 0.88 | 21.66 | 1.32 | 23.6 |
| 2012 | 0.74 | 1.22 | 22.20 | 1.47 | 33.6 |
| 2013 | 0.45 | 1.33 | 16.44 | 1.36 | 15.9 |
| 2014 | 0.53 | 1.27 | n.a. | 1.35 | 12.4 |
* License incomes include both lump-sum payments and running royalties.
If we compare leading Korean and US universities, the number of transferred technologies (license agreements) is similar. The total knowledge transfers per year by the Seoul National University (SNU) is seventy-nine, and the figure for Stanford University is 101. However, average license income per transferred technology shows a huge gap. Average license income per transferred technology for the SNU is KRW 58 million, but for Stanford it is KRW 734 million. One of the main reasons is that Stanford has several patents, such as a Google-licensed search patent, which earn lots of money. Three important patents earned 75 percent of Stanford’s license income from 2000 to 2010.
Another possible reason for this low efficiency is that the focus of knowledge transfer in public research institutes in the Republic of Korea switched from big businesses to SMEs. SMEs cannot usually pay high license fees due to their limited financial resources. Large firms and foreign firms can pay higher license fees, but the government of the Republic of Korea made the country’s public research institutes prioritize knowledge transfer to domestic SMEs over large or foreign firms in an attempt to reduce the huge productivity gap between large firms and SMEs. Fully 90.7 percent of knowledge transfer contracts from public research institutes were concluded with SMEs in 2014. License income per transferred technology was KRW 15.39 million from SMEs and KRW 52.51 million from large firms in 2014.
As regards the sectoral distribution of transfer activity from universities, Reference Kwon, Seo, Kim, Kim and ParkKwon et al. (2014) analyzed 5,249 knowledge transfer contracts between universities and firms from 2011 to 2013 to identify the number of contracts by industry. Table 6.5 shows the top seven industries by the number of knowledge transfer contracts. The electronic parts, video, sound, and communication equipment industry accounted for the largest share in terms of both the number of knowledge transfer contracts and license income, which is reasonable given that this is the major industry in the Republic of Korea. The IT services and software industry also had a large number of knowledge transfer contracts. The textile and food industries had a relatively large number of contracts, but their license income was small. Thus, the size of knowledge transfer contracts is small in these industries.
Table 6.5 University knowledge transfer contracts by industry, 2011–13
| Industry | Number of knowledge transfer contracts | Share of knowledge transfer contracts (%) | License income (KRW million) | Share of license income (%) |
|---|---|---|---|---|
| Electronic parts, video, sound, and communication equipment | 526 | 13 | 12,748 | 13 |
| IT services and software | 397 | 10 | 7,291 | 7 |
| Other machinery and equipment | 376 | 9 | 7,765 | 8 |
| Chemicals and chemical products | 290 | 7 | 12,731 | 13 |
| Textiles (excluding clothing) | 274 | 7 | 969 | 1 |
| Medical and optical instruments and watches | 261 | 6 | 12,654 | 13 |
| Food and beverages | 232 | 6 | 2,319 | 2 |
The Science and Technology Policy Institute (STEPI) conducts a survey every two or three years to reveal the sources of innovation for Korean firms’ innovation activities. In this survey, STEPI asks firms about the major sources of information/knowledge for their R&D activities. In their answers, firms identify universities, research institutes (public or private) or other sources such as in-house, suppliers and customers as their main source of information. Table 6.6 summarizes the main findings in this regard.
Table 6.6 Firms reporting universities or research institutes as sources of innovation information, 2011–13
| Industry | Source of information for innovation activity | |
|---|---|---|
| Universities or other higher education institutions (%) | Public or private research institutes (%) | |
| Electronic parts, video, sound, and communication equipment | 15.4 | 20.0 |
| IT services and software | n.a. | n.a. |
| Other machinery and equipment | 14.8 | 10.8 |
| Chemicals and chemical products | 21.9 | 27.0 |
| Textiles (excluding clothing) | 14.4 | 15.6 |
| Medical and optical instruments and watches | 15.9 | 8.8 |
| Food and beverages | 24.4 | 22.8 |
Research institutes are used more in the electronic and chemical industries, perhaps because these have been the major industries in the Republic of Korea since the 1970s and have a long history of collaboration with public research institutes. Universities are used more in the other machinery and medical and optical instruments industries. The medical and optical instruments industry is science-based and depends more on universities than other industries. The food and textiles industries depend on both universities and research institutes.
Korean universities interact with both local and foreign firms, but the share of foreign firms is small. According to Reference Kwon, Seo, Kim, Kim and ParkKwon et al. (2014), only 1.4 percent of knowledge transfer contracts from Korean universities in 2012 were with foreign firms and they accounted for only 0.68 percent of total license income. Most of the interaction occurs between universities and local firms.
6.4 Knowledge Transfer Channels in the Republic of Korea
There are various knowledge transfer channels from public research institutes to the private sector, including reading papers, attending conferences, IP licensing, employing researchers and graduate students, startups, consulting by researchers, using public research institutes’ research facilities, collaborative R&D, and informal discussion between firms and public research institutes. These can be classified into formal and informal transfer channels, with formal channels being those based on contracts.
Reference Cho, Hwang and KimCho et al. (2007) surveyed 600 Korean firms to study how they cooperate with public research organizations to transfer knowledge. Table 6.7 summarizes their main results. The most common channel of knowledge transfer in the Republic of Korea is collaborative R&D commissioned by firms. About 60 percent of the firms that cooperate with public research organizations used this channel as the primary cooperation type. Reference Cho, Min and LeeCho et al. (2009) argue that this is because government supports collaboration between industry and public research organizations in the Republic of Korea. The second most common channel in their survey was use of public research facilities. Twenty percent of firms reported this channel as their primary method. There is no similar category in the equivalent US survey (the 1994 Carnegie Mellon Survey), so direct comparison between the U.S. and the Republic of Korea is difficult, but it is clear that using research facilities are more important to Korean firms than IP licensing or establishing startups. About 10 percent of Korean firms reported consulting and lectures by researchers in public research institutes as the primary channel, which makes it less important than consulting in the US survey. Other types of transfer, such as hiring, licensing, education of staff members, and startups are not very significant in the Republic of Korea.
Table 6.7 Primary types of cooperation with public research organizations among surveyed firms
| Object of cooperation | ||
|---|---|---|
| Type of cooperation | University (percentage share of each type of cooperation) | Public research institute (percentage share of each type of cooperation) |
| Collaborative R&D or commissioned research by firms | 62.9 | 58.0 |
| IP licensing | 2.9 | 4.8 |
| Using public research facilities | 16.1 | 22.7 |
| Dispatch of staff between firms and public research organizations | 3.4 | 1.2 |
| Startup or joint venture between firms and public research organizations | 0.3 | 2.7 |
| Commissioned education of firms’ staff | 2.1 | 0.0 |
| Consulting or lectures by public research organization researchers | 8.8 | 8.2 |
| Activities of public research organization researchers as official consultants for firms | 3.6 | 2.4 |
Table 6.7 also shows some differences between public research institutes and universities in the Republic of Korea. Interaction between universities and firms is mostly consulting and training-based while that between public research institutes and firms tends to involve IP licensing, joint ventures, and laboratory infrastructure, seemingly reflecting the fact that universities are education-oriented whereas public research institutes have better research capabilities and facilities.
6.4.1 Formal Channels in Public Research Institute and University Knowledge Transfer Contracts
Drawing on the results of the various KIAT surveys of public research organizations in the Republic of Korea (see Appendix for details), Table 6.8 shows the total number of knowledge transfer contracts in public research organizations and the share of each knowledge transfer channel. IP licensing is a more common (formal) knowledge transfer practice than sales of technologies. The share of license contracts among the total number of knowledge transfer contracts was 68.5 percent in 2014 whereas the share of technology sales was only 12 percent. However, free-of-charge licensing also accounts for a significant share of knowledge transfer contracts – 10.7 percent in 2014 – because one of the main goals of Korean public research institutes and universities is to support SMEs by providing them with free technology. As there is a large technology gap between large firms and SMEs, the government has used public research institutes and universities to improve the technological competitiveness of SMEs.
Table 6.8 Knowledge transfer contracts and share of different types of knowledge transfer, 2007–14
| Year | Number of knowledge transfer contracts | Share of technology sales (%) | Share of licensing (%) | Share of free licensing (%) |
|---|---|---|---|---|
| 2007 | 2,593 | 22.6 | 65.0 | 6.7 |
| 2008 | 2,641 | 10.8 | 74.2 | 10.0 |
| 2009 | 2,918 | 7.7 | 75.7 | 14.8 |
| 2010 | 2,940 | 5.9 | 86.3 | 6.1 |
| 2011 | 3,420 | 9.6 | 80.7 | 5.2 |
| 2012 | 4,312 | 8.9 | 82.5 | 6.5 |
| 2013 | 4,358 | 12.3 | 79.3 | 6.0 |
| 2014 | 5,981 | 12.0 | 68.5 | 10.7 |
Within IP licensing, lump-sum payment dominates. While there are presently no statistics to prove this, most of the respondents in this study confirm it anecdotally. In contrast, most IP licensing in leading US universities involves running royalties. The low efficiency of the knowledge transfer market involving public research organizations in the Republic of Korea, in the sense that there is a low level of trust on both sides, makes negotiating long-term contracts involving running royalties difficult. This is bad for research organizations as running royalties, proportional to increased sales, may generate a more stable income. Conversely, no firm was willing to pay a large lump sum because of the uncertain sales potential of the transferred technology.
The total number of startups in 2014 created using technologies from public research institutes and universities was 136; the number of startups by staff (spinoffs) was 108; the number of startups by other people using public research IP was twenty-eight; and the average number of startups per institute was 0.54, which is relatively small compared to rates in the U.S. and other countries. However, several leading public research institutes created more startups: twenty-four leading public research institutes under the auspices of the National Research Council of Science & Technology (NST) created forty-one startups, and the average number per institute was 1.7 (KIAT 2016).
One special type of startup from public research institutes is the “laboratory company,” which is defined in the Special R&D Zone Promotion Act 2005. If a startup from a public research institute is located in a special R&D zone and the institute invests more than 20 percent of the capital, then it can be authorized as a laboratory company and exempt from tax for three to seven years. The technology of public research institutes can be regarded as the startup’s capital, so it is not difficult for such startups to be authorized as laboratory companies.
In 2016, there were 219 laboratory companies in the five special R&D zones (Daedeok, Daegu, Busan, Gwangju, and Jeonubuk). Due to government support and advanced technologies from public research organizations, their sales increased tenfold and their employment increased fivefold between 2009 and 2015, as shown in Table 6.9. The five-year survival rate of laboratory companies was about 64.9 percent, more than double the survival rate of normal startups (29.6 percent) (Ministry of Science, ICT, and Future Planning 2014).
Table 6.9 Laboratory companies – sales and employment, 2009–15
| Year | Sales (KRW billion) | Employment |
|---|---|---|
| 2009 | 28.3 | 237 |
| 2010 | 43.0 | 272 |
| 2011 | 72.4 | 310 |
| 2012 | 120.8 | 524 |
| 2013 | 164.3 | 639 |
| 2014 | 236.5 | 850 |
| 2015 | 288.1 | 1,194 |
6.4.2 Qualitative Evidence of Successful Knowledge Transfer
IP licensing by ETRI represents a case study of successful licensing. ETRI is the largest public research institute in terms of both R&D expenditure and license income. It earned KRW 34.6 billion from licensing in 2014 – about a quarter (24.7 percent) of the total license income of all Korean public research organizations. Its ratio of license income to total R&D expenditure is 8.4 percent – the highest ratio among Korean public research organizations.
One example of successful IP licensing at ETRI involved a company called Initech, an IT security system company that started in 1997 with two employees. Its core technology is a user authentication solution based on public-key infrastructure (PKI) which ETRI transferred to it through IP licensing in December 1999. In the late 1990s, the number of users of Internet and e-commerce increased rapidly, and so IT security in e-commerce became important. ETRI started research into authentication servers and systems in 1995, as a project for the Korean Ministry of Information and Communication. At an early stage of R&D, ETRI identified potential users of the technology, such as public financial institutions (e.g., the Korea Financial Telecommunications & Clearing Institute). Within four years, ETRI had developed an “authentication processing protocol and verification technology,” and transferred this technology to Initech.
Public-key infrastructure is the system relating to the generation, authentication, distribution and management of public-key encryption, a method of data encryption that uses different keys for encryption and decryption. It is a more secure method than its predecessor, secret-key encryption, and became widely adopted as demand from e-commerce and Internet banking increased. Even after knowledge transfer, researchers in ETRI frequently helped Initech to further develop its own system and service.
Apart from the favorable demand conditions, government policy also contributed to the success of Initech. The government recognized the PKI-based technology as the industry standard in 1999, encouraging more domestic users to adopt it. In turn, this helped the rapid growth of Internet banking and e-commerce.
Although several hundreds of technology startups existed in 2014, most remained small and did not develop a stable growth path. One of the most successful cases of a startup from a public research institute comes from the Korea Atomic Energy Research Institute (KAERI). KAERI is the third-largest public research institute in the Republic of Korea. It started to develop health-promoting functional foods focusing on boosting immunity in 1997. Researchers at KAERI recombined medicinal herbs such as dong quai, cnidium, and white woodland peony using radiation technology. It took six years to develop the original technologyFootnote 7 and cost KRW 1.2 billion in R&D. Researchers at KAERI were confident of the quality of their product and decided to establish a company, reaching an agreement with a private company, Kolmar Korea, in 2001. KAERI had transferred other technologies to Kolmar Korea before 2001, and so Kolmar Korea was interested in its new technology.
However, KAERI faced a difficulty as government-appointed directors on its board opposed the agreement, arguing that public research institutes should not engage in income-generating businesses and that there was no precedent for a public research institute providing funds to establish a company.Footnote 8 This is interesting because the government of the Republic of Korea had already enacted the Technology Transfer Promotion Act 2000 and mandated public research institutes to establish KTOs.
No company was established for three years. However, finally KAERI changed its strategy and chose technology investment, which meant that the value of KAERI’s technology was regarded as capital and so it did not have to invest any cash. This plan persuaded the government, so KAERI and Kolmar Korea co-established a company, Sunbiotech, in 2004. Sunbiotech can be classified as a joint venture, as the value of KAERI’s technology was approved as KRW 378 million and Kolmar Korea invested KRW 622 million as capital.
Sunbiotech’s sales were poor at first because the product did not obtain approval from the government as a functional health food. The company achieved total sales of between KRW 0.8 and 1.2 billion between 2004 and 2006. Finally, in 2006, it obtained approval for the product as a functional food from the Ministry of Food and Drug Safety. This was one of the first approvals in the Republic of Korea for a functional food that improves immunity. It also obtained authorization from the government as the first laboratory company under the Special R&D Zone Promotion Act 2006. Using that governmental authorization, it was able to sell its products as health-promoting, functional foods that improve immunity. It grew rapidly, with sales increasing from KRW 3.8 billion in 2007 to KRW 9.9 billion in 2008 and KRW 20.1 billion in 2009 (Reference HamHam 2015). By 2013, sales reached KRW 121.5 billion and the company’s name was changed to Kolmar BNH. It was floated on the KOSDAQ stock market in 2015.
The sales and operating profit of Kolmar BNH reached KRW 236.2 billion and KRW 34.4 billion respectively in 2015, by which time the company had 156 employees. By July 2016, its market value stood at around KRW 1 trillion. KAERI held 16.1 percent of Kolmar BNH’s stock at the time of the IPO, and earned over USD 100 million, a sum greater than the total license income of all Korean public research institutes in 2014. The case of Kolmar BNH thus shows the potential of startups and joint ventures in knowledge transfer and commercialization. Following the success of Kolmar BNH, the government of the Republic of Korea changed its attitude and started to actively support public research organization startups.
The KAERI KTO played an important role in the success of Kolmar BNH as it started to apply for Korean and international patents on the core ingredients of the product between 2000 and 2003, just three years after the start of its R&D activities. It applied for the trademark “HEMOHIM” in relation to its products in 2002.
Another factor in Kolmar BNH’s success was reputation. KAERI has a fifty-year history and is well known as the third-largest Korean public research institute, so Korean consumers trusted the product more than products from other startups. The stability and safety of the product are very important factors to consumers in the functional health food market, so the reputation of KAERI helped Kolmar BNH to survive in its early stages.
As in the case of Initech, demand also helped Kolmar BNH to succeed. As income levels in the Republic of Korea rose, people started to pay more attention to their health and the market size for functional health foods increased rapidly. Production of functional health foods in the Republic of Korea increased from KRW 700.8 billion in 2006 to KRW 1.48 trillion in 2013, and the annual growth rate was 11.5 percent during this period (Reference HamHam 2015).
A further factor explaining the company’s success was the management skill available from a private firm. A typical problem in public research organization startups is the lack of sound management skills. However, Kolmar BNH was a joint venture with the private sector, and the managers and employees of Kolmar BNH had the benefit of the management knowhow of Kolmar Korea.
6.4.3 Informal Knowledge Transfer Channels
As seen in Table 6.7, the proportion of firms that actually use formal channels is small. To detail other knowledge transfer channels, Reference Cho, Min and LeeCho et al. (2009) cite examples that do not use IP licensing or startups. We summarize those examples here.
Company SFootnote 9 is a leading Korean ICT firm that actively cooperates with public research organizations, but it does not use IP licensing or startup channels to transfer knowledge from them. Instead, its main knowledge transfer channel is the participation of its staff in seminars or education programs provided by public research organizations. For example, it began research into optical materials in the early 2000s, attracted by the thriving optical industry, but since it lacked basic knowledge about optical materials, it sent researchers to participate in relevant university seminars.
It also uses researchers from public research organizations as consultants. Company S has built a network of specialists, and consults them about technology trends and information in their specialized fields. To do this, it undertakes an annual program of twenty–thirty technology seminars with them. In addition, the CEO of the company holds periodic meetings with key experts. It usually consults researchers in public research organizations about the market or technology situation for emerging technology. For instance, it consulted researchers at the Korea Institute of Energy Research about the market prospects and technology when solid oxide fuel cell technology was regarded as promising.
A third knowledge transfer channel is collaborative R&D. As technological convergence/fusion has deepened, Company S has needed collaborative R&D because it does not have research capability in some technology fields. For example, it needed film-coloring technology for PDP (plasma display panel) filters, but did not have research capability in that field. It therefore collaborated with SNU to develop the technology. It obtained basic knowledge about the technology through a year of collaborative research.
However, Company S has not used IP licensing for knowledge transfer. There has been no case of licensing or joint venture with public research institutes. It has previously concluded license contracts with firms in an advanced country, but has not licensed technology from domestic public research organizations. The main reason seems to be that as Company S has recently become a leading ICT firm in the global market, it needs world-class technology to compete, but domestic public research organizations do not offer research capability at a sufficiently high level.
Using research facilities is the second most used knowledge transfer channel in the Republic of Korea, as shown in Table 6.7. However, Company S has not used research facilities in public research organizations, presumably because it is a big firm and has most of the research facilities that public research organizations have and so does not need to use external facilities.
Company S has barely used basic research outputs from public research organizations such as reports, papers, and patents because basic research is not relevant to the company’s technology roadmap.
In sum, leading companies such as Company S primarily use public research organizations as consultants, trainers of their staff, and partners in collaborative research. However, they barely use research outputs such as papers, patents, and technologies produced by public research organizations, which might reflect the relatively low level of research capability of such organizations.
Another example of knowledge transfer channels that shows the importance of informal channels is ViroMed Inc. ViroMed was established by Professor Sun-Young Kim from SNU in 1996. Its main products include DNA, protein, and cell-based biotherapeutics that can treat incurable diseases such as diabetic peripheral neuropathy, peripheral artery disease, amyotrophic lateral sclerosis (Lou Gehrig’s disease), and thrombocytopenia.
Professor Kim received KRW 150 million in government funding as part of a leading technology development project in 1994. It was a joint project with a firm. Professor Kim’s team achieved positive results concerning DNA-based biotherapeutics in 1996. They published their results in Science in 1996 and applied for patents in 1997. After these results, Professor Kim suggested that a firm participating in the project invest and commercialize the product, but the firm refused due to the high risk in the biotherapeutics sector. Following a presentation by Professor Kim at an international conference, a UK venture capital company indicated its intention to invest in his research. Using that investment, Professor Kim established ViroMed in 1996.
ViroMed agreed to a technology export contract with Oxford Biomedica, a UK firm, in 1997, and Takara Shuzo, a Japanese firm, in 1999. On the basis of this export agreement, ViroMed was able to attract both domestic and foreign investment. It was floated on the KOSDAQ stock market in 2005. Its market value reached KRW 1.64 trillion in October 2016, following sales of KRW 7.7 billion and operating income of KRW 1.1 billion in 2015. Its market value is high compared to its sales and operating income because clinical trials of its major products have yet to be completed, even though those products are regarded as high quality. As of October 2017, some of its biotherapeutics are in phase III clinical trials (the final step before coming to market) and some are in phase II in the U.S., China, and the Republic of Korea.
Informal channels of knowledge transfer are important, as shown in the ViroMed case, which was established because a UK venture capital firm was interested in its work after learning about it at an international conference.
Another important informal channel is the use of research facilities at public research organizations. The initial capital of ViroMed was only KRW 200 million and, as such, it did not have enough money to buy research facilities. To solve this problem, SNU allowed Professor Kim and ViroMed to use its research facilities. Without such support, ViroMed would not have been able to continue its research.
A third informal knowledge transfer channel involves hiring graduate students. ViroMed started in the form of a “university company,” so Professor Kim could work with graduate students in his laboratory at SNU, thus providing ViroMed with high-quality personnel.
One distinctive feature in ViroMed’s case is that knowledge transfer to domestic firms is very hard. Unlike Korean ICT firms, Korean pharmaceutical firms have been very reluctant to invest in high-risk projects. They have been used to licensing-in foreign technology. This case shows that domestic industrial capability can affect knowledge transfer from public research organizations. Low industrial capability means that domestic firms have insufficient knowledge and are unable to properly evaluate the potential and risks of new technology. Professor Kim indicated that the most serious problem during the growth process of ViroMed was technology evaluation (Reference Cho, Min and LeeCho et al. 2009).
6.4.4 The Government-Funded Nonpracticing Entity
One distinctive feature of knowledge transfer in the Republic of Korea is the existence of a government-funded IP nonpracticing entity (NPE). This approach began in 2010 to protect domestic firms against patent infringement lawsuits by global NPEs or patent trolls. At that time, US private NPEs started buying many Korean patents from public research organizations, sparking public concern that they might use them to file IP lawsuits against domestic firms, taking advantage of the fact that most Korean firms did not seriously consider IP issues at that time. To prevent this possibility, the government decided to set up an entity serving as a pool of patents owned by Korean agents. Thus, the government and big businesses invested about KRW 58 billion and established an IP NPE with the name of Intellectual Discovery (ID), one of the first government-funded IP NPEs in the world; other countries such as Japan, China, and France have since followed suit.
Intellectual Discovery, ranked sixth globally, buys domestic and foreign patents, and had a portfolio of about 5,000 patents by 2016. Its first objective is to protect domestic firms from patent infringement lawsuits. Big firms that funded it initially and have paid license fees can use the patents that it owns. SMEs can obtain membership and license patents by paying a relatively small fee. If foreign firms or NPEs file a lawsuit against domestic member firms, ID provides them with professional help and even some patents which can be used defensively for cross-licensing. If foreign firms or NPEs violate patents that ID holds, ID can charge them with patent infringement and, on behalf of any domestic firm, negotiate for settlement and for legal process.
6.4.5 Important Factors in Knowledge Transfer
The cases cited earlier show the important factors in each type of knowledge transfer channel. The cases of Initech and Kolmar BNH show the importance of follow-on/adaptive R&D by public research institutes after initial knowledge transfer, which is consistent with the results of the qualitative analyses of Reference KimKim (2012) and Reference Lee, Kim and ParkLee et al. (2015). Furthermore, the case of Kolmar BNH shows the benefits of having a joint venture with existing firms, allowing it to draw on the management skills of the parent companies. Nevertheless, the fact that both were supported by favorable demand conditions suggests it might not be easy to obtain successful results by IP licensing or through a startup if demand conditions are poor.
The cases of Company S and ViroMed show the importance of contract/collaborative research and using facilities in the public sector for knowledge transfer from the public science base. Company S relies on collaborative R&D and consulting, whereas ViroMed relies on using research facilities in public research institutes. The Company S case suggests that the level of research capability of public research institutes may be an important success factor for knowledge transfer, as we argued in Section 6.2. The ViroMed case shows the importance of informal transfer channels such as conferences, even though firm survey data usually rank these as unimportant. It also shows that knowledge transfer from public research institutes can be more difficult in sectors where the country has relatively weak industrial capacity. This may be related to knowledge transfer from ETRI in the ICT sector being more efficient than that of public research institutes in other sectors.
Last, the establishment of ID is an institutional innovation, driven by the government of the Republic of Korea to protect domestic firms against patent infringement by hostile foreign actors.
6.5 Public Policies and Knowledge Transfer Challenges
The government of the Republic of Korea started focusing on knowledge transfer in 2000 and tried to “create” knowledge transfer markets using various policies and projects. In other words, the major player in the knowledge transfer system was the government itself rather than private agents. However, the country’s institutional system for knowledge transfer remains immature, and some of the legacy of the developmental state of the past hinders the realization of a knowledge transfer market. This section will discuss important institutional challenges encountered in the Republic of Korea.
6.5.1 Institutional Challenges
One of the first and fundamental challenges is that legal protection of IPR remains weak in the Republic of Korea. Although the country was ranked twenty-ninth among 128 countries for IPR protection in 2016 in the International Property Rights Index (IPRI), actual protection by the courts is weak compared to advanced countries. For example, the probability of the plaintiff winning a patent infringement lawsuit was 20 percent in 2011, far lower than that in the U.S. (60 percent). Furthermore, when the plaintiff did win, average damages from 2009 to 2011 were just KRW 78 million – a mere 0.77 percent of the US figure (Presidential Council on Intellectual Property 2015). The expected payout to the plaintiff was only KRW 15.6 million compared to legal costs of approximately KRW 200 million, severely decreasing the incentive to file a patent infringement lawsuit. In consequence, firms have little incentive to buy licenses or patents from public research institutes if they can obtain technology in other ways, reducing the efficiency of knowledge transfer from public research institutes and depressing the knowledge transfer market.
Weak IPR protection is a legacy of the developmental state during the catch-up period. The major knowledge transfer channel in this period was copying technology from firms in advanced countries. Korean firms did not hesitate to copy good domestic or foreign technology. Furthermore, patent lawsuits were dealt with by the ordinary courts, where judges lacked the technological expertise to analyze the issues at stake. While dozens of private knowledge transfer agents exist, their IP business is mainly geared to foreign countries; they do not usually file domestic lawsuits for patent infringement even when the IPRs of their domestic clients are violated.
6.5.2 Immature Capabilities of Government and the SMEs Sector
A second set of challenges relate to the government’s immature policies for knowledge transfer. One of the clearest examples is co-ownership of patents from publicly funded research. It is often difficult for co-owners to reach consensus about whether to license and, if so, to whom, and as a result co-owned patents tend to be underutilized or under-licensed. Thus, while co-owned patents accounted for around 10 percent of total patents in the Republic of Korea in 2013, only 2.8 percent of patent transactions involved co-owned patents. This problem is especially severe when public research institutes and private firms share a patent. As public research institutes do not have production facilities, they cannot make money directly using shared patents.
A second or related problem concerns types of license. The government has tended to encourage nonexclusive licensing to promote more and wider uses of technologies developed by public research institutes. However, this can undermine the interests of licensee firms, which will generally want to use the technology exclusively to increase their potential profits, and it also fails to offer any extra reward to first-licensee firms, which take a bigger commercial risk than follow-on firms in acquiring technology before its value has been proved in the market. Firms have therefore avoided nonexclusive licensing, reducing licensing income for the public research institutes.
The preferred form of licensing payment is a lump sum. This contrasts with the situation in the U.S., where running royalties make up around 70–80 percent of total license income for the leading universities. And even when a running royalty clause is included in the contract, firms do not usually reveal their true sales from the technology to public research institutes – a serious implementation issue and a possible case of market failure.
Other challenges for knowledge transfer in the Republic of Korea stem from the short history of its knowledge transfer system and the primary role of the government in developing that system. The R&D process in public research organizations does not fit the needs of SMEs. Until the 1990s, the major partners of public research institutes included big firms such as Samsung and LG, because their R&D capability remained weak. However, as their R&D capability has improved due to large in-house R&D investment, big firms can conduct their own R&D without the support of public research institutes. As a result, SMEs have become the major partners of public research institutes, accounting for 90.7 percent of knowledge transfer contracts with public research institutes in 2014 (KIAT 2016).
As the R&D capability of SMEs is weak, public research institutes have to develop technology to an advanced stage, until it is ready for commercialization. However, many government-supported R&D projects do not consider this issue. The normal R&D project duration is two to three years, and public research institutes usually have only completed laboratory-stage development within this period. In terms of technology readiness level (TRL),Footnote 10 SMEs need at least TRL level 7 technologies (technology demonstrated by prototypes in operational environments), but public research organizations usually tend to provide only TRL level 4 technologies (technology validated in labs). Thus, there is a serious gap in of the technology level demanded and supplied, which hinders effective commercialization of R&D conducted in public laboratories.
SMEs cannot successfully commercialize the transferred technology due to their weak R&D capability. As a result, the technology is not utilized successfully and public research organizations and SMEs tend to blame one another for this failure. It also decreases future private demand for technology from public research organizations. Government therefore needs to provide public research organizations with enough time and funds to complete the technology to a sufficient level. Otherwise, a short-termist reluctance to commit to extra spending decreases the efficiency of public R&D projects. An interviewee from ETRI said that this is a major barrier in knowledge transfer, which is consistent with the findings of several qualitative studies and case studies that emphasize the importance of follow-on/adaptive (or after-transfer) R&D being provided by public research organizations to ensure successful knowledge transfer.
6.5.3 Issues with Public Research Institutes and Universities
One problem is due in part to the specific nature of the project imposed on public research institutes in the Republic of Korea. In the project-based system, the government allocates R&D expenses, including the researchers’ salaries and overhead costs for each R&D project. The main goal of the project-based system is to increase the cost efficiency of R&D, but it generates some side effects. Researchers at public research institutes have to undertake as many R&D projects as possible to generate their own income, because the majority of R&D funding is determined by the number of R&D projects executed and the researchers’ salaries are part of the acquired R&D budget. Furthermore, given that each public research institute’s budgetary resources are proportional to the size of the R&D funding it receives, public research institutes incentivize researchers who obtain more R&D projects. Such a system induces researchers to try to obtain as many public R&D projects as possible. Thus, the average number of R&D projects per researcher per year reached as high as 4.8 in 2011 (Reference Kim and ShimKim and Shim 2013), reducing the amount of time that researchers could spend on each project and diminishing the quality and TRL of R&D results.
Public research organizations also face problems relating to the low capability of KTOs. Despite support from various government laws and projects, KTOs employ small numbers of staff and lack many important skills for successful commercialization. Furthermore, many KTOs implement a staff rotation system, making it difficult for them to accumulate the necessary skills. Incentives for KTO staff to commercialize technologies are weak – 61.8 percent of public research organizations gave no license income to any KTO staff in 2014 even if they played a role in the commercialization of technologies (KIAT 2016). The average share of license income going to KTO staff that played a role in successful commercialization in 2014 was just 3.8 percent, discouraging high-performing staff from working in KTOs. The average annual wage of KTO staff in 2014 was about KRW 34 million (less than USD 30,000), close to the national average wage and clearly insufficient to attract high-quality workers. Only 20 percent of KTOs hire professional staff such as patent lawyers.
Weak incentives for staff at KTOs are related to strong incentives for researchers. The Technology Transfer and Commercialization Promotion Act requires a minimum share of license income for researchers of 50 percent. The actual average share of license income going to researchers across public research institutes was 40.8 percent in 2014 (KIAT 2016), but this is greater than in advanced countries such as the U.S. and Germany. It seems that the government is trying to compensate researchers generously because the system for knowledge transfer remains immature, but one consequence is that little or no license income is available for KTO staff and so they have few incentives to conclude licensing deals.
The problem of weak KTO capability is exacerbated by the fact that few public research organizations are willing to provide the knowledge transfer market with high-quality technologies. Instead they prefer to commercialize their best technologies directly using their KTOs. Nevertheless, the capability of most KTOs at public research organizations is weak, except at ETRI and some leading public research institutes. Thus, public research organizations are not in a good position to fully utilize or commercialize high-quality technologies generated in-house, which decreases the efficiency of the knowledge transfer market. One private knowledge transfer agent identified this as a major problem in the Republic of Korea.Footnote 11
The weak capability of KTOs is mainly due to the Republic of Korea’s short historyFootnote 12 of knowledge transfer and commercialization. The government mandated many public research organizations to establish KTOs in the early 2000s, but it takes time for these KTOs to build capability. During this period, the government should have set up systems whereby private agents could use and commercialize high-quality technologies developed by public research organizations, but these policies are yet to be realized. Thus, this problem is one side effect of the government-driven character of the knowledge transfer system.
Weak KTO capability is related to a third challenge, which concerns the quality of patents. As KTO capability is weak, it is difficult to generate high-quality patents even when high-quality technologies exist. In particular, professionals such as patent lawyers make up only a small proportion of KTO staff, so public research organizations cannot obtain high-quality services during the patent application process. Even when public research organizations sign contracts with external professional staff for patent applications, their budget is very small compared to R&D expenses and, as such, it is difficult to obtain good services. Most interviewees said the budget per patent draft has stagnated – it has remained at about KRW 0.5–1 million (less than USD 1,000) per patent for the last twenty years. This is a very small budget compared to that in the leading global firms, which is about KRW 10 million. One interviewee argued that the budget for drafting each patent application should increase to as much as KRW 5 million – five to ten times the current level.Footnote 13
6.6 Summary and Concluding Remarks
Public research institutes played a significant role in economic catch-up in the Republic of Korea by importing and assimilating foreign technologies and knowledge in the 1970s and early 1980s, and by initiating public–private joint R&D since the late 1980s and 1990s. Universities remained less active in this catch-up process until the 2000s. One of the reasons the Republic of Korea was late in enacting its own version of the Bayh-Dole Act, in comparison to South Africa or Brazil, was the dominance of businesses possessing higher levels of technological capabilities and thus demanding and expecting less from universities. Moreover, these big firms used to collaborate more with government research institutes than with universities.
Since the 2000s, knowledge transfer from universities and public research institutes and its commercialization have become a top policy issue in the Republic of Korea, as the country’s technology level converges with that of advanced countries and its economy tries to switch to more science-based or long-cycle-based technology fields (Reference LeeLee 2013). The Technology Transfer Promotion Act 2000 led to an increase in some quantitative measures of knowledge transfer such as patent applications, and the number of knowledge transfer contracts with public research institutes increased markedly. However, other measures such as the ratio of license income to R&D expenses did not increase, and average license income per transferred technology fell. The government’s emphasis, until recently, on quantitative measures such as patent applications led to a rapid increase in patent applications by public research organizations, but also caused the quality of patents to fall.
The main channels for knowledge transfer in the Republic of Korea still show some differences from those in advanced countries. The major channels are collaborative/contract-based R&D between firms and public research organizations funded by firms, which implies no change from the situation in the 1990s as described in Reference Eom and LeeEom and Lee (2010). Informal channels, IP licensing and startups are all minor channels. Our research identifies as one of the most serious problems the fact that the research outputs of public research organizations do not meet the needs of firms, especially SMEs, which have low levels of absorptive capacity. Furthermore, the typical Korean firm still prefers in-house R&D to licensing from public research organizations. When firms work with public research organizations, they prefer joint/collaborative R&D to IP licensing.
Since 2000, the government has tried to “create” a knowledge transfer market and initiated various polices and projects. The government forced many public research organizations to have their own KTOs in the early 2000s, but their capability remains weak and the incentive system for them is not strong. In particular, the fees paid to patent attorneys for writing and preparing patent application documents have generally been too low at just KRW 0.5–1 million per patent for the last two decades, making it very difficult to produce high-quality patents. This problem means that even high-quality inventions and technologies tend to be either undersold or not sold at all in IP markets. As such, and given the abundance of low-quality patents from universities, the typical perception of private firms is that patents and technologies from universities are of low quality and not easily commercialized. Thus, domestic firms have little interest in obtaining licenses or patents from universities and public research institutes. A low level of domestic IPR protection is another reason for this attitude; damages in IP disputes tend to be far lower than in advanced countries. The knowledge transfer system remains immature and some of the legacies from the early “developmental state regime” hinders further development of the knowledge transfer market.
Government policy mandating all public research organizations to have a KTO had several adverse effects. The KTOs ended up being small and lacking sufficient resources. Although they had initial monopoly rights in the research outcomes of their organization, these were often underutilized. This problem of monopoly and related underutilization is more serious in universities than in research institutes. If the patenting and marketing activities for university research outcomes were more open to capable private agents, rather than being monopolized by university KTOs, there could have been more successful knowledge transfer. Instead, the KTOs’ monopoly has depressed the private knowledge transfer market. The government responded by giving higher shares of license-related income to individual researchers, to strengthen their incentives to commercialize their work, but this reduced the incentives available to KTO staff.
In sum, it can be said that the national innovation system in the Republic of Korea has found it difficult to change from the old catch-up mode characterized by the twin dominance of big businesses and the government. Several important factors for successful knowledge transfer from public research organizations, as identified in the literature, are undeveloped in the Republic of Korea: the importance of demand-oriented research, monetary incentives for researchers in terms of license income, sufficient weight on knowledge transfer outcomes in the performance evaluation of researchers, and high-quality personnel for KTOs. These are all areas where the Korean system should try to improve to move beyond the catch-up stage.
7.1 Introduction
It is widely recognized that the knowledge production of universities and research institutions is one of the foundations of economic development. The experiences of countries such as Japan, the Republic of Korea, the United States of America (U.S.), and, more recently, China have shown that successful development results from a combination of good policies, a sound research and education infrastructure, and productive interaction between that infrastructure and enterprises.
Brazil does not have a strong tradition of interaction between universities/public research institutes and businesses, but the situation has changed greatly in recent years. The lack of interaction used to be one of the most frequently noted characteristics of the Brazilian innovation system. Reference SutzSutz (2000), for instance, observed a very low level of contact between the country’s universities and companies. Data consolidated by Reference De NegriDe Negri et al. (2009) show that only 14 percent of all research projects supported by the main source of public funding for science and technology (S&T) in Brazil, the so-called Sectoral Funds, counted companies among the beneficiaries. Although these projects represent around 35 percent of the resources invested by the Sectoral Funds, that is probably not enough since the aim of the Funds is to support innovation.
However, there has been a notable increase in efforts to support innovation and facilitate interaction among universities, researchers, research institutions, and companies in Brazil in recent years. The 2000s witnessed the creation of several policies that transformed the scenario for innovation in Brazil. From new policies to support R&D investments by companies to a new regulatory framework for university–industry interaction, several initiatives were implemented during this period. And several new pieces of evidence suggest that these policies probably did increase the level of interaction between universities and companies.
This chapter aims to analyze the conditions and policies framing the interaction between public research institutes and universities and the business sector in Brazil. Our analysis is based on: (1) a review of the scholarly literature and Brazilian legislation regarding innovation policies and university–industry interactions; (2) data on IP and related indicators in official Brazilian government reports; (3) information gathered through questionnaires sent to eighteen Brazilian universities and research institutions; and (4) in-depth interviews with four selected Brazilian knowledge transfer offices (KTOs).
The chapter is composed of five sections including this introduction. The second section briefly reviews the key literature on knowledge transfer in Brazil. The third section gives an overview of the historical role of universities and public research institutes in the Brazilian innovation system as well as the main policy instruments and mechanisms in relation to science, technology, and innovation. Section 7.4 analyzes the main policies and practices adopted by institutions and companies for knowledge transfer in the country, while the fifth and final section presents our concluding remarks.
7.2 The Literature on University–Industry Relations in Brazil
University–industry interactions are considered an important element of any national innovation system (NIS) as they are one of the engines of technological progress and of competence building at the regional and national levels (Reference Chaves, Rapini, Suzigan, Fernandes, Domingues and Martins CarvalhoChaves et al. 2015). In Brazil, the view is often advanced that academia is too remote from the needs of industry.
Reference AlbuquerqueAlbuquerque (1999), for instance, argues that the channels of knowledge transfer are weak in Brazil, impairing the frequency and quality of university–industry interactions in the country. A combination of two main factors may explain the weakness of knowledge transfer mechanisms in Brazil: the historical backwardness of Brazilian industrialization and the relatively late creation of universities and research institutes in comparison with developed countries (Reference Suzigan, Albuquerque, Suzigan, Albuquerque and CarioSuzigan and Albuquerque 2011).
Several authors have sought to explain the low level of interaction between universities/public research institutes and business. Reference Rapini, Albuquerque, Chaves, Silva, Souza, Righi and CruzRapini et al. (2009) argue that it reflects a poor pattern of demand from industry. Indeed, Reference Britto, Dos Santos, Kruss and AlbuquerqueBritto et al. (2015) show that, in comparison with other countries, the majority of Brazilian companies – especially the internationalized ones – still do not look to universities to establish any kind of knowledge transfer in order to promote their innovative activities.
Reference Dutrénit, Arza, Albuquerque, Suzigan, Kruss and LeeDutrénit and Arza (2015) argue that although linkages between universities and firms in Brazil are fragile, there have been successful cases of knowledge transfer, including in the steel, petrochemicals, aircraft, and agro-industry sectors. But despite these success stories, Brazilian NIS is lagging behind other countries, since there remains a mismatch between the scientific side of the system and its productive structure.
Recently, several authors have argued that the level of university–industry partnership has increased, based on new data from several sources. Reference Brito CruzBrito Cruz (2015), for instance, found that the volume of research revenues flowing from companies to some universities in São Paulo was similar to the average for US universities (around 5 percent of their research revenues). Reference De Negri and SqueffDe Negri and Squeff (2016) also found that around 43 percent of Brazilian laboratories and research facilities among a sample of almost 2,000 said they provided some sort of services to companies.
Several studies have focused on other aspects of university–industry interactions, such as the main channels and kinds of knowledge transfer, the main technology areas of transfer, patent statistics, firm profiles, and the overall incentives and barriers to cooperation.
Reference PóvoaPóvoa (2008) identified that the vast majority of Brazilian knowledge transfer occurs in areas related to engineering and agrarian sciences (70 percent), and that the companies that received most of the technology generated by universities and public research institutes belong to what he called the “processing industry” sector (47.1 percent) – mainly the manufacturing of food products, chemical products, and machinery and equipment.
A survey by Reference Chaves, Rapini, Suzigan, Fernandes, Domingues and Martins CarvalhoChaves et al. (2015) of 1,005 research group leaders at Brazilian universities showed that firms do not usually seek interactions with these institutions in order to obtain high-level research and experimental development. According to them, the most common channels of knowledge transfer from universities to firms are training of human resources, consulting activities, and the provision of routine services such as measuring, testing, and quality control. Patents and other institutional knowledge exchange channels such as incubators and technology parks still seem to feature rarely in knowledge exchange between universities/public research institutes and firms.
In fact, as observed by Reference LiveseyLivesey (2014), the belief that patenting is the best way to transfer new knowledge from universities to companies is no longer dominant in Brazil, since other routes including spinouts and consultancy are also now highly regarded.
Based on a survey of 178 leaders of research groups affiliated to Brazilian universities and public research institutes, Reference PóvoaPóvoa (2008) also established that the main channels for knowledge transfer in Brazil are informal. In fact, more than 70 percent of knowledge transfers are based on “publications and reports,” 46.5 percent are based on “informal exchange of information,” 43.5 percent on “training and consulting,” and only 13.7 percent on “patents and licensing.” This emphasis on informal channels has also been observed in many developed countries (Reference Mowery, Nelson, Sampat and ZiedonisMowery et al. 2004).
The same results were reached by Reference de Castro, da Silva Teixeira and de Limade Castro et al. (2014) through a survey applied to 314 Brazilian firms that had already established channels for knowledge transfer with universities and public research institutes. The majority of respondent firms said that the most important knowledge transfer channels for their innovation activities were informal, including publications and reports (68.9 percent), informal information exchanges (62.4 percent), and conferences and seminars (61.1 percent). Fewer companies (33 percent) considered licensing an important channel to foster innovation.
Reference Póvoa and RapiniPóvoa and Rapini (2010) have shown that, as might be expected, the type of transfer channel varies according to the type of knowledge transferred. Patents showed a high correlation with the transfer of knowledge aimed at obtaining new products, equipment, prototypes, and materials. However, mechanisms such as consulting and hiring of personnel were more correlated with new processes and techniques. This analysis corroborates the conclusions of Reference PóvoaPóvoa (2008), who found that the main kinds of technology transferred by universities and public research institutes to companies were new processes (44.6 percent), new techniques (43.5 percent), and new products (28.4 percent).
The results of the studies presented here confirm that, in Brazil, patenting is not the most relevant type of knowledge transfer between universities/public research institutes and enterprises, and that informal channels as well as the regular forms of “open science” are more important than formal ones. Reference PóvoaPóvoa (2008) showed that the only enterprises able to manage formal mechanisms of knowledge transfer such as patents were those with a pre-established capacity to absorb these technologies, for example R&D departments and well-trained personnel, and most Brazilian companies lack such capacity.
Reference de Castro, da Silva Teixeira and de LimaDe Castro et al. (2014) also argue that patenting is not an important knowledge transfer channel in Brazil due to firms’ low capacity to absorb this kind of knowledge. They believe that firms prefer to access cheaper kinds of knowledge such as knowledge in the public domain (e.g., seminars and reports) as well as forms of collaborative research that could complement their relatively weak R&D.
By way of contrast, Reference Dos Santos, Toledo and LotufoDos Santos et al. (2009) emphasize the importance of KTOs associated with universities and public research institute in guaranteeing the professionalization and success of the transfer of knowledge and technologies between these organizations and interested companies.
The Brazilian literature on knowledge transfer also emphasizes the importance of implementing policies to encourage a strong patenting culture in universities and public research institutes. Reference PóvoaPóvoa (2008), for instance, showed that between 1999 and 2003, the top fifty patent applicants in Brazil included eight Brazilian universities and four Brazilian public research institutes – accounting for nearly one-quarter of those top applicants. The main technological domains in which universities and public research institutes patented during this period were measurement and control (14.2 percent), organic chemistry (9.3 percent), and biotechnology (7.5 percent), which Póvoa saw as demonstrating a significant contribution of universities to “science-based” sectors.
Póvoa also showed that between 1996 and 2004, the total number of university patent applications increased by about 700 percent. He thinks this rise is in large part attributable to the introduction of the Industrial Property Law in 1996 (Brasil 1996), which brought significant changes to patenting activities in Brazil. In addition to expanding the range of patentable inventions, the Law allowed researchers to share in the economic gains derived from the exploitation of university patents.
Some scholars believe that the Brazilian Innovation Act 2004 (Brasil 2004) also spurred the increase in patenting activities by universities and public research institutes, especially by formalizing the KTOs associated with these institutions, charged, among other things, with managing patenting activities. According to Reference Pereira and MelloPereira and Mello (2015), the main reason for the increase in the number of patenting activities by universities in recent decades is the professionalization of the industrial property management carried out by the KTOs.
On the other hand, a survey of thirty-three Brazilian KTOs by Reference LiveseyLivesey (2014) revealed that they tended to be small structures with just seven staff on average, only two of whom have advanced degrees and one of whom is an IP specialist. Less than one-third (29 percent) of the KTOs surveyed believed they had the technical skills required to manage knowledge transfer, compared to nearly half (45 percent) who did not. The largest deficit was found in commercial skills, with only 13 percent of respondents saying they had the necessary skills in this area to be effective.
Reference LiveseyLivesey (2014) considers that KTOs should be more integrated into universities in order to better perform knowledge transfer to enterprises. In fact, his study showed that KTOs felt marginalized and disconnected from the organizations they were trying to serve. Over half of respondents (54 percent) did not believe they had the necessary support and funding, and nearly two-thirds (63 percent) did not believe that knowledge transfer was an established part of their university’s strategy.
The confidence of KTOs that they had the skills required to manage technology varied by region. Livesey’s survey revealed that, while only 20 percent of KTOs in the northeast of the country believed they had the necessary legal skills, this figure reached 60 percent among KTOs in the southeast and almost 40 percent among those in the south. In relation to technical skills, none of the northeastern respondents thought they had the necessary skills to manage knowledge transfer, whereas almost 40 percent of their southern counterparts and 20 percent of those in the southeast expressed confidence. Finally, regarding commercial skills, KTOs from the southeast showed the lowest level of confidence (10 percent), followed by those from the south (over 10 percent), and the northeast (20 percent).
Regional differences are also noticeable as regards KTOs’ preferred knowledge transfer routes. Broadening the discussion on knowledge transfer from licensing and consulting, Reference LiveseyLivesey (2014) found that half the KTOs in the south agreed that spinouts were the best way to transfer a technology, whereas those from the northeast and southeast were less likely to endorse this view (20 percent and 30 percent, respectively). Livesey noted that his survey showed that the south was also the region with the largest number of links to venture capital.
Regarding patenting activity, Reference Pinheiro-Machado and OliveiraPinheiro-Machado and Oliveira (2004) revealed that patenting by Brazilian universities increased twice as quickly as in US universities in the period 1990–2001. However, they argued that the performance of Brazil’s universities was impaired by poor performance on the part of the KTOs: “[A] significant fraction of Brazilian academic patent applications remains abandoned due to the lack of specialized staff to help in writing and to shepherd the application through the patenting process in universities.”
Along with the launch of the Industrial Property Law (1996) and the Innovation Act (2004), Reference Chaves, Rapini, Suzigan, Fernandes, Domingues and Martins CarvalhoChaves et al. (2015) consider that the Brazilian government has implemented other important measures to stimulate university–industry interactions since the mid-1990s, including the establishment of new lines of S&T funding such as the above-mentioned Sectoral Funds and the use of tax breaks for firms that propose joint R&D projects with universities and public research institutes.
Undeniably, these institutional changes have become important mechanisms to encourage patenting activities by Brazilian universities, as observed in statistics for recent decades and in the results of the interviews presented in Section 7.4. But while the performance of universities and public research institutes in recent years represents a remarkable achievement of Brazilian S&T and industrial policies, Reference Albuquerque, Viotti and MacedoAlbuquerque (2003) argues that the relative strength of these institutions in patenting activities exposes the comparative fragility of Brazil’s industrial structure, especially as regards business investment in R&D activities.
According to Reference PóvoaPóvoa (2008), patents owned jointly by universities and companies represented around 6 percent of patent applications by universities in the period 1979–2004. While this proportion may seem small, it is close to that observed in several European countries in the period 1978–2002: 11.5 percent in the case of German universities, 10.2 percent in the case of French universities, and 9.4 percent in the case of UK universities (Ruiz 2005, cited in Reference PóvoaPóvoa 2008).
Reference PóvoaPóvoa (2008) also showed that most of the patents jointly owned by Brazilian universities in this period were deposited by three universities based in São Paulo State: USP (thirteen joint-ownership patents), Unicamp (twelve), and Universidade Federal de São Carlos (UFSCar) (eleven). The main technological fields for joint patenting were optical technologies and telecommunications. Petrobrás was the company with the largest number of patent applications made jointly with universities in the period.
An analysis of patent filings by public universities in São Paulo State from 1995 to 2006 by Reference Amadei and TorkomianAmadei and Torkomian (2009) confirms that the number of joint filings was not significant. According to them, during this period the universities were the sole patent holders of more than 80 percent of their total filings. They argue that given the considerable contribution made by the patent indicators in the construction of national innovation policy, there is a need for a more user-friendly national patent database with the possibility to consult more up-to-date indicators integrated with existing ones to help interested firms identify the technologies available at universities.
These statistics represent the evolution of an important formal channel of knowledge transfer in the last decades, but as noted earlier, not all kinds of knowledge transfer from universities to companies result in an attempt to obtain a new invention. According to Reference RapiniRapini (2007), such formal transfers represent only a small portion of the possible university–industry interaction: “[N]ot every invention is patentable or patented.”
Curiously, in spite of what is traditionally expected from this kind of interaction, Reference PóvoaPóvoa (2008) showed that in Brazil, a significant number of the knowledge transfers analyzed (slightly more than one-third) were motivated by the leaders of universities’ research groups interested in private funding opportunities for new lines of research.
Reference PóvoaPóvoa (2008) also showed that universities, as opposed to public research institutes, were responsible for 88.1 percent of the total number of technologies transferred to enterprises. The only area in which the public research institutes stood out was agronomy, which accounted for 24 percent of all knowledge transfers, especially due to the prominent role of Embrapa in national agronomy research.
Reference TellesTelles (2011) identified that public research institutes were responsible for presenting new applied research to companies. In the cases he analyzed, it was public research institutes that proposed new technological projects to companies as well as financing many project expenses using their own resources. Public research institutes thus also emerge as institutions inducing knowledge transfer in Brazil. Telles attributes the proactivity of the public research institutes in their interactions with firms to the fact that governments usually use these institutes as an instrument to promote the development of specific national sectors.
But while universities and public research institutes are responsible for determining the research agenda for cooperation with companies, according to Reference Porto, Kannebley Júnior, Selan and BaroniPorto et al. (2011), most university–business interaction in Brazil is focused on short- and medium-term technological development aimed at solving firms’ technological problems.
In fact, university and industry partners express divergent interests and perceptions about their interaction and relationship. Bearing this in mind, Reference Closs and FerreiraCloss and Ferreira (2012) aimed to identify the factors that facilitate university–industry interactions in Brazil and those that jeopardize them. From a review of the literature on knowledge transfer in Brazil from 2005 to 2009, they concluded that among the motivations for university–industry cooperation, the ones related to financial resources stand out. On the one hand, universities increasingly need private resources to finance new areas of research in the face of a reduction of public resources in recent decades. On the other hand, firms want to save costs in implementing new technologies by accessing infrastructure and professional consultancy provided by universities.
The importance of cost concerns in motivating university–industry cooperation is also corroborated by Reference Porto, Kannebley Júnior, Selan and BaroniPorto et al. (2011), who analyzed information from 2,623 Brazilian companies and 1,663 research groups – distributed in 193 research organizations (universities and public research institutes) – that carried out joint technology projects in 2003 and 2004. According to the authors: “[T]he increase in R&D spending by companies and research institutes leads to the search for cost dilution instruments and, consequently, encourages cooperation between companies and universities.”
Reference Rauen, Turchi and TurchiRauen and Turchi (2017) found that access to public funding is important to stimulate companies to look for university cooperation. As will be discussed in Section 7.4, they found that there is a seasonal component in the companies’ demand for support from public research organizations which correlates with the periods in which development agencies publish funding notices.
As regards barriers to the promotion of university–industry interactions, Reference Rapini, Albuquerque, Chaves, Silva, Souza, Righi and CruzRapini et al. (2009) emphasize some noted above, such as excessive bureaucracy and legal uncertainty, difficulties in establishing contractual agreements with firms, and a lack of staff with specialized knowledge transfer skills.
The studies analyzed by Reference Closs and FerreiraCloss and Ferreira (2012) highlighted a range of problem factors from the firms’ point of view, such as legal uncertainty and excessive bureaucracy, noncompliance with project deadlines, a lack of information security, and a lack of project management skills. From the universities’ point of view, challenges included the need to establish reward mechanisms for researchers and teachers to engage in projects with firms, excessive university bureaucracy, backwardness in the execution of contracts or the registration of patents, and the fact that the evaluation of researchers and teachers is still based on their record of scientific publication, not on patents or any other kind of knowledge transfer to firms.
7.3 The Role of Universities and Public Research Institutes in the Brazilian Innovation System
As noted earlier, Brazil has undertaken several actions and introduced new policies to reinforce its scientific and innovative capacity over the last two decades. One of the most important policies was the creation of the Sectoral Funds in 1999, to be operated and managed by the innovation agency Finep. The Sectoral Funds were designed to have several different revenue sources in order to ensure stable long-term public funding for S&T. These revenues included a share of royalties from the oil sector, a special levy on gas and other sector-specific taxes. At the time they were introduced, instability was considered one of the most serious problems in S&T funding in Brazil, and the creation of the Sectoral Funds was seen as a promising attempt to overcome this challenge.
Besides assuring stable S&T funding, the Funds were also intended to foster innovation in the Brazilian economy, focusing on research projects related to technological challenges in specific sectors. This objective was prompted by the low level of interaction between universities, research institutions, and the country’s productive industry. The revenues of each fund were intended to support R&D related to the sector for which that fund was created. These sectors include oil, mining, health, infrastructure, agriculture, aeronautics, biotechnology, information, and communication, and there are also funds designed to foster cross-sectional projects and research facilities.
In the early 2000s, growing recognition of the economic importance of innovation resulted in a series of new policies intended to create incentives for R&D investments and a more up-to-date framework for S&T and innovation. The Innovation Act (Law no. 10,973 of 2004) was introduced to improve the innovation system and empower linkages between different actors. One of the major breakthroughs of the Act was the possibility for the government to provide grantsFootnote 1 to companies for investments in innovation, which was not previously allowed under Brazilian law. The Act also established a clear regulatory framework for the interaction between universities/public research institutes and companies, and for the IP rights arising from such interaction.
Finally, in 2005 the so-called Good Law (Lei do Bem, Law no. 11.196, of 2005) implemented tax breaks for firms that invest in R&D in the country. Such tax incentives could reach up to half the total amount invested in R&D by companies.
Both the Innovation Act and the Good Law were implemented in the context of the first industrial policy of President Lula’s government in 2003: the PITCE (Industrial, Technological, and Foreign Trade Policy). After the PITCE, two new editions of this industrial policy were launched: the Productive Development Policy in 2008 and the Greater Brazil Plan in 2010, right after the global financial crisis. In these two last versions, the main measure adopted to encourage innovation was the Innovate Company Program (Programa Inova Empresa), introduced within the Greater Brazil Plan (Plano Brasil Maior), taking advantage of a small share of the resources meant for the Investment Maintenance Program (PSI).
These various new policies together created a relatively comprehensive framework of innovation policies in terms of the diversity of instruments (see Table 7.1). Currently, the country can count on many of the instruments used in most of the developed world to foster innovation, such as subsidized credit/loans,Footnote 2 tax incentives, grants for companies, and grants for research projects and individuals at universities and research centers, among others.
| Policies and instruments | Value in 2012 (current BRL) | Current USD (USD 1 = R$1.95) | |
|---|---|---|---|
| Tax incentives for innovation | 6,423 | 3,294 | |
| Public credit/loans for innovation (disbursements in the year) | Finep | 1,800 | 923 |
| BNDES | 2,200 | 1,128 | |
| Total (public credit) | 4,000 | 2,051 | |
| Public investments in S&T | States (excluding postgraduate programs) | 7,034 | 3,607 |
| Federal government (excluding postgraduate programs) | 18,388 | 9,430 | |
| Total (excluding postgraduate programs) | 25,422 | 13,037 | |
| Total (with postgraduate programs) | 40,045 | 20,536 |
Regarding direct public investments in S&T, according to the Brazilian Ministry of Science, Technology, and Innovation,Footnote 3 in 2012 the Brazilian public sector (federal and subnational governments) spent around BRL 40 billion (around USD 20 billion) on science and technology. About 40 percent of the S&T public investment is attached at maintaining postgraduate courses and institutions at federal and state levels. Of the remaining BRL 25 billion (USD 13 billion), about BRL 18 billion (or USD 9.4 billion) was invested by the federal government.
An important share of public S&T investment is devoted to building and maintaining the country’s research infrastructure and facilities. In the last few years, Brazil’s S&T infrastructure has received substantial resources from several sources, notably the Infrastructure Sectoral Fund, also known as CT-Infra.Footnote 4 Significant resources have also been provided under the Coordination for the Improvement of Higher Education Personnel (Capes) program of the Ministry of Education (MEC), by state foundations that support research, and by companies such as Petrobrás (Reference De Negri, Cavalcante and AlvesDe Negri, Cavalcante, and Alves 2015).
In fact, it is safe to say that the country’s research infrastructureFootnote 5 is now much more up to date than it was few years ago. Reference De Negri and SqueffDe Negri and Squeff (2016) show that most laboratories and research facilities (56.7 percent) began operation since 2000 (Table 7.2) and argue that this fact could be related to an increase in investments in science, technology, and innovation from the middle of the 2000s until 2014.Footnote 6 The authors conducted a survey with around 2,000 researchers in charge of research laboratories at Brazilian universities and research institutions in 2012. More than 70 percent of respondents said they had received significant investments in the five years preceding the survey, and many reported significant investment within the past year.
Table 7.2 Number of research infrastructures in Brazil by launch period
| Period | Number of infrastructures launched | Number of infrastructures launched as a share of all infrastructures (%) |
|---|---|---|
| Pre-1970 | 50 | 2.8 |
| 1970–9 | 110 | 6.3 |
| 1980–9 | 193 | 11.0 |
| 1990–9 | 410 | 23.3 |
| 2000–9 | 654 | 37.2 |
| 2010–12 | 343 | 19.5 |
| Total | 1,760 | 100 |
However, according to Reference De Negri and SqueffDe Negri and Squeff (2016), most of the research facilities in Brazil are small laboratories scattered across the departments of the big Brazilian universities. Although the country has some important research institutions, they are few and most of them are small when compared to the national laboratories or similar large scientific facilities of some other countries. There are 7,090 researchers working in Brazil’s 1,760 research infrastructures, an average of just four per laboratory.
Brazil has more than 2,300 higher education institutions, including universities, schools, and federal institutes, as well as several research centers. While there are roughly as many private education institutes as public ones, the importance of the latter in science and technology production is much greater than that of the former.
The number of higher education institutions has grown sharply over the last decade, from fewer than 1,400 in 2000. Between 2000 and 2013, the Brazilian federal government and the states created eighty-nine new higher education institutions, mostly research or technical universities – growth of more than 150 percent in the number of public institutions within fifteen years.
Table 7.3 Number of universities, research universities, and federal technological institutions in Brazil in 2015
| Research universities* | Universities (university centers) | Federal technological institutions | Total | |
|---|---|---|---|---|
| Federal institutions | 63 | 40 | 103 | |
| State institutions | 38 | 1 | 39 | |
| Municipal institutions | 6 | 8 | 14 | |
| Private institutions | 88 | 140 | 228 | |
| Total | 195 | 149 | 40 | 384 |
* Research universities are universities obliged to perform research and some sort of social activities as well as teaching. The universities (in Portuguese, “university centers”) are not obliged to perform research, and there are also 1,980 colleges in Brazil (not listed in the table) which teach but do not research. The federal technological institutions focus on professional and technological education.
It is widely recognized in Brazil that the most relevant research universities in the country are public, although the number of good private universities is believed to have grown in recent decades. Among the country’s higher education institutions, 193 can be considered research universities, most of which are federal or state ones. The private sector is mostly present in colleges and in so-called university centers, where there is no obligation to perform scientific research.
To identify the biggest public research universities in the country, Table 7.4 shows the amount of R&D investments performed by these institutions. The three biggest universities in São Paulo are responsible alone for more than half of all R&D investment by the country’s fifteen biggest public research universities. The University of São Paulo, besides being Brazil’s biggest university in terms of budget, is also its main university in terms of academic publications as well as the best placed in several national and world rankings.
Table 7.4 R&D investment by the main public universities in Brazil in 2012
| Name | R&D investments (USD million)* | Ownership | State | |
|---|---|---|---|---|
| USP | Universidade de São Paulo | 1,715.71 | State | SP |
| UNICAMP | Universidade Estadual de Campinas | 634.59 | State | SP |
| UNESP | Universidade Estadual Paulista “Júlio de Mesquita Filho” | 415.31 | State | SP |
| UFRJ | Universidade Federal do Rio de Janeiro | 371.48 | Federal | RJ |
| UFMG | Universidade Federal de Minas Gerais | 251.58 | Federal | MG |
| UNB | Universidade de Brasília | 235.89 | Federal | DF |
| UFRGS | Universidade Federal do Rio Grande do Sul | 224.63 | Federal | RS |
| UFSC | Universidade Federal de Santa Catarina | 191.23 | Federal | SC |
| UNIFESP | Universidade Federal de São Paulo | 177.42 | Federal | SP |
| UFC | Universidade Federal do Ceará | 136.05 | Federal | CE |
| UFPE | Universidade Federal de Pernambuco | 126.79 | Federal | PE |
| UERJ | Universidade do Estado do Rio de Janeiro | 125.97 | State | RJ |
| UFPR | Universidade Federal do Paraná | 125.30 | Federal | PR |
| UFF | Universidade Federal Fluminense | 116.93 | Federal | RJ |
| UFBA | Universidade Federal da Bahia | 103.27 | Federal | BA |
* Exchange rate: R$/USD = 2.04, 31/12/2012.
Public research institutes also play a very important role in the Brazilian S&T system and the biggest ones, based on their budget information in 2014, are shown in Table 7.5. The two biggest are also the most important public research institutes in the country. The Oswaldo Cruz Foundation is a public research institution attached to the Ministry of Health and is responsible for a range of activities such as R&D, production of vaccines and drugs, education and training, hospital care services, and quality control of products and services. The institution was created in 1900 and today has over 11,000 employees and health professionals.
| Public research institute | Budget/revenues (USD thousands) |
|---|---|
| Oswaldo Cruz Foundation (Fiocruz) (1) | 1,609,803 |
| Brazilian Agriculture Research Corporation (Embrapa) | 1,076,427 |
| Butantan Institute | 411,370 |
| Brazilian Center for Research in Energy and Materials (CNPEM)(2) | 78,631 |
| IPT – Institute for Technological Research(3) | 63,712 |
| National Institute for Pure and Applied Mathematics (IMPA) | 42,580 |
| National Institute for Space Research (INPE) | 40,909 |
| Center for Natural Disaster Monitoring and Alert (CEMADEN) | 31,420 |
| National Institute for Amazonian Research (INPA) | 13,989 |
About half this budget is not spent on R&D.
(1) Includes not only research but also teaching and manufacturing of medicines.
(2) Data from 2015 (exchange rate BRL/USD = 2.65). Includes the budget for investment in a new synchrotron light source (around USD 31 million in 2015) and other special projects. The normal budget for the institution is around USD 30 million.
(3) Includes the baseline public budget (about 35 percent) and revenues from technological services (65 percent).
The Brazilian Agriculture Research Corporation (Embrapa) is also very important within the Brazilian innovation system. Embrapa is a public company created in 1973 under the stewardship of the Ministry of Agriculture with the objective of developing science and technology applied to the Brazilian farming sector. Today, it has more than 9,000 employees and about 2,400 researchers working in more than sixty units around the country.
The Butantan Institute (Instituto Butantan), created in 1901, is linked to the State of São Paulo. Today, the Institute is the main producer of immunobiologicals in Brazil and responsible for a big share of the national production of vaccines and hyperimmune serums used by the Brazilian Ministry of Health. Besides producing immunobiologicals, the Butantan Institute also maintains zoological scientific collections and performs basic and applied research on venomous animals and pathogenic agents, and the production and control of immunobiological products. The Institute is currently involved in the research and development of a vaccine for Dengue fever and the Zika virus. Last, it offers graduate courses in its areas of expertise.
The Brazilian Center for Research in Energy and Materials (CNPEM) is a quasi-public organization, very similar to the federally owned and privately operated National Laboratories in the U.S. It is linked to the Ministry of Science, Technology, Innovation, and CommunicationsFootnote 7 (MCTIC) and has seventy-five in-house researchers. The facilities of CNPEM were used by almost 2,000 researchers in 2014. Probably the most used facility is the synchrotron light source, which is used by researchers from all over the country as well as other countries. MCTIC has other quasi-public research organizations attached to it, for instance the National Institute for Pure and Applied Mathematics (IMPA) and the National Education and Research Network (RNP).
The organizations mentioned above – universities and public research institutes – are the most important research institutions in the country and are responsible for a large share of Brazilian scientific publications, as one can see in the Scimago ranking of Brazilian universities and research institutions.
The public universities and research institutions are also very relevant in terms of patenting. By way of context, in Brazil, as in other middle-income countries, most patent applications come from non-residents (80 percent).Footnote 8 Applications from residents are distributed almost equally among private individuals – independent inventors, university researchers, and professors, and so on – and institutions, comprising companies including foreign-owned subsidiaries, universities, public and private research institutions, nonprofit organizations, and so on.
The institutions account for around 10 percent of total patent applications, of which around 30 percent are filed by the public sector or by teaching or research institutions. Indeed, Brazilian universities and research institutions have increased their share of patent applications to the National Institute of Industrial Property (INPI) sharply, from 0.6 percent in 2000 to 2.7 percent in 2012 (Table 7.6).
Table 7.6 Number of patents filed by Brazilian universities and research institutions at the National Institute of Industrial Property, 2000–12
| University/institution | 2000 | 2002 | 2004 | 2006 | 2008 | 2010 | 2012 |
|---|---|---|---|---|---|---|---|
| Universidade Estadual de Campinas – UNICAMP | 36 | 55 | 49 | 53 | 48 | 45 | 67 |
| Universidade de São Paulo – USP | 6 | 11 | 15 | 26 | 53 | 47 | 58 |
| Universidade Federal de Minas Gerais – UFMG | 6 | 21 | 18 | 30 | 38 | 59 | 64 |
| Universidade Federal do Rio de Janeiro – UFRJ | 2 | 23 | 24 | 14 | 29 | 27 | 16 |
| Universidade Federal do Paraná – UFPR | 1 | 1 | 7 | 12 | 17 | 21 | 68 |
| Universidade Federal do Rio Grande do Sul – UFRGS | 5 | 11 | 10 | 4 | 9 | 23 | 30 |
| Serviço Nacional de Aprendizagem Industrial – SENAI | 1 | 0 | 2 | 1 | 3 | 20 | 20 |
| Fundação Universidade de Brasília – UNB | 2 | 0 | 4 | 4 | 7 | 6 | 21 |
| Universidade Federal da Bahia – UFBA | 0 | 0 | 0 | 0 | 4 | 16 | 22 |
| Universidade Federal de Pelotas – UFPEL | 0 | 0 | 1 | 1 | 1 | 0 | 17 |
| Total patent applications by universities and research institutions (A) | 115 | 219 | 264 | 318 | 440 | 590 | 904 |
| Total patents filed at INPI by residents (B) | 6,449 | 7,052 | 7,701 | 7,194 | 7,711 | 7,244 | 7808 |
| Total patents filed at INPI (C) | 20,854 | 20,334 | 20,431 | 23,152 | 26,641 | 28,099 | 33,569 |
| Universities and public research institute filings as a share of total filings (A/C) (%) | 0.6 | 1.1 | 1.3 | 1.4 | 1.7 | 2.1 | 2.7 |
| Resident filings as a share of total fiings (B/C) (%) | 31 | 35 | 38 | 31 | 29 | 26 | 23 |
| Universities and public research institute filings as a share of resident filings (A/B) (%) | 2 | 3 | 3 | 4 | 6 | 8 | 12 |
As we noted earlier, some authors argue that this growth was encouraged by the Industrial Property Law in 1996 (Reference PóvoaPóvoa 2008), particularly the possibilities it offered for researchers to share in the economic gains from patents. Others believe that the Innovation Act of 2004 is mainly responsible. Most likely, both laws as well as other, more minor institutional improvements are important in explaining the increasing role of universities and public research institutes in patenting.
In any case, one of the consequences of this growth is that the list of the twenty leading patent applicants in Brazil in 2015 featured fifteen public universities, only four companies, and one private research institution: the Telecom Research and Development Center (CPqD in the Portuguese acronym).
This once again highlights the importance of public institutions in the Brazilian innovation system. Indeed, in Table 7.6 one can see that among the ten leading universities and research institutions applying for patents in Brazil between 2000 and 2012, there is only one private research institution. The Brazilian National Service for Industrial Training (SENAI) is a nonprofit organization funded by industry organizations that originally aimed to train workers for industry. In recent years, it has become increasingly concerned with innovation, having established several research institutions across the country. As a result, it increased its number of patents filings from around two per year to around twenty per year between 2010 and 2012. According to Table 7.6, the most prominent universities in terms of patent filings are UNICAMP, USP, UFMG, UFRJ, and, more recently, UFPR. Reference Pereira and MelloPereira and Mello (2015), analyzing the period from 1979 to 2011, reached the same conclusions.
However, a large number of patents registered by universities and research institutions does not in itself prove the market value or relevance of the knowledge they produce. Many of the patents filed and registered by universities may never be transferred to companies. For instance, although Unicamp is one of the country’s major patent applicants, it has licensed only eighty-seven of its 1,000+ patents in the past two decades. At MIT, by contrast, around 40 percent of the patents obtained are licensed every year (Reference Reynolds and De NegriReynolds and De Negri, 2017).
The latest Brazilian Innovation Survey (PINTEC/IBGE 2014) reveals that only 2.3 percent of innovative firms consider interaction with universities and public research institutes, and, in particular, the existence of cooperation agreements with them, to be highly important for innovation (Table 7.7).Footnote 9 The industries that are the leading users of knowledge produced by universities and research institutions according to the Survey are: research and development (44 percent), electricity and gas services (33 percent), manufacture of computer equipment (24 percent), manufacture of chemical products (19 percent), manufacture of pharmaceutical products (18 percent), and manufacture of computer, electronic, and optical products (11 percent). Importantly, most firms that consider interaction with universities and public research institutes to be highly important belong to sectors with a medium or high technology intensity. In addition, firms from regulated sectors such as electricity and gas services must comply with rules established in the concession agreements, for example contractual R&D clauses,Footnote 10 which oblige them to invest a percentage of their revenues in R&D activities in partnership with universities and research institutes in Brazil.
Table 7.7 Firms that innovated using a cooperation agreement with a university or public research institute in 2014
| Sector | Innovative firms | Firms with cooperation agreements with other organizations | Firms that rate cooperation with universities/PROs as highly important | |
|---|---|---|---|---|
| Total | 47,693 | 7,300 | 1,098 | 2.3 percent |
| Research and development | 18 | 15 | 8 | 44 percent |
| Electricity and gas services | 137 | 75 | 45 | 33 percent |
| Manufacture of computer equipment | 156 | 72 | 38 | 24 percent |
| Manufacture of chemical products | 196 | 80 | 37 | 19 percent |
| Manufacture of pharmaceutical products | 204 | 91 | 36 | 18 percent |
| Manufacture of computer, electronic and optical products | 1,053 | 317 | 117 | 11 percent |
7.4 Policies and Institutional Practices for Knowledge Transfer in Brazil
This section is based on several interviews with researchers and KTOs and on questionnaires sent to more than ten KTOs in Brazil. The interviews and questionnaires were intended to collect information in order to identify the types of procedure and practice used by the institutions and KTOs to transfer knowledge.
7.4.1 Legal Framework
The main regulation regarding the relationship between public research institutes, universities and companies in Brazil is provided by the Innovation Act (Law no. 10,973 of 2004). This law aims to promote partnerships between such institutions and companies in order to foster innovation in the country. As regards IP rights specifically, prior to the Innovation Act, the Brazilian Intellectual Property Law approved in 1996 guaranteed that universities and public research institutes would own patents generated inside the institution.
However, the Innovation Act goes much further in regulating and fostering knowledge transfer between universities, public research institutes, and companies. For the first time in Brazil, this law allowed public institutions – public research institutes or universities – to sign knowledge transfer contracts with companies, and established some basic rules for such contracts. These include rules regarding exclusive licenses, which the original version of the Act required be preceded by an open call. Recently, the Science and Technology Act (Law no. 13.243 of 2016) has changed some of the requirements for public research institutes and universities signing exclusive agreements with companies. Exclusive agreements originating from a prior partnership with a specific company have been simplified. However, this law has also introduced a series of new requirements that reduce the autonomy of a public research institute or university in negotiating such contracts.
The emphasis of the Innovation Act on fostering knowledge transfer is revealed by seven chapters dedicated to promoting the so-called “cooperative environments of innovation.” A special role is accorded to public-based research organizations – universities and public research institutes – in the cooperative production of new technologies with firms.
To ensure such engagement, the Act sets out the specific formal channels through which universities and public research institutes are expected to support firms in the production of new technologies:
Article 4 provides for (a) sharing university and public research institute laboratories and facilities with SMEs in incubation activities, and (b) granting private companies access to laboratories, equipment and facilities for R&D activities.
Article 6 allows universities and public research institutes to sign knowledge transfer and IP licensing contracts based on technologies developed by the institution or in partnership and establishes the basic rules for those contracts.
Article 8 foresees the provision of technical services by universities and public research institutes to private firms engaged in R&D activities, such as tests, trials and calibrations, as well as technical reports.
Article 9 allows universities and public research institutes to enter into partnership agreements with firms aimed at developing new technologies together.
To encourage university and public research institute staff (mostly government researchers) to engage in such interactions, the Innovation Act states that these institutions may be financially compensated by firms for such activities, and any of their staff involved may also be financially compensated through an additional variable payment or an “innovation stimulus scholarship.”
The Act also stipulates that each research organization should establish its own knowledge transfer and innovation policies creating guidelines for entrepreneurship, innovation, knowledge transfer, and so on. Indeed, the existence of a KTO in each public research institute or university is a requirement of the Act and it sets out the basic competences of a KTO. This was controversial, since even universities with a low technology focus were obliged to establish a KTO. The requirement was relaxed recently and the law was modified to allow KTOs to be created in association with other universities or public research institutes.
The Innovation Act represented a major change in the Brazilian landscape for innovation. However, there are still a lot of improvements to be made and a lot of uncertainty regarding its application. Prompted by concerns about uncertainty, excessive bureaucracy and overlapping laws in the Brazilian legal framework for innovation, the New Science and Technology Act (Law no. 13.243 of 2016) was recently enacted to consolidate several different pieces of legislation affecting innovation. This new act aimed to promote the modernization of the legal framework as well as reducing constraints on the implementation of university–industry partnerships.
The possibilities and stimulus mechanisms established by the Innovation Act in 2004 notwithstanding, university–industry interaction remains low in Brazil. One oft-cited barrier is the legal uncertainty that surrounds the Brazilian innovation legal framework (Reference Rapini, Albuquerque, Chaves, Silva, Souza, Righi and CruzRapini et al. 2009; Reference Closs and FerreiraCloss and Ferreira 2012; Reference RauenRauen 2016). Three particular aspects of legal uncertainty in the Innovation Act should be highlighted: (1) the management of private resources received by universities and public research institutes as compensation for their involvement in innovation activities (since they are part of central government administration, universities and public research institutes do not enjoy autonomy in managing private resources); (2) the difficulty of implementing financial compensation for university and public research institute researchers involved in innovation activities, since the law does not clearly state how such benefits should be granted; and (3) the still-limited role of KTOs – a situation that undermines their capacity to generate and implement new university and public research institute partnerships.
Recognizing the legal uncertainty in these areas, the 2016 Science and Technology Act introduced significant reforms to the Innovation Act. As regards university/public research institute–enterprise interaction, it aimed to strengthen and empower KTOs and establish clearer processes for managing private resources to reward institutions engaging in innovation activities. However, it has not clarified the law on compensation for public researchers, and so it seems unlikely to succeed in reducing the difficulties faced by universities and public research institutes in managing rewards for researchers involved in such activities.
In sum, there is still scope to improve the Brazilian Innovation Act and complementary laws and practices in order to further reduce legal uncertainty within the Brazilian innovation legal framework as regards university–industry interaction. But in any case, fostering public–private partnerships in Brazil requires changes that go beyond the modernization of innovation legislation. The solutions needed are many, but all of them are connected – at least in some way – with the creation, diffusion, and application of protocols, internal processes, and rules of conduct in government organizations, and with the capacity of government agencies to deal with conflicts of interest and risk.
7.4.2 The Main Channels of Knowledge Transfer
The most common channels for knowledge transfer are probably informal ones such as technology fairs, workshops, conferences, and seminars. Based on informal networks and contacts, these channels play an important role in the innovation landscape in many countries, not only Brazil. However, our analysis here focuses mainly on formal mechanisms for knowledge transfer, even though these are likely to be preceded by an informal approach.
The Innovation Act established the formal channels for knowledge transfer. One of the obligations of universities and public research institutes in this context is to inform the Ministry of Science, Technology, and Innovation about licensing contracts and the overall intellectual property policies of the institution. This information is collected by the Ministry every year and published in a report that contains basic information about knowledge transfer in Brazilian public research institutes and universities – the so-called FORMICTFootnote 11 reports. For instance, these reports contain the number and type of knowledge transfer contracts undertaken by public organizations in the country.
Based on this information, Table 7.8 shows the most common formal channels for knowledge transfer used by the 264 public research institutes and public universities that responded to the MCTIC survey in 2014. Licensing contracts seem to be the most common knowledge transfer channel among the sample, representing more than 42 percent of total contracts signed by respondent institutions, followed by R&D agreements (25 percent) and know-how contracts (9 percent).
Table 7.8 Knowledge transfer contracts undertaken by Brazilian public research institutes and public universities by type of contract in 2014
| Type of contract for knowledge transfer | Number of universities and public research institutes that reported having this kind of contract | Number of contracts | Contracts as a share of all knowledge transfer contracts (%) | Total amount (BRL million) | Total amount (USD million) |
|---|---|---|---|---|---|
| Licensing contract | 30 | 823 | 42 | 34.40 | 10.62 |
| R&D collaboration agreement / collaborative R&D | 34 | 485 | 25 | 221.70 | 68.43 |
| Contracts for knowhow, technical assistance and other services | 15 | 159 | 8 | 108.00 | 33.33 |
| Confidentiality agreement | 12 | 133 | 7 | – | – |
| Co-ownership agreement | 13 | 84 | 4 | 2.60 | 0.80 |
| Contract or agreement for access to research facilities | 4 | 76 | 4 | 2.10 | 0.65 |
| Contract or agreement for the use of intellectual human capital in R&D projects | 5 | 45 | 2 | 58.00 | 17.90 |
| Contract or agreement to share research facilities with small companies in incubation activities | 5 | 27 | 1 | 6.90 | 2.13 |
| Biological material transfer agreement | 6 | 19 | 1 | – | – |
| Contract to assign IP rights | 2 | 2 | 0 | – | – |
| Other | 13 | 104 | 5 | 3.90 | 1.20 |
| Total | 1,957 | 100 | 437.60 | 135.06 |
According to the MCTIC data, most of the licensing contracts were made with companies from Brazilian manufacturing, which represented around 30 percent of total contracts. Within manufacturing, the pharmaceutical and chemical industries were the sectors with the largest number of knowledge transfer contracts.
It is important to note, however, that the figures are distorted by the fact that the information comes from KTOs. KTOs are most likely only reporting on those contracts and agreements for which they are responsible. Since the involvement of a KTO is only mandatory in the case of licensing contracts, this channel is probably overestimated in the official data.
For the same reason, our own interview data from KTOs also probably overstate the importance of licensing. Four interviews were undertaken with major KTOs in Brazil as part of the research project for this book. We identified three main formal channels of knowledge transfer: licensing and commercialization of IP, software, and knowhow; non-disclosure agreements; and technological partnership agreements. Of these, licensing emerged as the KTOs’ main activity.
This contrasts with the results of the interviews we conducted with researchers, which identified consultancy performed by academics personally rather than agreements on the part of their universities as the main knowledge transfer channel, followed by research agreements (sponsored research) between universities and companies. The literature on knowledge transfer also emphasizes the importance of academic consultancy.
All the interviewees – KTOs and individual researchers – agreed that data management was crucial to control and improve KTOs’ activities and knowledge transfer processes. They also noted the importance of data management in enabling KTOs to comply with their obligations under the Brazilian Innovation Act, which requires them to “monitor the processing of applications and the maintenance of the institution’s intellectual property rights” and “promote and monitor the University/PRI relationship with companies.”
Despite the importance of their data management function, KTOs may hold incomplete information about universities’ knowledge transfer activities. For instance, at Unicamp the KTO (called Inova) may support the process of signing a new sponsored research contract with a company, but this is not necessary or mandatory. In fact, the internal regulations on this process do not foresee a role for the office. As a result, in 2016 Inova had information about fewer than thirty research contracts with companies undertaken by Unicamp, according its annual report.
The same thing happens in several other universities, explaining why licensing contracts appear in the official statistics as the main formal channel for knowledge transfer. But all the other evidence suggests that consultancy and research contracts are the most important channels, although there are no consolidated data to confirm this.
7.4.3 Institutional Knowledge Transfer Practices
In general, the knowledge transfer activities of the institutions whose personnel were interviewed are based on: (1) the innovation policy of the universities to which they are linked, (2) their university’s internal regulations on research and graduate activities, (3) the Brazilian Innovation Act and related regulations, (4) federal law on supporting agencies, (5) laws on academic employment, and (6) implicit policies of innovation (the “culture”) adopted by researchers and university academics.
In order to stimulate university/public research institute–enterprise interactions, the Brazilian Innovation Act obliged all public research institutes and public universities to establish their own innovation policies covering, among other things: (1) strategic objectives and guidelines for innovation; (2) entrepreneurship; (3) technological services; (4)laboratory-sharing procedures; and (5) IP rights and knowledge transfer. The Act also stipulated that universities and public research institutes should have their own KTOs fulfilling the role of intermediate agents responsible for managing the institution’s innovation policies (Brasil 2004: art. 16).
All the institutions answering our research questionnaire said they had an IP policy. The requirements of the Innovation Act are probably responsible for that in many cases, but some institutions had already established their IP policies or created KTOs before the Act. For instance, Inova, the KTO at Unicamp, was created in 2003, and UFMG has had an IP policy since 1998.
While every public university and public research institute in the country is required to have a KTO, the Innovation Act allowed institutions to share a KTO. This is probably a unique feature of the Brazilian KTOs: several of them serve more than one research organization.Footnote 12
It is rare for Brazilian universities and public research institutes to use other kinds of agency to support knowledge transfer or entrepreneurship. For example, liaison offices to promote partnerships with companies are not common in Brazilian institutions, and neither are funds or specific agencies geared to supporting entrepreneurship. Therefore, the KTOs sometimes take on these kinds of responsibility. For instance, some interviewees mentioned actions taken to stimulate faculty and graduate students to get involved in technology partnerships with companies and entrepreneurship, and at Unicamp the incubator and technology park come under the umbrella of Inova.
However, several authors argue that the role of Brazilian KTOs is still very limited, and, in certain cases, research institutions do not include them in the management of innovation activities (Reference Pinheiro-Machado and OliveiraPinheiro-Machado and Oliveira 2004; Reference Dos Santos, Toledo and LotufoDos Santos et al. 2009; Reference Closs and FerreiraCloss and Ferreira 2012; Reference Pereira and MelloPereira and Mello 2015; Reference Rauen, Turchi and TurchiRauen and Turchi 2017).
The explanation for the limited role of Brazilian KTOs may in part lie in their staff profile. According to the MCTI (2017), more than 50 percent of KTO staff are public servants with no previous experience in the private sector, which might be of great help in evaluating the commercial potential of or market interest in a given technology. The others are fellows, students or support employees (interns constitute almost 10 percent of all KTO staff).
Regarding KTOs’ intended role as a contact point for companies at public research institutes, this is also not so relevant since companies’ approaches to public research institutes tend to be informal or motivated by other concerns. Reference Rauen, Turchi and TurchiRauen and Turchi (2017) consulted thirteen public research institutes and over sixty public specialists in the management of public–private R&D interaction to identify, among other things, common business practices in accessing public research institutes’ knowledge transfer channels. Their interviewees reported that companies tend to approach public research institutes in four different ways to seek their R&D support:
spontaneous demand (motivated by previous informal contacts with public research institutes’ technicians and researchers);
response to public funding notices (especially those notices that prioritize research activities and technological development through public–private partnerships);
contact with public research institute alumni; and
response to support advertised by public research institutes themselves, which occurs mainly in the case of institutions that provide open-access laboratories for many different users.
In fact, several studies (Reference Porto, Kannebley Júnior, Selan and BaroniPorto et al. 2011; Reference Closs and FerreiraCloss and Ferreira 2012; Reference Rauen, Turchi and TurchiRauen and Turchi 2017) have shown that public funding announcements aimed at building partnerships between business and universities/public research institutes are very important in fostering interest among companies in formalizing partnership agreements.
Nevertheless, KTOs undertake several activities to promote university–industry interaction. All the KTOs at larger universities, for instance, release a list of their institution’s technologies that are available for licensing so that companies can find the most suitable ones for their interests.
Other activities, such as pricing technical services, agreeing the number of public research organization staff who will consult on R&D projects or the number of hours of private access to laboratories, tend to be led by public research organization researchers and technicians themselves. The role of the KTO at this negotiation stage is minimal or nonexistent.
While KTOs have limited participation in most of the public research institutes’ innovation management activities, they do make an important contribution to managing IP activities, especially drafting, registering, and filing patents. Reference Rauen, Turchi and TurchiRauen and Turchi (2017) reached this conclusion from interviews with specialists in knowledge transfer and researchers at several public research institutes in Brazil in which they asked about the role of KTOs, among other things. The identified two main reasons why KTOs have little participation in and limited influence over public research institutes’ innovation management activities. First, KTOs have limited managerial and budgetary autonomy, as they depend largely on fund transfers from and strategic decisions by public research institutes. Second, they suffer from high staff turnover and a dearth of qualified or specialized staff, because their link to government institutions obliges them to rely on public tenders in hiring new staff and they do not offer competitive salaries.
In sum, although the KTOs were expected to play an important role in mediating innovation activities with the private sector, they lack the recognition and operational flexibility necessary to carry out their tasks.
As regards incentives, the Innovation Act and subsequent legislation did provide financial incentives for universities and academics to work with companies, and, in consequence, it is now very common for both institution and individual staff to receive financial and nonfinancial compensation for their participation in innovation activities.
All the institutions we surveyed reported that professors and researchers can undertake consultancy activities for companies and can also receive additional remuneration for participating in research contracts between universities and companies. Finally, they can also receive one-third of any royalties received from licensing technologies that they helped to develop.Footnote 13
Regarding nonfinancial compensations, interviewees affirm that, in collaborative projects, the standard procedure is that any remaining research assets such as equipment tend to be donated to the university.
In spite of all the difficulties faced, in particular by public universities, the institutions were unanimous in reporting that these compensation mechanisms are important in stimulating engagement among teachers and researchers in developing technologies in partnership with companies. Interviewees believe that KTOs helped to empower researchers to seek new innovation projects with companies, because they felt there was a support structure in place for identifying, negotiating and managing projects.
7.5 Final Remarks
There has been increasing concern among researchers, specialists, and policymakers about the need to narrow the gap between the scientific knowledge production in universities and the requirements of the business sector. To some extent, such concern lay behind the development of a brand-new framework of public policies fostering university–industry interaction in Brazil in the last fifteen years.
Thanks to these new policies, a lack of interaction between companies and universities is no longer the main bottleneck in the Brazilian innovation system. Today, most of Brazil’s major universities and research institutes have a knowledge transfer office to support knowledge transfer to the business sector. Furthermore, there are financial incentives for universities and for academics personally to work in partnership with companies, through sponsored research at the university or consultancy.
Brazilian legislation is now much more akin to the rules in place in several developed countries in terms of managing intellectual property rights. The KTOs have primary responsibility for filing patents on behalf of Brazilian universities, and universities are now the main institutional applicants at the National Institute of Industrial Property.
However, some problems clearly remain unsolved. Excessive bureaucracy is always mentioned as a concern when it comes to the relationship between universities and research institutes and the business sector. Bureaucracy is a big issue in the public sector, and most of Brazil’s universities and public research institutes are part of the public sector.
When it comes to patenting, although the share of universities and research institutes in Brazilian patenting activity has increased, few of the patents they own are, in fact, licensed to companies. This underlines the importance of informal knowledge transfer channels in university–industry interaction in Brazil. So one of the main conclusions in terms of future policy is that it should aim to reinforce such channels.
Of course, it is also necessary to look at the demand side. The overall business environment is also important in explaining why university–industry interaction is not stronger in Brazil. This chapter has not examined the private sector as such in detail, but a lack of competition should be acknowledged as an important reason why Brazilian companies show little interest in the knowledge produced by the country’s universities. Brazil is one of the most closed economies in the world, and so the motivation to innovate is low.
8.1 Introduction
China is an emerging economy with a rapidly growing technology market. Both the central and provincial governments have supported knowledge transfer activities and directed technology development, initiating regional innovation collaboration and promoting entrepreneurship, innovation, and economic growth. As in other countries, many of these activities are geographically concentrated. For example, five provinces (Beijing, Guangdong, Shanghai, Shandong, and Jiangsu) accounted for half of total R&D expenditure in China in 2011, while the top ten provinces accounted for 70 percent of total R&D expenditure that year (Reference Wang, Hu, Li, Li and LiWang et al. 2015a).
In recent decades, Chinese universities and public research institutes have made tremendous progress in the fields of research and education. This progress is reflected in the increasing number of scientific publications and patent applications originating in the country. The technology market, spinoff companies from universities and public research institutes, cooperation between academy and industry, and patent transfer and licensing have all developed rapidly in China. Yet several issues have resulted in lower than possible rates of knowledge transfer from universities and public research institutes to firms, resulting in substantial amendments in 2015 to the Law on Promoting the Transformation of Scientific and Technological Achievements (PTSTA). These amendments removed legal barriers to knowledge transfer and provided incentives for universities and public research institutes to engage more actively in knowledge transfer activities.
However, several factors are likely to continue to hinder the growth of knowledge transfer from universities and public research institutes to firms. Challenges include the immaturity of technology markets, the inadequate R&D capabilities and investments of Chinese companies, the historical legacy of past policies that failed to provide sufficient incentives for patenting and transfer activities, ambiguous corporate governance and regulations, and underdeveloped intermediary agencies such as knowledge transfer offices.
This chapter looks at these issues in detail. Section 8.2 describes how the role of Chinese universities and public research institutes has evolved in recent decades with the transition to a market economy. Section 8.3 outlines changes in the main laws and policies governing knowledge transfer activities. Section 8.4 examines the knowledge transfer activities of Chinese universities and public research institutes, while Section 8.5 analyzes ongoing barriers to knowledge transfer. Last, a short concluding section summarizes our main findings.
8.2 The Role of Universities and Public Research Institutes in China
Since the 1980s, China’s universities and public research institutes have undergone fundamental changes as part of the country’s economic transformation from a centrally planned system to a market-based economy.
In March 1985, the Central Committee of the Communist Party of China issued a Decision on Reforming the Science and Technology System (CCCPC 1985), which emphasized the economic orientation of the science and technology (S&T) system by introducing elements of competition and market discipline. Research institutions formally under the administration of central or local governments were encouraged to join large and medium-sized enterprises and become responsible for their own profits and losses (Reference BaarkBaark 2001; Reference Huang, Amorim, Spinoglio, Gouveia and MedinaHuang et al. 2004; OECD 2008).
R&D investment made up approximately one-third of total S&T expenditures in the 1990s. Government R&D expenditures have increased steadily since then (Reference BaarkBaark 2001). However, as Reference Huang, Amorim, Spinoglio, Gouveia and MedinaHuang et al. (2004) note, compared to the European Union member states and other Organisation for Economic Co-operation and Development (OECD) countries, China’s innovation system was underdeveloped in the 1990s, partly as a consequence of insufficient support from legislative actions, inadequate policies to support innovation, human resources and finance, and low levels of business innovation.
In 1993, the State Council promulgated the National Outline for Educational Reform and Development (CCCPC 1993), with the goal of raising the quality of teaching and research at Chinese universities to among the world’s best through funding to create an elite group of universities and to support key disciplines. Subsequently, the Ministry of Education launched the “211 Project” to support the development of 100 leading universities. In 1995, China announced the Strategy of Invigorating China through Science and Education, emphasizing the role of science and education in economic and social development. The country’s higher education sector developed rapidly thereafter. The 1998 Law of Higher Education established three basic functions for Chinese universities: cultivating talent, scientific research, and social services.
In 1999, the Ministry of Education initiated the “985 Project” supporting the development of world-class research universities. By 2015, China had 2,852 universities, 1.57 million faculty members, 9.75 million undergraduate students and 6.45 million graduate students, of whom 74,000 were PhD students. Today, China has 112 universities supported by the 211 Project and thirty-seven supported by the 985 Project.
In 2006, the government issued its National Plan for Medium and Long-Term S&T Development (CCCPC 2006), which further defined the functions of universities and public research institutes in the national innovation system. The Plan states that universities are “important bases for cultivating high-level innovation talents,” “one of the most important forces for basic research and high-technology innovations,” and “an emerging force for solving important science and technology problems, promoting technology transfer.” The roles of public research institutes were to conduct basic research, cutting-edge technological research and social science research.
Due to recent efforts, China’s innovation activities have intensified substantially and attracted the return of highly skilled workers from overseas. Combined with a growth in R&D investments, this has led to increased scientific publications and patent applications, as shown in the following section.
8.2.1 Investment, Scientific Publications and Patent Applications
R&D Investment
China has become a powerhouse in R&D spending since the 2000s. In 2012, its gross expenditure on R&D (GERD) passed 1 trillion renminbi (CNY) (USD 163 billion), third behind only the U.S. and the European Union. In 2017, this number rose to a record CNY 1.76 trillion (USD 254 billion), ranking China as second in the world in terms of R&D spending after the U.S. (National Bureau of Statistics 2018). R&D intensity, the ratio of R&D expenditure divided by gross domestic product (GDP), hit a record high of 2.12 percent – a rise of 0.01 percentage points compared to 2016.
As Figure 8.1 demonstrates, the share of business R&D spending out of total R&D expenditures has kept increasing throughout the past twenty years, rising from 60 percent in 2000 to 77 percent in 2016 (China Statistical Yearbook on Science and Technology 2017).

Figure 8.1 Share of total R&D expenditures by enterprises, public research institutes, and universities in China, 2000–16
All types of organizations devote most of their R&D investment to experimental development or applied research (Figure 8.2), but universities are the primary performer of basic research, accounting for 49.3 percent of total basic research expenditures of CNY 82.3 billion.Footnote 1

Figure 8.2 Share of 2016 R&D expenditures in China by application
Scientific Publications
China has become the world’s second largest producer of scientific publications (Institute of Scientific and Technical Information of China 2018). In 1989, the number of Science Citation Index (SCI) papers by Chinese authors was only 3 percent of the number of papers written by US authors. By 2008, this proportion had risen to 30 percent. Based on the data in Table 8.1, universities and public research institutes accounted for 85.9 percent and 10.2 percent respectively of all SCI-indexed papers published by Chinese researchers in 2017.
Table 8.1 Number of SCI-indexed papers by different organizations in China, 2003–17
| Quantity/year | 2003 | 2005 | 2010 | 2015 | 2017 |
|---|---|---|---|---|---|
| Universities | 63,672 | 125,814 | 100,772 | 219,957 | 273,337 |
| PRIs | 15,840 | 25,010 | 18,941 | 29,749 | 32,370 |
| Medical institutions | 455 | 1250 | 342 | 8,973 | 11,208 |
| Enterprises | 550 | 756 | 1,340 | 744 | 1,149 |
| Total | 80,517 | 152,830 | 121,395 | 259,423 | 318,064 |
Patent Applications
Since the 2000s, China has experienced a surge of patent applications. The total number of invention patent applicationsFootnote 2 filed with China’s State Intellectual Property Office (SIPO) increased from 51,747 in 2000 to 1,338,503 in 2016. In 2017, more patent applications were filed with SIPO than the filings for the United States of America (U.S.), Japan, Republic of Korea, and Europe combined. Figure 8.3 shows domestic invention patent applications by type of entity. Enterprises have the most rapid growth in patent filings. The share of university and public research institutes in total invention patent applications increased from 14.4 percent in 1995 to 22.9 percent in 2005, before declining to approximately 19 percent from 2014. Reference Zhang and WanZhang and Wan (2008) analyzed the ownership of Chinese patents and found that public research institutes have a higher efficiency (measured by the number of patents per unit of R&D expenditure) in generating invention patents, while enterprises have higher efficiency in generating utility model patents.

Figure 8.3 Domestic invention patent applications by different types of organization, 1995–2016
8.3 Laws and Policies Relevant to Knowledge Transfer
8.3.1 The Legal Framework for Knowledge Transfer in China
One of the most important laws governing knowledge transfer activities in China is the 2007 Science and Technology Progress Law, which provides the legal framework for the management of scientific and technological achievements. According to Article 20 of the Science and Technology Progress Law, intellectual property rights (IPRs) that are generated from government funding by a university or public research institute belong to the institution, except when the IP rights involve national security, the national interest, or other major social and public interests. IPRs include patents, copyrighted software, integrated circuit designs, and new plant variety rights.
While the concept of patents dates to the fifteenth century in Europe, the introduction of a system of intellectual property laws in China is very recent (Reference Kafouros, Wang, Piperopoulos and ZhangKafouros et al. 2015). China joined the World Intellectual Property Organization in 1980, paving the way for the creation of an IP system that complies with international standards (Reference Bosworth and YangBosworth and Yang 2000). Five years later, in 1985, China signed the Paris Convention for the Protection of Industrial Property and established a Patent Office, the predecessor of the current SIPO. The Chinese Patent Law was enacted in 1984 and is the governing legislation for the protection of technological inventions in China. The Patent Law came into effect in 1985 and has been amended three times, in 1993, 2001, and 2009.
Article 6 of the 2009 Patent Law regulates the ownership of inventions created by academics and researchers at universities and public research institutes during their work, or when they use materials, facilities, or equipment provided by a university or public research institute. According to the Patent Law, the inventor of inventions created as part of their work or using workplace assets has the right to be acknowledged on the patent document and receive a reward or compensation from their employer, but the employer owns the invention.
Another essential law governing knowledge transfer in China is the Law on Promoting the Transformation of Scientific and Technological Achievements (PTSTA), promulgated in 1996 and amended in 2015. The Law covers rights to scientific and technological achievements, rewards for R&D and knowledge transfer personnel, and requires universities and public research institutes to establish or obtain access to knowledge transfer agencies.
Contract law and company law also regulate knowledge transfer in China, as the relationship between the parties to a knowledge transfer agreement reflects basic contractual relations and knowledge transfer often involves enterprises as technology buyers or collaborating partners.
8.3.2 Amendments to the PTSTA Law in 2015
The PTSTA Law of 1996 was amended in 2015 for three reasons. First, several articles of the Law were outdated as a result of significant changes in the Chinese economy. Second, many provinces had experimented with various policies to stimulate knowledge transfer and the amendments were designed to enact the most effective policies into law. Third, universities and public research institutes in China lacked adequate incentives to transfer technology because of the institutional setting and rules defined in the 1996 Law.
Under the 1996 Law, a university or public research institute was required to report to and obtain approval from the Ministry of Finance or the State-Owned Asset Supervision and Administration Commission in order to license or otherwise dispose of IP. Universities and public research institutes did not have full owner’s rights, and consequently were less motivated to promote knowledge transfer. Furthermore, after they transferred IP assets, any revenue they earned from the transfer had to be paid to the Ministry of Finance.
The amendment dealt with these issues. Under Article 18 of the amended PTSTA Law, universities and public research institutes established by the state have the right to dispose of their scientific and technological achievements, including the right to transfer technologies. However, the price agreed on by both parties in negotiation or auction and the name of the scientific and technological achievements must be disclosed to the public. Furthermore, universities and public research institutes can keep the revenue from knowledge transfer and are not required to pay it to the Ministry of Finance.
Before the amendment, knowledge transfer was not used as a performance measure for universities and public research institutes. In contrast, the amendment has made knowledge transfer a legal obligation for Chinese universities and public research institutes. Article 17 of the amended Law stipulates that public research institutes and universities established by the state are required to strengthen the management, organization and coordination of the transformation of scientific and technological achievements, prepare an annual report on their achievements in transforming science and technology, and set up a knowledge transfer organization and process.
In May 2016, the State Council announced implementation details for the PTSTA Law in a Program on Promoting Scientific and Technological Achievements, Transfer and Transformation to promote the disclosure and exchange of information on scientific and technological achievements. Specific actions under this program included:
Setting up a coordination mechanism for industry, universities and public research institutes so they can cooperate fully to promote knowledge transfer.
Creating a commercialization base for scientific and technological achievements.
Strengthening the transfer of scientific and technological achievements into market-oriented services, including building a national technology trading network platform and offering knowledge transfer services at the regional level.
Promoting scientific and technological innovation and entrepreneurship through the development of “maker spaces” to open up the scientific and technological resources of universities and public research institutes to the public.
Training professional knowledge transfer personnel.
Almost every provincial government has enacted regulations to implement the provisions of the amended PTSTA Law. For example, several provinces increased the proportion of knowledge transfer revenue that can be used to reward R&D and knowledge transfer or set up special scientific and technological achievement funds. In Jiangsu Province the fund was valued at CNY 2 billion in 2014. Provincial governments were often bolder than the central government in promoting knowledge transfer because they considered knowledge transfer to be an important driver of local economic growth.
To fulfill the legal obligations stipulated in the amended PTSTA Law, China’s universities and public research institutes adopted up to seven actions to facilitate knowledge transfer, although some universities and public research institutes implemented some of these actions before the amended Law, for instance, to reflect provincial policies or known best practice.
1. Increasing rewards and compensation for inventors and knowledge transfer contributors. Article 45 of the amended Law requires that no less than 50 percent of the net profit from knowledge transfer should be given as a reward or compensation by universities and public research institutes to the inventors and others who made significant contributions to the transfer, including knowledge transfer officers. This provision greatly incentivized knowledge transfer by universities and public research institutes. Nearly all universities and public research institutes have reformed their reward regulations since 2015. Many now give up to 70 percent of net profits from successful transfer to the inventors and related contributors. In 2015, the Drug Research Institution of the Chinese Science Academy paid nearly CNY 12 million to inventors and knowledge transfer contributors.
2. Setting up knowledge transfer organizations. China’s public research institutes have set up knowledge transfer organizations that are either associated with several national-level organizations, such as the National Technology Transfer Center or the National Technology Transfer Demonstration Institution, or cofounded with local governments or enterprises. Successful examples include the Hunan University of Chinese Medicine, which transferred its newly developed Chinese traditional medicine to pharmaceutical enterprises and earned revenue of CNY 68 million. The transfer eventually resulted in the development of enterprises with annual revenues of several hundred million renminbi and created several leading brands of biomedical products in Hunan Province. Another example is the Central South University of Forestry and Technology. The University provided a feasibility study of bamboo plywood production, factory planning, process design for workshops, technical training, preproduction technical guidance and many other technical services to more than 400 bamboo plywood enterprises which together achieved total output valued at more than CNY 20 billion. A third example is Changzhou University, which signed twenty-two knowledge transfer agreements with twenty major manufacturers of phosphorus chemical products and obtained a total income of over CNY 20 million.
3. Implementing performance evaluation systems. Many universities and public research institutes have established performance evaluation systems to motivate knowledge transfer staff. By contributing to knowledge transfer, staff can be promoted to senior management positions and have the opportunity to pursue a promising career path.
4. Marketing of information on scientific and technological achievements. Universities and public research institutes participate in exhibitions organized by governments and other commercial organizations to exchange information with enterprises and investors, introduce their scientific and technological achievements, negotiate with potential buyers, and disseminate information about their scientific and technological achievements on their websites to attract potential partners.
5. Permission for academics to take a leave of absence to start a business. Before the 2015 amendment to the PTSTA Law, universities and public research institutes did not encourage academics to work part-time to assist a firm to transfer licensed university technology or take a leave of absence to start their own businesses. However, the 2016 implementation details to the PTSTA Law allow academics to do so. The policy requires universities and public research institutes to establish their own systems to manage academics while they are on leave, and should keep the faculty position of academics for up to three years for those who take a leave of absence to create new businesses.
6. Policies on spinoffs. Many universities and public research institutes have introduced new initiatives to permit and encourage students to start their own businesses. On-the-job and off-the-job entrepreneurship by professionals and technicians in universities and public research institutes are also encouraged. For example, according to the Knowledge Transfer Regulation of Zhejiang University, faculty and students can invest in companies, using their scientific and technological achievements and proprietary technology.
7. Strengthening cooperation between universities, public research institutes and local industry. In addition to the policies identified above to provide incentives for academics to engage in knowledge transfer, policy has also encouraged knowledge transfer via university–industry collaboration. A common channel is to establish a joint research institute that offers technology services to local industries. In this collaborative model, local governments offer land, funds, and buildings while universities and public research institutes offer their scientific and technological achievements, R&D capabilities, management teams, and equipment. Local governments are eager to support this model due to expectations that collaboration will promote local economic growth.
China has formulated four other types of policy to promote university–industry research linkages. One consists of policies to establish strategic alliances for industrial technology innovation. The first fifty-six alliances were set up in 2010 and focused primarily on promoting industrial technology innovation. Many were led by universities and public research institutes. Once scientific and technological progress was made, new technologies could be transferred smoothly from universities and public research institutes to industry through the alliances.
The second policy type relates to the reform of the National Science and Technology Plan. Industrial development projects that are funded under the Plan are required to include enterprises in the research and in the development of research agendas. Currently, enterprises participate in nearly 90 percent of projects under the Plan and lead nearly 50 percent of science and technology projects.
The third policy category establishes national technology innovation platforms or Innovation Centers to promote university–industry research cooperation on nationally strategic industrial technologies. The first center, the National High-Speed Train Technology Innovation Center, located at Qingdao City in Shandong Province, was established in September 2016. In the same year, the Ministry of Industry and Information began creating other National Manufacturing Innovation Centers to advance industrial innovation capacity. Nearly fifteen such centers were planned to be established by 2020.
The fourth policy category consists of science parks, which are an important tool for Chinese innovation policy (Reference Lai and ShyuLai and Shyu 2005; Reference Jongwanich, Kohpaiboon and YangJongwanich et al. 2014). In 1991, the State Council established the Torch Program, which accelerated the establishment of science and industry parks across China. The number of university science parks increased from forty-two in 2004 to 115 in 2014 (Torch Report 2016). These science parks offer various incentives to encourage investment and the formation of new firms:
New firms are exempt from corporate income tax for two years.
Licenses are waived for the importation of materials and parts used in producing products for export.
Revenue from knowledge transfer is only taxable after the first CNY 300,000.
Intangible assets such as intellectual property can be factored into a company’s registered capital.
The science parks can provide professional intermediary services such as legal services, human resource management services, and marketing support.
Several studies have confirmed the contribution of university–industry research cooperation in China to universities’ revenue, firms’ innovative capacity and regional economic development (Reference Liu and ShiLiu and Shi 2009; Reference Ng and LiNg and Li 2009; Reference Yang and LingYang and Ling 2009; Reference Li, Ren and WuLi et al. 2010; Reference Kafouros, Wang, Piperopoulos and ZhangKafouros et al. 2015; Reference Fu and LiFu and Li 2016; Reference Hao, Pan and ZhaoHao et al. 2016).
Reference QuanQuan (2010) surveyed R&D laboratories in companies that interact with universities in Beijing. His results show that firms have different motivations that prompt different collaboration activities. The most frequently cited incentive for firms to collaborate with universities is to build a positive public image. In addition, companies sponsor research projects as a cost-effective way of keeping abreast of relevant new discoveries in China. Companies will outsource R&D to a university to reduce costs. But the most attractive factor for cooperation, according to the survey, is access to high-quality graduates. A large proportion of employees and interns in corporate R&D laboratories are graduates of partner universities. Reference Wang, Hu, Li, Li and LiWang et al. (2015a) conducted a survey on the factors that affect the success of academic–industry collaborations. They found that collaboration output was affected by not only the university’s reputation and research capability, but also by the breadth and depth of the collaboration.
8.4 Data and Research on Knowledge Transfer from Universities and Public Research Institutes
Other than making new knowledge publicly available at no cost, universities and public research institutes can transfer technology through cooperative arrangements, including contract research and collaboration, licensing, and establishing spinoff enterprises. Many of these transfers occur through the technology market.
8.4.1 The Technology Market
Recently, China has made great progress in developing its technology market. Based on information from the technology trading information service platform and Innovation Relay Center networks, China has established a unified and open platform to publish information about resources for knowledge transfer. In 2016, universities and public research institutes signed 90,573 contracts for knowledge transfer and research cooperation. The total value of these contracts was CNY 106.52 billion. Between 2009 and 2016, universities and public research institutes combined accounted for approximately 10 percent of the total value of knowledge transfer contracts (see Table 8.2).
Table 8.2 Share of transaction value of knowledge transfer contracts by seller types, 2009–16 (%)
| 2009 | 2010 | 2011 | 2012 | 2013 | 2014 | 2015 | 2016 | |
|---|---|---|---|---|---|---|---|---|
| PRIs | 6.3 | 5.1 | 5.5 | 6.3 | 6.7 | 5.3 | 5.7 | 6.2 |
| Universities | 4.4 | 5.0 | 5.2 | 4.6 | 4.4 | 3.7 | 3.2 | 3.2 |
| Enterprises | 86.4 | 85.5 | 86.5 | 86.5 | 86.2 | 87.6 | 86.2 | 86.6 |
| Others | 2.8 | 4.3 | 2.8 | 2.6 | 2.7 | 3.3 | 4.9 | 4.0 |
PRI = public research institute.
There are several successful examples of the development of technology markets. The Xi’an S&T Market opened in 2011 and has facilitated knowledge transfer transactions worth more than CNY 110 billion, organized information exchange activities, and served more than 25,000 enterprises. The Zhejiang Online Technology Market, opened in 2002, uses network information technology and e-commerce technology to disseminate information on the supply of and demand for technologies. By the end of November 2013, Zhejiang Online Technology Market had 94,319 members, including enterprises, universities, and public research institutes; listed 63,944 technical problems from enterprises, and published 153,771 scientific and technological achievements. The number of signed contracts from the period of 2002–2013 amounted to 28,929, worth CNY 25.245 billion. The Online Technology Market has become an important platform for technology trading in Zhejiang Province.
8.4.2 University–Industry Research Cooperation
Reference Brehm and LundinBrehm and Lundin (2012) explored university–industry collaboration activities and innovation outputs in China between 1998 and 2004 involving 20,000 large and medium-sized companies. They found that Chinese universities’ revenue from knowledge commercialization activities has increased over time.
Reference LanLan (2006) categorizes research contracts between universities and public research institutes and companies in China into four types: contracts for technology development, knowledge transfer, technology consulting, and technology services. Among the four types of contract, technology development was the most common, accounting for more than 30 percent of the total contract value. Reference Liu and JiangLiu and Jiang (2001) discuss the methods obtained by Tsinghua University to pursue knowledge transfer since 1995, which include establishing a university–industry cooperation committee to provide services for member companies, setting up funding for collaborative research, and building an online information system to update research findings and enterprise requests. Reference Wang and MaWang and Ma (2007) researched how Tsinghua University dealt with the IPRs created through collaborative R&D projects with multinational companies. They describe four types of contract: (1) commissioned projects, in which an enterprise provides the research funding and the university conducts the research using its own equipment and manpower; (2) joint research projects, in which senior researchers from the university participate in the research and the enterprise provides research funding, equipment and engineers; (3) joint development projects, in which the university provides researchers and an enterprise provides equipment and engineers, with development funding coming from a third party; and (4) joint research organizations, in which both parties provide funds, equipment, and researchers.
The most recent data for 2015 show that universities and enterprises in China jointly performed more than 88,000 R&D projects for a total value of CNY 66.65 billion (Ministry of Science and Technology 2017). The universities and enterprises established 2,276 post-doctoral fellowships and 10,191 joint research institutions between them. According to the Ministry of Commerce (2015), by 2015, foreign firms had established more than 2,400 R&D laboratories in China. Many foreign firms established joint R&D programs, laboratories, training centers, technical innovation alliances, and so on with universities and public research institutes. These institutions play an increasingly important role in the Chinese innovation system, and an indispensable role in knowledge transfer.
8.4.3 Patent Transfer and Licensing
Scholarly studies have identified a positive correlation between government expenditures on science and technology at the provincial level and the number of patent licensing contracts held by local universities in the same region (Reference Rao, Meng and XuRao et al. 2013). This supports the efforts of provincial governments to fund local research capabilities and suggests that proximity may influence knowledge transfer in China, as found in the U.S. and Europe.
Reference Wang, Liu, Ma and ChenWang et al. (2015b) argue that licensing universities’ technologies can contribute substantially to the subsequent innovation performance of licensee firms. The more licensing activities a licensee firm performs, the greater its subsequent innovative performance.
The sale (assignment) and licensing of patents owned by Chinese universities has increased steadily. The number of patent ownership transfers and licenses grew from 1,810 in 2010 to 4,839 in 2016 (Figure 8.4), with a notable increase between 2014 and 2016 that could be due to the implementation of the 2015 PTSTA Law. The total value of transactions increased from CNY 359 million in 2010 to CNY 1215.43 million in 2016 (Figure 8.5), and the average transaction value increased from CNY 198,000 to CNY 251,000.

Figure 8.4 Number of patent transfers and licenses by universities, 2010–16

Figure 8.5 Value of patent ownership transfers and licenses by universities, 2010–16 (million CNY)
The total number of knowledge transfer agreements (including the sale or assignment of patents, patent licensing, and other non-patent-related knowledge transfer activities) showed a similar upward trend (Figures 8.6 and 8.7). The total number of knowledge transfer agreements by universities increased from 8,408 in 2008 to 10,517 in 2014 and the total annual value of transactions in the same period grew from CNY 3.05 billion to CNY 4.01 billion, with the average transaction value increasing from CNY 3.63 million to CNY 3.82 million (Figure 8.7). A comparison between Figures 8.4 and 8.6 suggests that non-patented knowledge transfer accounts for the majority of the agreements, which include contract research and consulting services. In addition, a comparison of Figures 8.5 and 8.7 indicates that non-patent-related knowledge transfer is a considerably larger income source for universities than patent-related knowledge transfer.

Figure 8.6 Total annual knowledge transfer agreements by universities, 2008–14

Figure 8.7 Total annual value of knowledge transfer agreements by universities, 2008–14 (million CNY)
Table 8.3 shows the patenting activities of the most important 1,497 universities in China in 2015. These universities applied for 109,445 invention patents, were granted 54,868 invention patents and signed 2,695 contracts involving patent transfer with a total value of CNY 2.77 billion. Over the period 2011–15, the total value of all types of knowledge transfer transactions exceeded CNY 19.6 billion.
Table 8.3 Patent applications, grants, and transfers by 1,497 universities in 2015
| University type | Patent applications | Patents granted | Patents transferred1 | Number of other types of IP rights2 | |||
|---|---|---|---|---|---|---|---|
| All | Invention | All | Invention | Contract (item) | Amount (CNY 1,000) | ||
| Comprehensive | 54,977 | 34,530 | 35,723 | 17,302 | 858 | 627,056 | 4,143 |
| Engineering | 99,185 | 59,802 | 65,272 | 30,701 | 1,410 | 1,911,766 | 5,682 |
| Agricultural and forestry | 11,071 | 6,248 | 7,800 | 3,079 | 252 | 61,363 | 1,045 |
| Medicine | 5,202 | 2,683 | 3,625 | 1,249 | 46 | 147,108 | 75 |
| Normal | 11,737 | 5,182 | 7,971 | 2,011 | 102 | 21,176 | 799 |
| Others | 2,231 | 1,000 | 1,590 | 526 | 27 | 6,270 | 208 |
| Total | 184,423 | 109,445 | 121,981 | 54,868 | 2,695 | 2,774,739 | 11,952 |
1 Includes sales (assignments) and licenses.
2 Other IP rights include new plant varieties, software copyright, and layout design of integrated circuits.
Although universities and public research institutes have made tremendous progress in terms of knowledge transfer, they are still challenged by relatively low efficiency in terms of the amount of knowledge transferred per unit of R&D expenditure, understaffing and a lack of knowledge transfer professionals. The Patent Investigation Report (2015) surveyed 7,424 enterprises, 436 universities and 455 public research institutes in China. More than half of the surveyed universities and public research institutes categorized themselves as “carrying out basic research, obtaining a few patents” and that “patent licensing is limited” (Table 8.4). Approximately 25.4 percent of universities and 32.4 percent of public research institutes surveyed responded that they “carry out applied research, obtain many patents, and obtain revenue from patent licensing.”
Table 8.4 R&D and licensing modes of universities and public research institutes (%)
| Universities | PRIs | |
|---|---|---|
| Develop better technical solutions in scientific research projects, obtain patents and set up new enterprises. | 31.1 | 38.8 |
| Cooperate actively with enterprises, commissioned by enterprises to carry out specific research, cooperate with enterprises to produce products. | 60.9 | 34.4 |
| Carry out applied research, obtain a lot of patents, obtain revenues from patent licensing | 25.4 | 32.4 |
| Carry out basic research, obtain a few patents, patent licensing is limited | 58.2 | 50.4 |
Note: Multiple responses were possible so the percentages sum to more than 100 percent.
Table 8.5 gives the “exploitation rate” for patents owned by enterprises, universities, public research institutes, and individuals, which is defined as the number of patents used to make, use, offer to sell, sell, or import patented innovations or being sold to others divided by the total number of patents. Table 8.5 shows a clear difference between universities, public research institutes, and enterprises. In 2014, the average exploitation rate of patents in force was 57.9 percent, but the rate among enterprises exceeded that average by approximately 10 percentage points. The exploitation rate of public research institutes was 16 percentage points lower than the average at 41.6 percent, while the rate for universities was only 9.9 percent. The low exploitation rate by universities (which includes patents that are only offered for sale) may be due to the low quality of patents, a lack of professionals specialized in knowledge transfer, and/or the lack of incentives to transfer technology before the 2015 amendments to the PTSTA Law.
Table 8.5 Patent exploitation rates in 2014 (%)
| Enterprises | Universities | PRIs | Individuals | Total | |
|---|---|---|---|---|---|
| Invention patents in force | 67.5 | 13.5 | 28.2 | 40.0 | 50.9 |
| Utility model patents in force | 68.2 | 9.3 | 43.3 | 36.5 | 59.0 |
| Design patents in force | 70.3 | 9.0 | 46.7 | 47.4 | 60.1 |
| Total | 68.6 | 9.9 | 41.6 | 40.0 | 57.9 |
The same study also provides data on the rate of patent sales and licensing (Tables 8.6 and 8.7), defined respectively as the number of patents sold or licensed divided by the total number of patents. This may be a better indicator of the use of university patents because it excludes patents that are only offered for sale and possibly never taken up. The results demonstrate the relatively low efficiency of knowledge transfer through patents by universities and public research institutes. In 2014, the average rate of patent sales was 5.5 percent. The rate of patent sales by enterprises and individuals exceeded 5 percent, while the rate of sales was 3.5 percent for public research institutes and 1.5 percent for universities. The average rate of patent licensing was 9.9 percent. The rates of licensing by enterprises and individuals were equal to or slightly higher than the national average, compared to 5.9 percent for public research institutes and just 2.1 percent for universities. The total of patent sales and licensing rates is only 3.5 percent for universities (suggesting that only 3.5 percent of university patents were taken up by companies), but considerably higher for public research institutes, at 9.4 percent.
Table 8.6 Patent sales (assignments) rates in 2014 (%)
| Type of patent1 | Enterprises | Universities | PRIs | Individuals | Total |
|---|---|---|---|---|---|
| Invention patents | 6.7 | 1.9 | 3.2 | 4.8 | 5.2 |
| Utility model patents | 5.6 | 1.4 | 3.4 | 4.7 | 5.2 |
| Design patents | 5.8 | 1.2 | 3.8 | 7.5 | 6.4 |
| Total (all patents) | 5.9 | 1.5 | 3.5 | 5.4 | 5.5 |
1 Limited to valid patent rights in force in 2014.
| Type of patent1 | Enterprises | Universities | PRIs | Individuals | Total |
|---|---|---|---|---|---|
| Invention patents | 9.6 | 3.3 | 5.5 | 13.0 | 8.2 |
| Utility model patents | 9.7 | 1.9 | 5.4 | 10.3 | 9.3 |
| Design patents | 10.7 | 2.0 | 7.2 | 14.7 | 12.1 |
| Total (all patents) | 9.9 | 2.1 | 5.9 | 11.9 | 9.9 |
1 Limited to valid patent rights in force in 2014.
Reference Tan, Liu and HouTan et al. (2013) studied patent licensing contracts signed by Chinese universities in 2011. There were 1,359 licensing contracts involving 1,352 university patents, of which 1,202 (88.4 percent) were invention patents. Most licensing contracts were exclusive, and licensed patents were mostly for inventions in the field of chemistry (organic chemistry, polymers), physics and instruments. Additionally, only 10 percent of Chinese universities had licensing activities, and most were affiliated with the 211 Project. Other universities, which received less government financing and support, cannot be compared to 211 Project universities in terms of patenting activities. Most licensees were enterprises and were located in the eastern regions, including Shanghai, Jiangsu, and Guangdong provinces.
8.4.4 Science Parks
In 1988, the first Chinese national-level science park was established in Beijing, which is the predecessor of the Zhongguancun Science Park. After thirty years’ development, the number of national-level science parks had increased to 168 by the end of 2018. By the end of 2017, the gross domestic product produced within the national-level science parks amounted to CNY 9.52 trillion, accounting for 11.5 percent of the Chinese total GDP. In 2017, there were 52,000 high-tech companies operating in the 168 national-level science parks, 38.2 percent of the national total. Half of the incubators and “maker spaces” are located in national-level science parks (Reference ZhangZhang 2018).
Reference Zou and ZhaoZou and Zhao (2014) discuss a typical university science park in China, TusPark, which is tied to the top university in China, Tsinghua University. TusPark is considered to be part of the Zhongguancun High-Tech Science Park (the first and largest cluster of semiconductor, computer, and telecommunications firms in China) and therefore enjoys many preferential policies thanks to the established relationship between Zhongguancun High-Tech Science Park and the government. However, TusPark has its own strategy and preferences. For example, bolstered by the university’s reputation and research capacity, TusPark is home to joint R&D laboratories between Tsinghua University and world-renowned enterprises.
Reference TanTan (2006) and Reference Todo, Zhang and ZhouTodo et al. (2011) studied the evolution and achievements of Zhongguancun Science Park. Reference TanTan (2006) argues that the Zhongguancun Science Park has been an example of innovation driven by knowledge transfer from leading research institutions to companies. Groups of professionals acted as risk takers and were involved in an early experiment to establish non-state-owned firms in the region. Reference Todo, Zhang and ZhouTodo et al. (2011) emphasize the role of science parks as an efficient channel to promote technology diffusion from multinational enterprises to domestic firms in China. As Reference Todo, Zhang and ZhouTodo et al. (2011) note, Zhongguancun Science Park has become a cluster of R&D centers for multinational enterprises. By the end of 2005, forty-three of the top 500 corporations worldwide had located their R&D centers in the Zhongguancun Science Park, and most of them had a collaborative R&D laboratory with local universities.
Reference Cai and LiuCai and Liu (2015) discuss another successful university science park, Tongji University Creative Cluster. It is separate from Zhangjiang Hi-Tech Park in Shanghai, which is the state-level high-tech park in Shanghai, hosting many high-tech manufacturing firms just as Zhongguancun Science Park does in Beijing. Playing to the advantages of Tongji University and the characteristics of the enterprises in the cluster, Tongji Creative Cluster targets startups active in knowledge-intensive services. Once these startups become larger and mature, they may be integrated into the Zhangjiang Hi-Tech Park.
A few studies provide evidence regarding the contribution of science parks to knowledge flow and regional innovation capacity. For example, Reference Jongwanich, Kohpaiboon and YangJongwanich et al. (2014) used a provincial-level panel data set over the 1997–2009 period to study links among firms, public research institutes, and science parks. They found that science parks had a significantly positive impact on regional innovation capacity in terms of various measures, including a positive innovation-enhancing effect from R&D cooperation between industries and universities.
8.5 Barriers to Knowledge Transfer from Universities and Public Research Institutes to Firms
Four barriers to the technology and transfer activities of universities and public research institutes in China have been identified in the scholarly literature.
First, on the demand side, the technology market is not mature, so there have been few licensing opportunities for leading technologies. Most licensing contracts have involved traditional industries, with only a few involving emerging industries such as new energy and biological technologies (Reference Wang, Hu, Li, Li and LiWang et al. 2015a; Reference ZhangZhang 2016). Additionally, experienced licensees have been limited in number. Most state-owned enterprises were required to complete a complicated approval process before signing a licensing agreement. Even if they licensed a patent, they lacked the research capabilities to effectively use a patent and realize its market value quickly. A representative example is the licensing agreement between Fudan University and Huya Bioscience International regarding IDO (indoleamine 2,3-dioxygenase) inhibitors. Since domestic drug firms had little incentive to innovate due to high risk, a long development cycle, and the complex approval processes for new medicines, Fudan University licensed its patents to a US bioscience company using international capital (Reference ZhangZhang 2016), earning USD 65 million. Since many Chinese firms lack research capabilities to effectively use patents, more than half of all university patent licenses in China have been granted to foreign investors (Reference Tan, Liu and HouTan et al. 2013).
The limited R&D capacity of Chinese domestic enterprises is a significant barrier for knowledge transfer to domestic firms. Many industries in China are still at the middle or low end of global value chains, and the R&D intensity of Chinese enterprises is low, with an average of only 0.9 percent for industrial enterprises with annual revenue over CNY 20 million. In several provinces in the central and western regions, approximately 90 percent of industrial enterprises with revenue more than CNY 20 million have no R&D activities. Without R&D, these enterprises lack the ability to create and absorb the scientific and technological achievements generated by universities and public research institutes.
The second barrier is a lack of long-term financial support. As Reference Tan, Liu and HouTan et al. (2013) observe, most government patent subsidy programs provide funding to patent owners for under five years, which is not long enough to develop and commercialize an invention. Thus, many patents owned by universities, even potentially valuable ones, expire quickly after being granted. Additionally, although many university spinoffs have sufficient initial capital, they lack sustained investment for continuing operations.
The third barrier is ambiguous corporate governance and regulations. Reference Kroll and LiefnerKroll and Liefner (2008) studied knowledge transfer activities in three major research universities in China: Tsinghua University, Zhejiang University, and Wuhan University. They found that universities were only moderately oriented toward the needs of the market. In much of China, the absorptive capacity of spinoff enterprises was low.
Although the 2015 amendment to the PTSTA Law has removed the major legal barriers to knowledge transfer, implementation of the Law has not been without challenges. If academics and researchers from universities and public research institutes receive a share of a newly founded company in return for contributing their technologies, this knowledge transfer is subject to additional approvals because the technology would be considered as state-owned assets. Another challenge is that the calculation of “net profit” in the transformation of scientific and technological achievements is not clearly defined in the Law, and this hinders the provision of rewards and remuneration to inventors and knowledge transfer contributors.
The final barrier is that an underdeveloped intermediary agency sector results in high transaction costs. Reference ZhangZhang (2016) found that many university professors do not license their technology because they do not have the time and experience necessary to conduct business negotiations and perform marketing tasks. There are a limited number of intermediary agencies capable of providing such services to academics.
8.6 Conclusion
Since the 1980s, Chinese universities and public research institutes have been dramatically transformed in order to meet government policy goals of producing cutting-edge scientific and technological developments to support economic and social advancement. In 1985, the Chinese government emphasized the economic orientation of the S&T system by introducing competition and market discipline. In the 1990s, investment in R&D was made a priority in the central and local government budget appropriation and outlays. In 1993, the Chinese government announced a plan to build and develop approximately 100 world-class universities and key academic disciplines through the 211 Project. In 1998, the Chinese government intensified the development of world-class universities by starting the 985 Project. With continuous and strengthened funding, Chinese universities and public research institutes were able to make progress in knowledge and technology production, reflected in an increasing number of scientific publications and patent applications.
The basic legal framework governing knowledge transfer from universities and public research institutes to industry in China includes the Science and Technology Progress Law, Patent Law, the PTSTA Law, Contract Law, and Company Law. The PTSTA Law was enacted in 1996 and substantially amended in 2015. The amendment is seen as an important development of the legal system governing knowledge transfer in China. It has made knowledge transfer a legal obligation for Chinese universities and public research institutes. Additionally, it gives universities and public research institutes established by the state the right to dispose of their scientific and technological achievements, including transferring technologies, as long as the price agreed on by both parties in negotiation or auction and the name of the scientific and technological achievements are disclosed to the public. The Law states that no less than 50 percent of the net profit from the knowledge transfer should be given as a reward or compensation to the university or public research institutes inventors and knowledge transfer contributors. These new regulations remove the legal barrier to knowledge transfer in China and provide incentives for inventors within universities and public research institutes to engage more actively in knowledge transfer activities. The full impact of the amendment will be seen in years to come and will deserve further evaluation and study.
With several reforms since the 1980s, the technology market, cooperation between universities and public research institutes with industry, patent transfer and licensing, and spinoff companies from universities and public research institutes have developed rapidly in China. This rapid development was aided by government funding of and support for knowledge transfer and policy measures, such as establishing science parks. However, remaining challenges lie in areas such as the immaturity of technology markets, inadequate research capabilities and R&D investment by Chinese companies, a lack of long-term financial support for patenting and transfer activities, ambiguous corporate governance and regulations, and underdeveloped intermediary agencies.
9.1 Introduction
South Africa is the thirty-fifth largest economy in the world with a population of 57 million and an estimated per capita income in 2016 of USD 13,500 in purchasing power parity (PPP). It is rich in natural resources and has well-established industries, including mining, manufacturing, and agriculture with a strong financial, transport, and communication infrastructure. However, it faces substantial economic challenges, including a low rate of economic growth, one of the world’s highest levels of income inequality, deep structural unemployment, and high mortality rates during the 2000s among the working-age population due to epidemic HIV and tuberculosis.
South Africa’s unique history of apartheid between 1948 and the early 1990s influenced the structure of the public science system and consequently knowledge transfer. During the apartheid period, individuals who were classified as “African,” “Indian,” or “Coloured” (essentially those regarded as being of mixed ethnicity) had limited access to tertiary education and were restricted to attending higher education institutions (HEIs) in predetermined disciplines such as technical training, healthcare, education, administration, and teaching. Only one institution offered medical training. In contrast, the HEIs for the white population, including a network of public research institutions with advanced research capabilities, enabled the early careers of four Nobel Laureates in science and medicine, and supported innovation to circumvent sanctions (Reference Van VuurenVan Vuuren 2017).
Sanctions during the apartheid years drove a need for self-sufficiency, which was met through government-owned enterprises in key sectors, including water, energy, transport, iron and steel, and timber, and major public research institutes known as science councils (Reference BassonBasson 1996). The apartheid-era public research system of HEIs and public research institutes operated according to an implicit social contract of “walking on two legs” (Reference KahnKahn 2013): one leg encouraged “own” science, where research programs were determined by academics and resulted in internationally recognized research papers, while the other provided science and technology for the state, including military equipment and nuclear weapons (Reference KahnKahn 2006; Reference MaharajhMaharajh 2011). Sanctions-induced innovation pressure was met through a mixture of adaptation and reverse engineering involving close collaboration between government, public research, and industry. In this period, the ratio of gross expenditure on R&D (GERD) to GDP reached a peak of 1.04 percent in 1992.
After the adoption of constitutional democracy in 1994, the public research system entered a period of transition in which existing universities were desegregated and new universities established, while research priorities shifted due to the end of economic sanctions. However, the distinction in research capabilities between the historically white institutions (referred to as “traditional universities”) and the historically disadvantaged institutions continues, although efforts are underway to remedy this disparity. This context remains relevant for knowledge transfer in South Africa.
After 1994, there were both new opportunities and challenges. On the plus side, South African services firms were able to take advantage of new opportunities in neighboring African countries. Among the challenges was a decline in domestic manufacturing and mining, a rise in rural–urban migration, a large influx of foreign economic and political migrants, and strains on infrastructure. Various interventions have failed to significantly increase economic growth (Reference HausmannHausmann 2017).
South Africa’s National Development Plan (NDP; Vision for 2030) was developed over the period 2009–11 to tackle the three challenges of unemployment, inequality, and poverty. The plan recognizes science, technology, and innovation as a means of economic development and the necessity for “public funding to help finance research and development in critical areas.” To date, its implementation has been inconsistent.
9.2 The National Innovation System
Over the period of South Africa’s industrialization, a modest-sized, effective national innovation system with sectoral subsystems emerged, notably in viticulture, fruits, cereals, mining and metallurgy, forestry, chemicals, military equipment, health, and telemetry. These sectoral innovation systems survive into the present and have been joined by sectoral systems for automobiles and financial services.
Prior to 1994, the public science system consisted of thirty-six HEIs, including universities and technikons (polytechnic institutes), and several public research institutes, including seven science council research institutes, four national research facilities, over twenty departmental research institutes, and R&D divisions in state-owned enterprises. The technikons had close ties with industry, reflecting their origins in technical and vocational education and training colleges. In addition to public research, the national innovation system was supplemented with private sector research, regulatory bodies, industry associations, and the South African Patent Office (SAPO).
After 1994 the higher education system restructured and merged into a unitary system of twenty-six institutions comprising twelve “traditional” universities, six comprehensive universities, and eight universities of technology (Reference Nongxa and CarelseNongxa and Carelse 2014). One medical school and two of the comprehensive universities were founded after 2009. For ease of reference, the term “university” is used in this chapter for all of these higher education institutes.
Five of the universities are research intensive, while another seven are emerging research universities. The higher education system is the strongest in Africa, with two universities among the top 200 in the Times Higher Education World University Rankings 2016–17.Footnote 1 All five research-intensive universities (the University of Cape Town, the University of the Witwatersrand, Stellenbosch University, the University of Johannesburg, and the University of KwaZulu-Natal) are listed in the ARWU top 500 rankings.Footnote 2 However, the changes to the higher education system weakened the previous linkages between the technikons and industry (Reference Kruss, McGrath, Petersen and GastrowKruss et al. 2015). Institutes that had focused on teaching during the apartheid era largely retained this focus, except when merged with institutes that had prior research competences.
Government is the main source of research funding to the public science sector, via budget allocations from the Ministry of Higher Education and Training and the National Research Foundation. The public research institutes (science councils) include the Medical Research Council, the Council for Scientific and Industrial Research (CSIR), the Agricultural Research Council (ARC), the Council for Geosciences, the Human Sciences Research Council, the Council for Mineral Technology, and the South Africa Bureau of Standards (SABS). Most public research institutes are sector-specific, with the exceptions of the CSIR and SABS.
State-owned enterprises are an important component of the innovation system and include Eskom (power), Transnet (communications), Telkom (telecommunications), Denel (defense industries), Armscor (defense industries), NECSA (nuclear engineering and products), and Onderstepoort Biological Products (veterinary medicines).
The R&D expenditures of the leading research universities, science councils, and state-owned enterprises are given in Table 9.1. In 2013–14 the “big five” research universities accounted for 70 percent of total higher education R&D expenditure, of which 52 percent was for basic research. The two leading science councils accounted for 65 percent of R&D expenditure, of which 23 percent was for basic research, 49 percent for applied research, and the balance for experimental development. This ranking, led as it is by the older institutions, has barely changed in the last fifteen years. Such historic path dependence is true of many other innovation systems.
Table 9.1 R&D expenditure of leading universities, public research institutes, and state-owned enterprises, 2013–14
| Universities | ZAR ’000s | USD ’000s* |
|---|---|---|
| Science Councils (public research institutes) | ||
| University of Cape Town | 1,178,888 | 111,122 |
| University of Witwatersrand | 896,566 | 84,510 |
| University of Stellenbosch | 827,137 | 77,966 |
| University of Kwazulu-Natal | 648,942 | 61,169 |
| University of Pretoria | 644,215 | 60,724 |
| University of South Africa | 605,001 | 57,027 |
| North West University | 585,124 | 55,154 |
| Free State University | 330,182 | 31,123 |
| University of Johannesburg | 252,049 | 23,758 |
| Nelson Mandela Metropolitan University | 216,191 | 20,378 |
| Rhodes University | 211,956 | 19,979 |
| University of the Western Cape | 171,979 | 16,211 |
| State-owned enterprises (SoEs) | ||
| CSIR | 2,095,576 | 197,529 |
| Agricultural Research Council | 1,008,401 | 95,052 |
| National laboratories† | 480,000 | 45,245 |
| Medical Research Council | 390,820 | 36,839 |
| Council for Mineral Technology (Mintek) | 281,883 | 26,570 |
| Human Science Research Council | 244,938 | 23,088 |
| Council for Geoscience | 109,577 | 10,329 |
| Denel | 507,000 | 47,790 |
| Eskom | 130,200 | 12,273 |
| Transnet | 83,200 | 7,842 |
| NECSA* | 74,800 | 7,051 |
| Onderstepoort Biological Products | 32,000 | 3,016 |
In addition to the universities, public research institutes, and state-owned enterprises, the government research and innovation infrastructure includes national facilities (nuclear research, optical, and radio astronomy) managed by the National Research Foundation and research units in environmental science, geomagnetism, and seismology, military R&D, metrology, forensics, biotechnology, and public health.
A unique characteristic of the South African innovation system is that SAPO was and remains a non-examining patent authority that does not assess the novelty of patent applications. Although the cost of obtaining a patent is low, the patent system leads to a proliferation of low-value domestic patents, provides protection to foreign intellectual property, and creates extra costs for firms that need to monitor non-novel patents (Reference Pouris and PourisPouris and Pouris 2011). The system is also likely to reduce the domestic use of formal knowledge transfer based on patents.
The potential economic value of South African patents is therefore best assessed through patents granted in foreign jurisdictions with a patent examination system. Unless otherwise specified, this chapter limits all evaluations of patents to patents filed through the Patent Cooperation Treaty (PCT) system or other foreign registries such as the US Patent and Trademark Office (USPTO).
Financing for innovation in the private sector comes primarily from cash reserves, but also through equity and loan financing from the market, the modest-sized venture capital sector, the state Industrial Development Corporation, and the Public Investment Corporation. More risky innovation activities may be funded from the incentive programs of the Department of Trade and Industry. An estimate of total private sector expenditure on innovation (including R&D and other innovation activities) can be obtained from the Innovation Survey 2005–7 (DST 2011). Adjusted forward, the value would be approximately 100 billion South African rand (ZAR) (USD 8.1 billion) in 2017, with most expenditure on purchases of equipment, technology, and software.
9.3 Post-1994 Science, Technology, and Innovation Policy
Policy on science and technology is vested in the Department of Science and Technology (DST), while industrial policy resides with the Department of Trade and Industry (DTI).
The 1996 White Paper on Science and Technology (DACST 1996) introduced innovation system thinking to shape and manage science and technology policy for economic, sociopolitical, and intellectual benefit. Subsequent policy acts or programs included the National R&D Strategy (DST 2002), the Innovation Fund, the Ten-Year Innovation Plan (DST 2008), an enhanced R&D Tax Incentive (RSA 2008a), and the Intellectual Property Rights from Publicly Funded Research and Development Act (hereafter “the Public Research IP Act”) (RSA 2008b) (see Figure 9.1). New organizations that were established as a result of policy changes included the National Research Foundation as the major grant funder, the National Advisory Council on Innovation, the Technology Innovation Agency (TIA), and the National Intellectual Property Management Office (NIPMO).

Figure 9.1 Major STI policy documents or acts
The R&D Strategy and its successor, the Ten-Year Innovation Plan, outlined objectives and targets that were taken up in other government policy statements, notably the New Growth Path (EDD 2010) and the seminal National Development Plan (Presidency 2012). Constrained by shortfalls of funding, skilled labor and coordination, the goals achieved varying degrees of success. They continue to inform policy, but are not highly directed, with the exception of megascience astronomy projects.
The R&D Strategy shifted from the innovation systems approach advocated in the White Paper to that of a linear, research-led system, whereby investment in R&D was understood to be a precursor to socioeconomic development. This emphasis on R&D influenced the Ten-Year Innovation Plan, the strategy of the National Advisory Council on Innovation, the TIA, and NIPMO.
The next three sections describe South African policies to support the supply of public research, consisting of the outputs of universities and public research institutes, policies to support the innovative capabilities of firms, and policies to support linkages and knowledge transfer between public research and firms.
9.3.1 Policies for Public Research
The public research sector in all countries has multiple goals, commonly consisting of training individuals in useful skills, including the ability to absorb, understand and replicate leading-edge knowledge produced abroad, providing assistance to industry, and producing new discoveries, some of which may have commercial applications.
The DST is not directly responsible for higher education, but has developed mechanisms to boost university research capacity, including the Researcher Rating Scheme, the 200-strong SA Research Chair Initiative, sixteen Centres of Excellence and five Centres of Competence. These receive generous funding and entail a mix of open and directed selection. The National Research Foundation implements these programs, and, in the case of the last three, requires beneficiaries to report on industry and community impacts. In addition, there are a large number of industry-endowed professorial positions (chairs) in mining, engineering, and agricultural sciences as well as chairs funded by state-owned enterprises in roads, water, and telecommunications.
To provide necessary skills, the DST invested heavily in the universities, as well as in the CSIR, the National Facilities and the National Research Foundation. Between 2010–11 and 2014–15, the number of researchers at universities increased by 36.5 percent, from 32,571 to 44,457, compared to a small decline at public research institutes.Footnote 3
The CSIR had a history of “knowledge transfer” through organizational development and transfer (Reference BassonBasson 1996), but its effectiveness declined in the 1980s, leading to a restructuring during the 1990s around strategic business units.
The Higher Education National Funding Formula allocates baseline funding to universities and includes a “publication output” variable that supports science (essential for understanding advances in knowledge) through funding for approved types of publication. This provided funding of ZAR 3 billion (approximately USD 250 million) in 2016.
The Innovation Fund provided competitive funding for research with commercial applications. It initially allocated three-year grants for predefined research areas and encouraged knowledge sharing by prioritizing awards to consortia of universities, science councils, and industry. This restriction was subsequently eased so that any research proposal with commercial applications could be supported. As of 2009, the Innovation Fund was merged into the new Technology Innovation Agency.
Innovation Fund projects that resulted in successful commercialization include microwave technology for egg sterilization and the SmartboltTM rock stress detection device. A costly but unsuccessful project was the Joule electric vehicle, abandoned after the prototype failed to elicit funds for production.
Other publicly funded ventures included four Biotechnology Regional Innovation Centres, structured as single-purpose not-for-profit companies. The combined funding for the Innovation Fund and the Biotechnology Research Centres was approximately ZAR 300 million (± USD 30 million) per year. No evaluative study is available on the contribution of the Innovation Fund or the Biotechnology Research Centres to measures of potential commercial outputs such as IP, startups, or job creation.
The South African Research Chairs Initiative was established in 2006 by the DST and the National Research Foundation with the goal of expanding the research and innovation capabilities of South African universities by attracting and retaining high-quality researchers and increasing the output of master’s and doctoral graduates. The initiative has been successful in fostering cutting-edge research, retaining skills in the country and contributing to the stock of doctoral graduates (Reference Fedderke and VelezFedderke and Velez 2013).
9.3.2 Policies for the Business Sector
From a systems perspective, policy should improve the innovative capabilities of firms. This often takes the form of subsides to encourage firms to invest in capability-building activities such as R&D or to provide skills that would otherwise not be provided by the market. To support firm capabilities, the South African government provides an R&D tax incentive that is designed to boost private sector R&D spending (DST 2015b). Firms initially filed a post hoc claim that would be verified by the DST, but this system was open to misuse. After four rounds, it was replaced with a preapproval model that required detailed submission of the intentions and expected outcomes of corporate R&D. This process appears to have deterred many would-be applicants, particularly SMMEs (small, medium, and micro-enterprises), reflecting a tension between a user-friendly incentive regime and company willingness or capacity to engage in a detailed submission process.
The government has used industrial policy to correct market failure, such as the National Foundry Technology Network to provide skills training, knowledge transfer, and diffusion of state-of-the-art technologies. The 2015–17 iteration of the industrial policy aims to strengthen “linkages between knowledge production, utilisation and innovation and industrial growth” (DTI 2015: 69). The Industrial Policy Action Plan supports R&D-led industry development programs for titanium metal powder manufacturing, fuel cell development, and additive manufacturing. All three are focal areas of the Ten-Year Innovation Plan (DST 2008).
An agency of the DTI, the South Africa Bureau of Standards Design Institute, seeks to use “the broad nature and bridging capacity of design to address the existing innovation chasm by linking R&D with the user, the market, the social environment for the benefit of the country’s socio-economic growth.” To this end, support is given to SMMEs and individuals to move from idea to prototype. The Institute has set up the Transnet Design, Innovation, and Research Centre for SMMEs to research and develop innovative and commercially viable ideas. This is largely a private-to-private knowledge development channel that partially involves universities and public research institutes, for instance, for micro-satellite development.
9.3.3 Policies to Support Linkages between Public Research and Businesses
A common assumption is that the public research sector in South Africa is failing to transfer knowledge with commercial value to the business sector. For example, the annual surveys of the Global Entrepreneurship Monitor (GEMS 2016) find that South African experts believe that universities are not playing a sufficiently constructive role in facilitating knowledge transfer and stimulating innovation. This next section examines the possible causes of low rates of knowledge transfer from the public research sector to firms and then describes policies aimed at addressing those causes.
Failures in Knowledge Transfer
There are two main potential causes of failure. First, the public research sector could be producing very few discoveries with commercial applications. This could occur as a result of a failure in the design of the public research sector, for instance, if there are few incentives for academics to conduct research of potential commercial value (Reference Zhang, Goldberg, Kaplan, Kuriakose, Goldberg and KuriakoseZhang et al. 2011) or to take part in knowledge transfer activities. Reference Sibanda and KaplanSibanda (2009) identified an absence of an entrepreneurial culture among researchers at public research institutes, while Reference Goldberg and KuriakoseGoldberg and Kuriakose (2011) found that insufficient attention was given to the needs of startups, especially business services and IP management. In a study of university research centers, Reference CooperCooper (2011) argued that knowledge transfer was problematic as long as universities focus on “own” research, rather than committing to use-inspired basic research, even though there was strong evidence that research group survival and use-inspired research (on the MIT and Stanford models) went hand in hand. In other words, the nature of the research was a strong determinant of its future commercial value, resonating with similar results in studies by Reference Fedderke and VelezFedderke and Velez (2013) and the National Research Foundation (2016) . Reference Kruss, McGrath, Petersen and GastrowKruss et al. (2015) claim that a policy emphasis on “Big Science, knowledge transfer and the growth of niche competences and capabilities” has created “islands of innovation,” but prevented the widespread diffusion of public research knowledge to industry. The consequence is large variation by sector in the relevance of public research to industry.
Second, the public sector could be producing commercially valuable outputs that are not taken up by firms for a number of reasons: lack of communication between the public and private sectors (network failure), a shortage of funding to support the activities of firms to develop discoveries into commercial products or processes (finance failure), or public research discoveries not meeting the requirements of firms, particularly if firms lack the internal capabilities to exploit them (demand failure).
Reference KrussKruss (2008a) found very few new knowledge networks in evidence in South Africa’s research-oriented universities. The capacity and desire on the part of industry to forge research and innovation partnerships were generally limited. In a subsequent study, Reference KrussKruss (2008b) argues that the lack of commercialization of research arises from a combination of network failure and a lack of “interactive capability” with industry.
Reference KahnKahn (2006, Reference Kahn2013, Reference Kahn2016) identified the influence of the linear innovation model on policy (instead of an innovation system model) as underlying poor performance in knowledge transfer. Ideographic research based on case studies in South Africa found that poor performance is partly due to a lack of two-way communication between public research and firms. Instead, there is implicit adherence to a linear model of innovation whereby scientists follow their own research interests, often in basic research such as the Square Kilometre Array radio telescope. This is reflected in the high proportion of South African gross expenditures on R&D (GERD) for basic research, currently standing at 26.7 percent. Although “blue sky” research can, over time, result in commercial products or processes, such research is rarely of short-term value to firms. Reference Zhang, Goldberg, Kaplan, Kuriakose, Goldberg and KuriakoseZhang et al. (2011: 14) noted that the influence of the linear model was made worse by the fact that the DST was a science-driven organization whose staff had little knowledge of industrial practice.
Reference De WetDe Wet (2001) introduced the idea of the “technology colony” to explain low rates of knowledge transfer in South Africa. This idea became known as the “innovation chasm” due to a lack of funding (finance failure) for early-stage commercialization. Reference Zhang, Goldberg, Kaplan, Kuriakose, Goldberg and KuriakoseZhang et al. (2011) question the reality and utility of the construct of an innovation chasm and suggest that the problem could be due to demand failure, arguing that policy gave insufficient attention to strengthening the absorptive capacity of firms. Reference KaplanKaplan (2011) used patent data to show that mining equipment was the only industry where local expertise was at the technology frontier. Reference Phaho and PourisPhaho and Pouris (2008), in a study of original equipment manufacturers (OEMs) in the automotive sector, determined that most OEMs failed to take steps to improve their capabilities. They did not conduct in-house R&D, did not engage in innovation activities that were new to the market, and did not use government incentives to improve their competitiveness through technology diffusion or intelligence. Reference Fongwa and MaraisFongwa and Marais (2016) studied knowledge transfer in a developing region of South Africa and found that the rate at which knowledge was transferred through the available channels was strongly influenced by the absorptive capacity of firms.
Policies to Address Design, Network, Finance, and Demand Failures
The South African government has implemented policies to address all of these factors affecting knowledge transfer, although their execution has been fragmented and is focused on a linear model of innovation that emphasizes the role of public research in supplying new knowledge.
The Ten-Year Plan for Innovation declared bridging the “innovation chasm” (addressing finance failure) as a key goal, alongside the need to support human resource development, R&D, and knowledge infrastructure (DST 2008: 23).
The Department of Science and Technology’s Sector Innovation Fund and Sector Innovation Programme are responses to a Ministerial Review (DST 2012) to promote networking between researchers, innovators, businesses, and business associations. The Sector Innovation Programme brings together public ministries, industry, industry associations, and public research institutions around common innovation needs. The Programme has been extended to nine sectors, including forestry, sugar, aquaculture, and boatbuilding (DST 2015c: 11).
Both networking and demand failure are targeted through the long-standing Technology and Human Resources for Industry Programme (THRIP) of the DTI. THRIP supports partnerships between industry and public research on a cost-sharing basis. It promotes use-oriented R&D and offers associated high-level training and education for technology development. THRIP supports the mobility of researchers and students between universities, public research institutes, and industry, and improves the competitiveness of the participating business organizations. External evaluation (DPME 2015) found it to be cost-efficient in terms of technology development, with an estimated average commercial revenue of ZAR 24 million (USD 2.4 million) five years after the conclusion of projects.
Other programs to address network and demand failure include the DST’s regional innovation forums, four of which remain functional, and the Bio-economy Strategy. Several regional innovation strategies to promote knowledge transfer and commercialization were also developed. These moves reflect a shift in thinking toward “innovation-enabling ecosystems.” The Bio-economy Strategy seeks to harmonize R&D among various actors in agriculture, health, industry, and environment (DST 2013). In comparison to the earlier linear Biotechnology Strategy (DACST 2001), the new strategy argues for a demand-led, incentive-based approach to build absorptive capacity and stimulate knowledge transfer.
Design failure is partly addressed through changes to the management of IP produced in the public research sector. The 1996 White Paper proposed harmonizing South Africa’s IP regime with international good practice. The 2002 R&D Strategy argued that a version of the US Bayh-Dole Act could promote patent activity in the public sector (DST 2002: 67; DNSH 2017). The subsequent Public Research IP Act instituted benefit-sharing obligations for license income earned by specified public research institutionsFootnote 4 and other policies of relevance to the generation, disclosure, exploitation, and transfer of IP toward small enterprises and BBBEEFootnote 5 entities. The Act required universities and public research institutes to establish knowledge transfer offices, with part of the costs funded by the NIPMO. The Southern African Research and Innovation Managers Association (SARIMA) supports the training of innovation managers and the establishment of KTOs, and works with NIPMO and regional equivalents to advance the commercialization of research discoveries.
9.4 Literature on Knowledge Transfer Channels
How knowledge transfer occurs in South Africa has been examined in a number of studies (Reference KaplanKaplan 2004, Reference Kaplan2008, Reference Kaplan2011; Reference Goldberg and KuriakoseGoldberg and Kuriakose 2011; Reference Kuriakose, Kaplan, Tuomi, Goldberg and KuriakoseKuriakose et al. 2011; Reference Morris, Kaplinsky and KaplanMorris et al. 2011; Reference Zhang, Goldberg, Kaplan, Kuriakose, Goldberg and KuriakoseZhang et al. 2011). Most of this research is based on case studies, in part due to a lack of representative data on knowledge transfer activities.
9.4.1 Informal and Contractual Knowledge Transfer
South African automotive OEMs mainly rely on universities as providers, where needed, of highly qualified personnel, rather than as partners in use-oriented research collaboration that could upgrade their technological capabilities (Reference KrussKruss 2008b).
In the “low” technology wine sector, Reference Cusmano, Morrison and RabelottiCusmano et al. (2010) found that the relationships between industry and public research were based on a mix of informal contacts and industry-commissioned research. Reference Kruss, Visser, Aphane and HauptKruss et al. (2012) reported that most academics interact with the outside community through traditional mechanisms such as training and capacity development, conferences and workshops, action research, contract research, demonstration projects, and services. Consultancy and entrepreneurial engagement was less common, informal, indirect, and not knowledge-intensive. From the industry side, there was low demand for knowledge from, or direct cooperation with, universities on the part of larger innovating firms, but stronger demand from a smaller number of R&D-performing firms.
9.4.2 IP-Mediated Knowledge Transfer
In the six years prior to the promulgation of the Public Research IP Act in 2008, Reference KaplanKaplan (2009) found that there was a dearth of economic studies on the IP system and low awareness of the value of knowledge transfer to the resource industries. IP activity between 2001 and 2007 was low, with only twenty-one patent-based startups produced by the public research sector. Reference Alessandrini, Klose and PepperAlessandrini et al. (2013) note that formalized knowledge transfer is still emerging in local universities and public research institutes.
A case study of three firms active in the southern node of the telemetry sectoral system of innovation (Reference KahnKahn 2014) found that two firms made extensive use of government innovation incentives, while one maintained independence. The case studies show the initial importance of mentorship and academic research to the startup pioneers. As the companies matured they shifted their search for knowledge exchange toward their own value chains. This autonomous behavior accords with the international pattern revealed through innovation surveys.
In a study of the patenting activity of academics, Reference Lubango and PourisLubango and Pouris (2007) concluded that most academic inventors or co-inventors had prior experience with firms or state-owned enterprises. Reference Rorwana and TengehRorwana and Tengeh (2015) surveyed thirty-six academics with research projects with industry and employed at a single university of technology to identify the effect of different factors on their participation in commercialization activities. They report that the personal interest of the academics in innovation had the largest effect on their participation in commercialization activities. No results were reported on the use of IP.
9.4.3 Case Studies
Four case studies (see Box 9.1) of sectoral innovation systems show that the main channels for knowledge transfer in South Africa are informal methods and research agreements. The case studies are based on desk research and interviews.
Box 9.1 Case studies of sectoral innovation systems
Oil and Gas
The South African government established Sasol in 1950 to address uncertainty in fuel supplies. Sasol developed proprietary technologies and is currently a world leader in hydrocarbon synthesis and the largest private sector R&D performer in South Africa. Working with the CSIR, the University of Witwatersrand, and other universities, Sasol developed a gas-to-liquid process that has been implemented internationally. Sasol has a portfolio of 200 product lines. It had 262 co-publications with universities in the period 2011–015. Knowledge transfer to Sasol occurs through formal research projects, the THRIP channel, staff and student mobility, conferences, and seminars. Sasol sees itself as a coordinator of activities across universities to develop expertise rather than specific technologies (Reference MorganMorgan 2006). Its technical success is a demonstration of the importance of early-stage government support.
Pulp and Paper
The two main firms in this sector are Sappi and Mondi. Sappi is the largest South African R&D performer in pulp and paper and the biggest producer of fine paper in the world. Sappi is part of the Gauteng Province Innovation Hub, where it has a pulp R&D laboratory. Its research center in Kwazulu-Natal specializes in genetically improved planting stock. Sappi and Mondi sponsor chairs in forest genomics and tree pathology at Pretoria University. The Tree Protection Cooperative Programme brings together all forestry companies, Forestry South Africa and the Ministry of Agriculture, Forestry, and Fisheries. Sappi collaborates on genetically modified breeding with the Forest Molecular Genetics Programme of the University of Pretoria. The independent, “quasi-public” Institute for Commercial Forestry Research is supported by contributions from its members and hosts its own forty-five-person R&D lab.
Platinum Group Metals
This sectoral system is among the oldest in the country. The leading producer and researcher is Anglo Platinum, followed by Impala Platinum. To boost demand for platinum metal, Anglo-American Platinum constructed a hydrogen fuel cell technology demonstrator for off-grid electricity generation using platinum catalyst fuel cells from the Canadian firm Ballard. The hydrogen Centre of Competence developed local fuel cell technology including the necessary catalysts, membrane technology, casings, and control systems, and has collaborated with Impala Platinum to trial the fuel cell prototype in a forklift vehicle. A Web of Science search shows fifteen co-publications with Anglo-American Platinum, one public research institute, and South African universities. Knowledge transfer occurs through formal research projects, the THRIP channel, staff and student mobility, conferencing, and seminars.
Viticulture
Centers of viticulture research include Stellenbosch University, the Distell Group, the Agricultural Research Council, and the Elsenburg Agricultural Training Institute. Distell is among the top ten producers of wine worldwide. Its in-house R&D is supported by science and technology service firms, specialist manufacturing, yeast providers, and irrigation firms. Reference Cusmano, Morrison and RabelottiCusmano et al. (2010) identify post-1994 deregulation and engagement with world markets as the driver of wine quality improvement. Industry players founded the South African Wine and Brandy Company with both industry and public research participants to provide open-access generic research. Stellenbosch University works closely with industry players and makes ongoing use of the THRIP channel. Informal contacts and industry-commissioned research are an important part of this sectoral innovation system (Reference Cusmano, Morrison and RabelottiCusmano et al. 2010).
The four case studies fall into two groups. The first two, on oil and gas and platinum group metals, display similar hub-and-spoke models with universities, with the main companies (Sasol and Anglo-American Platinum) forming the hubs. Interviews revealed that neither company relied on the flow of research information from universities for its core business. The other two cases, for pulp and paper and viticulture, resemble triple helixes, with universities, companies, and government contributing to research of commercial value. None of the cases exhibits demand-led characteristics; all are supply-side driven, although capacity development is an important goal.
Reference Breschi, Malerba, Breschi and MalerbaBreschi and Malerba (2005) stress the importance of networking and other forms of knowledge exchange in sectoral innovation systems. They note that these systems evolve organically and cannot easily be developed through government fiat. Sasol was a state initiative, although its evolution into a research-led organization was driven internally. Including the Centres of Competence within a sectoral system seems to be left to an evolutionary process.
9.5 Evidence and Metrics of Knowledge Transfer
A major challenge in evaluating knowledge transfer in South Africa is a lack of metrics. Basic metrics are available for innovation activities in South Africa (see Table 9.2) and show a modest level of foreign patents and a low level of high-technology exports. Some metrics are available on the IP-mediated knowledge transfer activities of universities and public research institutes, but there are little comparable data over time. However, the main drawback is a lack of data on informal and contractual forms of knowledge transfer.
| High-technology exports as a share of total exports (UN Comtrade) | 6 |
| US patent awards (USPTO) | 144 |
| Patent Cooperation Treaty (PCT) applications | 442 |
| Trademark applications (ZA resident) (WIPO)* | 19,522 |
| Trademark applications (ZA abroad) (WIPO)* | 5,694 |
| Plant cultivars in force; world share (%; global rank) (UOPV) | 2,710; 2.6; 8 |
| Sales of innovative products, billions (Innovation Survey 2005–7) | ZAR 370 (USD 30) |
South Africa has sought to develop a regular series of innovation surveys similar to the EU Community Innovation Survey (CIS). The best quality data are from the 2005 survey, which achieved a satisfactory response rate. The question on knowledge sources in that survey is relevant to knowledge transfer. The most widely cited important sources of information for innovation are suppliers and customers, cited by 43.9 percent of industrial firms and 26.2 percent of firms in the services sectors (see Table 9.3). Universities and public research institutes are less commonly cited as important sources, with only 9.9 percent of industrial firms citing higher education institutes and 6.1 percent citing public research institutes. Within industry, a higher share of manufacturing than mining firms give a rating of high importance to higher education and public research institutes, while firms in transport and communications and scientific and technological services (STS) are more likely to report linkages with public research than firms in trade or financial services.
Table 9.3 Share of innovative firms rating sources of information for innovation as “highly important”
| All industry | Mining | Manuf | All services | Trade | Transport and comms | Financial services | STS* | |
|---|---|---|---|---|---|---|---|---|
| Within the firm | 54.3 | 56.1 | 54.3 | 44.9 | 44.8 | 41.2 | 75.0 | 47.8 |
| Suppliers | 25.7 | 14.0 | 25.9 | 23.1 | 23.0 | 18.9 | 12.5 | 29.3 |
| Clients/customers | 43.9 | 45.2 | 43.7 | 26.2 | 27.3 | 18.0 | 8.3 | 26.4 |
| Competitors | 15.9 | 33.0 | 15.5 | 9.7 | 9.8 | 9.3 | 4.2 | 9.5 |
| Consultants, labs or private R&D | 6.2 | 10.2 | 6.1 | 1.8 | 0.7 | 6.4 | 4.2 | 7.2 |
| Higher education | 9.9 | 0.0 | 10.2 | 1.1 | 0.1 | 4.5 | 0.0 | 6.2 |
| Govt. and public research institutes | 6.1 | 0.8 | 6.3 | 0.9 | 0.1 | 4.3 | 0.0 | 4.8 |
| Conferences, trade fairs, exhibitions | 3.5 | 0.0 | 3.6 | 1.1 | 0.8 | 2.3 | 0.0 | 2.6 |
| Journals/trade publications | 5.7 | 1.4 | 5.8 | 2.2 | 0.5 | 9.6 | 0.0 | 9.4 |
| Professional assoc. | 0.8 | 2.0 | 0.8 | 15.5 | 16.1 | 12.2 | 0.0 | 14.8 |
* STS = scientific and technological services.
The results in Table 9.3 indicate that the South African public research sector is less important than several other sources of information for innovation, but this is a common pattern in many countries. Comparable data are available from Eurostat for the CIS 2008 survey, covering the three years from 2006 to 2008.Footnote 6 Limited to innovative manufacturing firms in six high-income countries (Belgium, Finland, France, Germany, Italy, and the Netherlands), an average of 22 percent of firms gave high importance to suppliers and 29 percent to customers as sources of knowledge for innovation. The comparable share of innovative European manufacturing firms that gave high importance to universities and public research institutes is much lower, at 2.7 percent and 1.6 percent. Note that this is considerably lower than the percentages for South African manufacturing firms of 10.2 percent for universities and 6.3 percent for public research institutes, indicating that the public research sector plays a greater role in private sector innovation in South Africa than in high-income European countries.Footnote 7 One explanation could be a continuing tradition in South Africa of greater state involvement in economic activity.
The results in Table 9.3 indicate that there are ample linkages between the public and business sectors in South Africa compared to Europe. The common assumption that this is not the case could be due to the lack of representative metrics on informal and contract-based knowledge flows, with the available data on IP-mediated knowledge transfer not capturing the main knowledge flow channels in South Africa.
There are several other sources of data on knowledge transfer from public research to firms, including bibliometric data on co-publications between public research and industry partners, R&D survey data, data published by universities and public research institutes, and a recent survey of KTOs on IP-mediated knowledge transfer.
The major research universities publish annual reports that include the number of research contracts, rated researchers, research chair holders, publication units, invention disclosures, patent applications, patent grants, and outbound transfer agreements. Even so, these reports do not follow a standard format, so comparable data are not readily available. In addition, some financial data are provided for total research income, the value of research contracts, equity held in spinout companies, and income from the exploitation of IP.
In general, the universities provide little information on their formal involvement in promoting new businesses and jobs. One exception is the University of Cape Town (2015), whose annual research report provides details of earnings, licensing, patent activity, and spinouts. Table 9.4 provides results for four research-intensive universities. Little is known about the performance of the various private companies established by universities, since private companies are not required to place such information in the public domain.
| Total R&D expenditures (ZAR billion) | IP cost (ZAR million) | KTO cost (ZAR million) | Number of invention disclosures | Number of technologies* | Number of licenses | Number of patent families | |
|---|---|---|---|---|---|---|---|
| University of Cape Town | 1.18 | 4.8 | 3.3 | 41 | 108 | 17 | 104 |
| Witwatersrand | 0.89 | 9.2 | 4.6 | 37 | 126 | 111 | |
| University of Kwazulu-Natal | 0.65 | 0.5 | 1.0 | 10 | 18 | 7 | |
| University of Johannesburg | 0.25 | 0.8 | 4.2 | 14 | 8 |
* A technology is the embodiment of a single innovative idea. Multiple technologies can arise from a single invention disclosure or a single technology can result from a combination of disclosures.
Three of the public research institutes, Mintek, the ARC, and the CSIR, use sector-specific metrics to demonstrate socioeconomic impacts, knowledge transfer, and commercialization success. The ARC collects data on the number of registrations for plant breeders’ rights for plant cultivars. The CSIR provides metrics on “demonstrator” implementation such as the Technology Readiness Level, characterized by protocols for rolling out a demonstration project. These “metrics” of knowledge transfer are certified for validity and reliability through the Office of the Auditor General prior to their submission to Parliament.
9.5.1 Metrics of Non-IP-Mediated Knowledge Transfer
Non-IP-mediated knowledge transfer includes informal methods such as hiring university graduates and contacts with university staff that are not based on a payment to the university, plus formal methods such as collaborative research, consulting, and contracting.
South Africa’s total publication output rose from 0.39 percent of world publications between 1996 and 2000 to 0.63 percent between 2011 and 2015 (NACI 2016). There is also extensive co-authorship between South African and foreign academics, creating opportunities for inward knowledge transfer. However, a search on the Web of Science for the period 2005–15 did not find any co-publications between the major foreign patentee firms active in South Africa and South African universities.
The South African R&D Surveys record a greater number of R&D collaborations between local firms and universities than with public research institutes, supporting the results of the innovation survey. The flow of funds from firms to universities amounts to 8 percent of higher education R&D (HERD), while that to public research institutes is 10 percent of their expenditure on R&D (DST 2015a). Given that universities use some of these funds for studentships, this suggests more extensive R&D collaboration with public research institutes. In addition, industry R&D collaboration with public research is highly concentrated, with only one-sixth of 600 firms that received an R&D tax incentive reporting collaboration with either universities or public research institutes.
9.5.2 Metrics of IP-Mediated Knowledge Transfer
The 2008 Public Research IP Act gave incentives to public sector researchers to patent and commercialize their inventions, while funding to defray patent application costs was also provided. The preferred patenting route is the Patent Cooperation Treaty (PCT), to which South Africa acceded in 1999. The output of commercially valuable knowledge from universities and public research institutes can be tracked via PCT filings and USPTO assignments. South African patent applications via the PCT nearly tripled between 2000 and 2013 in three stages – up to 2004, from 2005 to 2012, and from 2013 onward. The post-2004 increase could be due to the support of the Innovation Fund for IP activity and subsidization of the costs of PCT filing. The distribution of PCT filings over the period 2009–15 shows a shift from the private sector and public research institutes toward universities, with Stellenbosch University the most prolific, followed by industry giant Sasol and the University of Cape Town. The five universities with the most patents are Stellenbosch, Cape Town, Witwatersrand, North West, and Pretoria. The top two public research institutes are the CSIR and the ARC.
The number of USPTO patent awards by South African organizations has increased slightly from 2011 onward, with Sasol in first place followed by the CSIR and United States of America (U.S.)’s company Amazon. There has been a significant shift away from the mineral resources sector – hardly surprising in that gold production has declined by 83 percent from its 1970s’ peak, while platinum exports have remained static. Gold and PGM miners have restructured and in some cases moved their primary listings abroad. Eskom, Denel, and Mintek (previously important patentees) recorded no USPTO patents in the period 2011–15. Another significant change in the identity of assignees is the participation of local universities, namely Witwatersrand, Cape Town, and Northwest.
A survey by the DST, NIPMO, SARIMA and HSRC (DNSH 2017) (the inaugural South African National Survey of Intellectual Property and Technology Transfer at Publicly Funded Research Institutions) collected data on formal knowledge transfer activities of up to twenty-five universities and eleven public research institutes for fiscal year 2013–14. The questionnaire followed that of the Association of University Technology Managers (AUTM) in the U.S. Most of the questions collected data on inputs (research expenditures) or outputs (invention disclosures, patents, startups, etc.).
The results, given in Table 9.5, identified fifteen startups in the 2013–14 fiscal year and 315 international patent applications, which is almost 50 percent higher than the number of domestic patent applications. The survey also found that there were twenty-eight licenses in 2013–14. License revenues totaled ZAR 35.6 million (USD 3.4 million) compared with aggregate expenditures of ZAR 86 million (USD 8.1 million) for knowledge transfer costs such as maintaining a KTO. Based on the experience in Europe and the U.S., some institutions are likely to have earned revenues that more than covered their costs while the majority were likely to have revenues below costs.
Table 9.5 Metrics of the knowledge transfer activities of South African universities and public research institutes, fiscal year 2013–14
| N | Metric | |
|---|---|---|
| KTOs | ||
| Share of universities/PROs with a KTO | 36 | 92 percent |
| KTO budget (ZAR) for all reporting KTOs (ZAR)* | 24 | 86 million |
| Total expenditure on patent applications (ZAR) | 24 | 36 million |
| Non-patent IP metrics | ||
| Number of invention disclosures | 22 | 306 |
| Plant cultivars filed | 21 | 19 |
| Designs filed | 22 | 10 |
| Number of startups established | 22 | 15 |
| Patenting | ||
| Number of international patent applications | 22 | 315 |
| Number of domestic patent applications | 22 | 216 |
| Number of international patent grants | 21 | 76 |
| Number of domestic patent grants | 21 | 32 |
| Licensing | ||
| Number of licenses with firms (including startups) | 22 | 28 |
| Share of licenses with internationally owned firms | 22 | 79 percent |
| Percentage of licenses based on a patent | 20 | 69 percent |
| Percentage of licenses earning revenue | 19 | 35 percent |
| Total license income earned (ZAR) | 22 | 35.6 million |
| Share of license agreements with startups or SMEs | 21 | 88 percent |
| Share of exclusive license agreements | 23 | 54 percent |
| Amount of research funding provided by businesses (ZAR) | - | 1.08 billion |
| Share of license revenue in total business research funding | - | 3.3 percent |
N: number of reporting universities and public research institutes.
* Excludes expenditures for patent applications.
Of particular interest is the finding that 79 percent of licenses were given to foreign-owned firms, suggesting that there is very little IP-mediated knowledge transfer to domestic firms. This could also explain the higher number of international patents. With data for only one year, it is not known whether the large role of foreign-owned firms as recipients of formal knowledge transfer is a one-year anomaly or a long-term characteristic of the South African innovation system.
With greater experience, it is likely that knowledge transfer outcomes will increase in the future. During 2013–14, 52 percent of the 100 staff employed by KTOs had under four years’ experience. Many are on contract, with their salaries paid by NIPMO. This intervention has been critical to establish capacity and build experience, which is mostly obtained on the job.
Unfortunately, the study did not collect data on non-mediated forms of knowledge transfer such as through research agreements, but it did collect data from twenty-four KTOs on the level of impact (high, moderate, or no impact) of four obstacles to knowledge transfer: (1) inadequate awareness on the part of research staff of the need to disclose and manage IP, (2) inadequate funding for the KTO, (3) inadequate funding for IP registration costs, and, (4) a lack of specialist resources. Two obstacles were given a high impact rating by 42 percent of respondents: inadequate KTO funding and a lack of specialist resources, while the other two (inadequate awareness and lack of funds for IP registration) were given a high impact rating by 25 percent of respondents. In addition, 75 percent of respondents cited a lack of awareness among research staff of the need to disclose their inventions as a medium-impact obstacle. This indicates that formal methods of knowledge transfer are in a state of infancy.
9.5.3 Impacts of Knowledge Transfer
The Technology Innovation Agency commissioned an Economic Impact Assessment for the period 2011–16 (Urban-Econ 2016) which estimated that expenditures of ZAR 6.0 billion (USD 600 million) contributed to ZAR 1.7 billion (USD 170 million) of economic activity with an aggregate employment multiplier of 4.66. Specific cases of knowledge transfer were not studied in this evaluation.
The largest science council, the CSIR, has not provided an impact assessment of all its activities, although individual CSIR divisions have published occasional impact studies.
In contrast, the ARC publishes impact assessments of a range of its activities.Footnote 8 For example, an assessment of grain crop activities (involving the ARC, Grain SA, the University of Pretoria, seed companies and its parent government department) reports that the knowledge transferred through new cultivars between 1997 and 2012 resulted in a massive 3,700 percent return on investment to maize production. ARC research on peach and nectarine cultivars released to local producers demonstrated a rate of return of 56 percent, while that for plums was lower at 14 percent.
Until recently, there was a poor track record of independent evaluations of public research institution activities, let alone use of their findings. The establishment of the Department for Planning, Monitoring and Evaluation (DPME) and a Centre of Excellence in Scientometrics and Science Policy at Stellenbosch University signal new capabilities for conducting evaluations to advance policy learning.
The above discussion points to significant gaps regarding knowledge transfer from universities and public research institutes to businesses that may lead to economic or social impact. There appear to be no studies of the links between university/public research institute activity and the formation of new enterprises and job creation. Impact assessment post hoc – let alone ex ante – is also thin on the ground. The fact that a compliance culture is in place may serve as the starting point to engender more routine impact assessment with associated data collection. An evaluation culture is emerging, although organizations tend to prioritize compliance with Auditor General reporting requirements over engaging in evaluation to serve as corrective and learning devices.
9.6 Conclusions
A number of factors have limited the flow of knowledge from public research to businesses in South Africa. These include high levels of basic R&D that support the “own science” agenda of skilled researchers. Without top-down steering toward national imperatives, a shift toward use-inspired basic research, built on close interactions between public research and businesses, will not occur in the foreseeable future. In any case, a change toward use-inspired research will also require actions to improve the demand for university research, which requires greater capabilities on the part of a broad spectrum of South African firms. Otherwise, the national innovation system will continue to consist of “islands” of expertise in research and innovation through which researchers advance their professional and commercial interests.
South African universities have adjusted to the requirements of the 2008 Public Research IP Act by establishing KTOs and implementing practices to support knowledge transfer. All universities had already set up or were in the process of setting up a trading entity to house startups or IP, and to put a stop to academics acting as commercial service providers. This was balanced with a range of staff incentive schemes to promote commercialization.
Those universities that had experience in IP management before the Public Research IP Act were well-equipped to adapt to its introduction. Some universities developed full-cost business models to encourage firms to contract R&D while retaining full IP rights. This would appear to have induced some new contracts, yet there were concerns that the substantial business funding of university research would decline. Interviews found that universities were generally positive as to the role of NIPMO and financial support for the cost of patenting, although in one case it was argued that serving the broad community should trump the acquisition of IP rights, which was considered to be “a prestige activity.”
All research universities and public research institutes currently have internal IP management policies. In many instances, these predate the Public Research IP Act. Moreover, “getting close to customers/communities” has been part of the general ethos of universities and public research institutes over the last two decades, in part because of the widespread adoption of “value for money” thinking, but also because of post-apartheid development imperatives. University interviewees noted that pressure to address public and commercial needs comes from institutional boards, communities, and public representatives. This does not mean that public institutions have abandoned their traditional mandates of teaching and research. Actual promotion of the generation of IPR varies considerably. Detecting latent IP does not come easily, and, to this end, some organizations have brought in IP scouts who work with researchers to identify potential invention disclosures. In some cases, staff with commercially valuable IP are allowed to place their students in a business incubator and are given time out to support commercialization.
In contrast, interviews with managers from public research institutes showed that they were less enthusiastic about the Public Research IP Act, arguing that the requirements to share benefits with inventors would put further stress on their bottom line in an already constrained operating environment. This stress is evidenced through a comparison of government funding for R&D. From 2005 to 2014, funding to public research institutes (unadjusted for inflation) rose 3.4 times compared to a 3.8-fold increase for universities. Yet not all public research institutes were concerned about benefit sharing in all circumstances. A major public research institute experimented with giving equity stakes to its researchers and introduced the idea of the “entrepreneur in residence” to promote practical approaches to commercialization.
The interviewees from public research institutes and government also expressed concerns over a lack of policy coherence between the DTI and the DST and believed that differences in mandates hindered knowledge transfer rather than helping it. Policy confusion and mandate creep also limited the effectiveness of incentive schemes that often failed to attract high-quality proposals supported by well-crafted business cases.
More broadly, the underlying and continuing “two legs” social contract characterizes the innovation system and ensures the persistence of supply-side thinking. This in turn creates barriers to knowledge transfer outside the islands of excellence, since the needs of clients or users are of little immediate concern.
The present period in South Africa may be characterized as transitional, as the old order yields to new interests. To support this transition, considerable policy experimentation has taken place since the 1996 White Paper. One of the overarching goals of the government’s National Development Plan was to deploy science, technology, and innovation for economic development. This would necessarily demand effective knowledge transfer. Subsequent policies such as the Innovation Fund, the R&D Tax Incentive, the Public Research IP Act, the Technology Innovation Agency, and the Sectoral Innovation Programmes were designed to support this goal.
The current Presidency of Cyril Ramaphosa is actively soliciting foreign direct investment to modernize and expand infrastructure and equipment in South Africa. The long-term benefits of new investment and modernization will in turn depend on domestic capability to absorb and learn how to use the associated technologies. This is another form of knowledge transfer in which the public research system can play an important role.


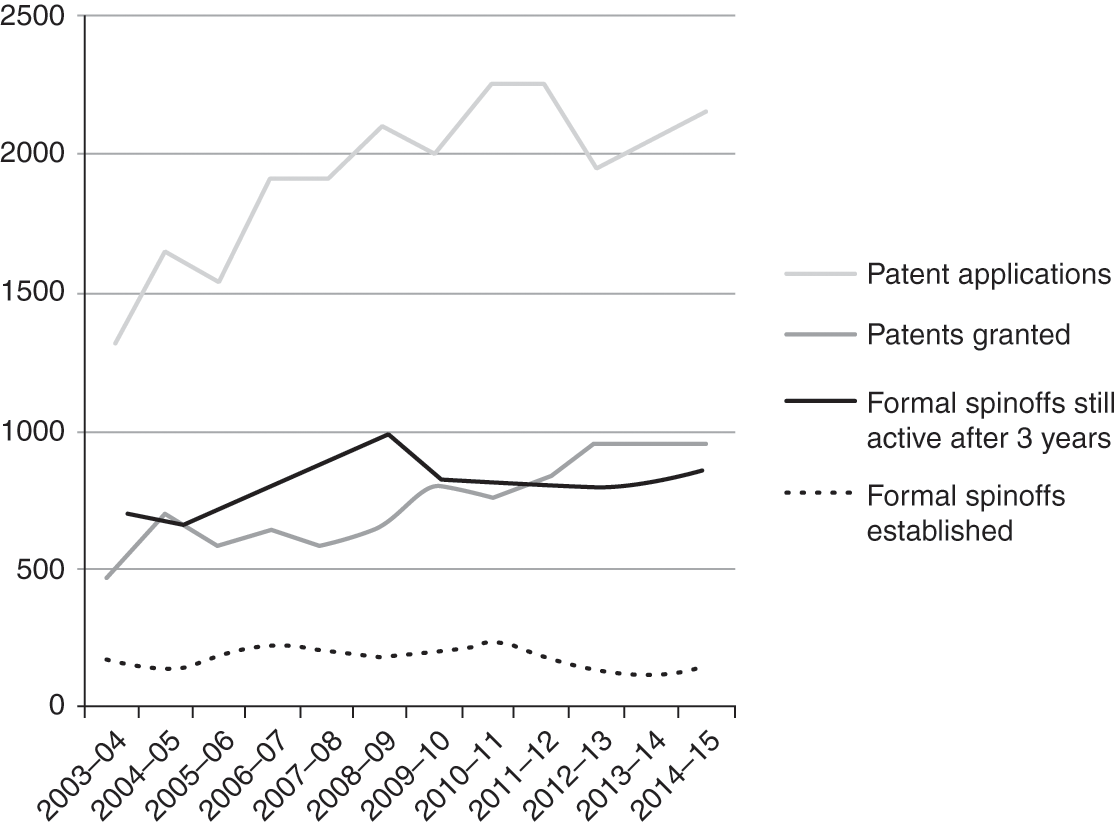


 Open access