


Introduction
Coronary heart disease (CHD) is the leading cause of death in developed countries (World Health Organization, 2011; Roger et al., Reference Roger, Go, Lloyd-Jones, Benjamin, Berry and Borden2012) and its prevention is increasingly a core activity in primary care (Task Force Report, 1998; Wood et al., Reference Wood, Wray, Poulter, Williams, Kirby, Patel, Durrington, Reckless, Davis, Sivers and Potter2005). More recently, the focus of prevention has switched from CHD to cardiovascular disease (CVD) to encompass stroke prevention. Reducing the overall mortality and morbidity of CVD will depend on clinicians being able to accurately predict, treat and motivate individuals who are at high risk to make appropriate lifestyle changes to reduce their disease risk.
Family history of premature CHD is a proxy indicator of genetic predisposition, and has been incorporated into several CVD risk assessment tools [National Cholesterol Education Program Expert Panel (NCEP), 2002; Wood et al., Reference Wood, Wray, Poulter, Williams, Kirby, Patel, Durrington, Reckless, Davis, Sivers and Potter2005; Hippisley-Cox et al., Reference Hippisley-Cox, Coupland, Robson and Brindle2010; National Institute for Health and Clinical Excellence, 2014]. The next logical step is to evaluate assessment for genetic predisposition. Direct-to-consumer marketing of CHD genetic testing is already available online and in some clinics (Holmes et al., Reference Holmes, Harrison, Talmud, Hingorani and Humphries2011). This facility appears to be increasing in popularity, fuelled by media attention and online marketing (Liang and Mackey, Reference Liang and Mackey2011). Several genes are recognized to increase the risk of CHD (The Wellcome Trust Case Control Consortium, 2007; Talmud et al., Reference Talmud, Cooper, Palmen, Lovering, Drenos, Hingorani and Humphries2008; Swerdlow et al., Reference Swerdlow, Holmes, Harrison and Humphries2012). Further, it is suggested that CHD genetic testing increases the accuracy of CHD risk estimation of existing cardiovascular risk assessment tools (Hughes et al., Reference Hughes, Saarela, Strizke, Kee, Silander, Klopp, Kontto, Karvanen, Willenborg, Salomaa, Viramo and Amouyel2012). In combination, these tests may have at least moderate clinical utility, primarily in risk stratification (Drenos et al., Reference Drenos, Whittaker and Humphries2007; Humphries et al., Reference Humphries, Drenos, Ken-Dror and Talmud2010). However, it is likely that different individuals will be identified at above-population risk on genetic assessment compared with conventional cardiovascular risk assessment, the former being more likely to identify risk of premature CHD (Holmes et al., Reference Holmes, Harrison, Talmud, Hingorani and Humphries2011).
The aim of this study is to assess the feasibility of collecting genetic saliva samples and outcome measures for anxiety and lifestyle behaviour change, and presenting the CHD genetic results to participants. This encompasses three specific objectives:
-
∙ Ascertain the response rate to study invitation.
-
∙ Compare the proportion of patients categorized as ‘above-average’ risk (10%+ CVD risk over next 10 years) on conventional cardiovascular risk assessment with those classified as ‘above-average’ risk based on CHD genetic risk assessment.
-
∙ Explore changes in lifestyle and anxiety outcome measures following CHD genetic test-based risk assessment.
Methods
Design, setting and participants
This uncontrolled, before and after, observation study was approved by the Derby Research Ethics Committee. The study was undertaken in 10 British general practices offering cardiovascular risk assessment using a conventional CVD risk assessment tool (Wood et al., Reference Wood, Wray, Poulter, Williams, Kirby, Patel, Durrington, Reckless, Davis, Sivers and Potter2005), and recording CVD assessment codes on their primary care computer systems. Eligible patients were aged 35–65 and had completed a cardiovascular risk assessment at the practice in the previous 18 months. Patients with pre-existing atherosclerotic disease or diabetes mellitus were excluded, as were patients considered by their general practitioners inappropriate for psycho-social reasons.
Procedure
All 177 Nottinghamshire general practices were mailed a letter of invitation, all of whom had already been incentivized to offer CVD risk assessment. A total of 13 general practices expressed an interest in taking part in the study. This comprised three inner-city practices, 10 suburban practices but no rural practices. All three inner-city practices were recruited and the first seven suburban practices agreeing to participate.
On outreach visits, the research team explained to the practices that the genetic assessment results would be presented as ‘at population-average genetic risk’ and ‘greater than population-average genetic risk’. Comparable categories in conventional cardiovascular risk assessment tool were average risk (<10% 10-year risk of CVD), or above-average risk (10% or above 10 year CVD risk). General practices were also informed that, irrespective of genetic assessment result, participants would be advised in their result letter to follow recommended advice for CVD prevention. This simulated a situation where patients could have independently accessed commercial direct-to-consumer genetic testing, and their general practitioners were not directly involved in offering pre- or post-test counselling.
Using bespoke database extraction software in the 10 practices; all participants completing a cardiovascular risk assessment in the previous 18 months were identified. From this list, in each practice, 32 individuals were invited to participate. If there were >32 patients identified, the patients with the most recent CVD risk assessment, who met the inclusion criteria, were selected. Potential participants were posted an invitation letter, together with a consent form. On returning the consent form, participants were sent a saliva collection kit, a family history and baseline lifestyle outcome questionnaire. The participants sent both this kit and the questionnaire back to University College London genetic laboratory. Four weeks after receiving the kit at the laboratory, the research team sent letters to the participant and general practitioners informing them of the results. Together with advising the participant if their original CVD risk assessment was categorized as average (population) risk or above-average risk, the result letter stated if participants were at average risk, or above-average risk, based on the genetic assessment. They were also sent a healthy lifestyle information sheet. Follow-up lifestyle outcome questionnaires were posted at eight months.
Process measures
The retention of participating general practices was documented, as was the proportion of invited patients who completed the saliva genetic test and outcome questionnaires at baseline.
Outcome measures
CVD risk assessment
Conventional risk assessment: This assessment was based on clinical data collated in patient’s general practice records. Those with cardiovascular risk scores <10% CVD risk over the next 10 years were classified as average risk, while those with risk scores ⩾10% CVD risk were classified as above-average. The latter category combines two risk categories in conventional cardiovascular risk assessment tools: 10–19% risk categorized as ‘Moderate’ CVD risk category, while 20% or more risk categorized as ‘High’ CVD risk.
As part of the conventional cardiovascular risk assessment, a family history of premature CHD was identified from information collated in the self-administered family history questionnaire. In line with CVD risk assessment guidelines (Wood et al., Reference Wood, Durrington, McInnes, Poulter, Rees and Wray1998; Reference Wood, Wray, Poulter, Williams, Kirby, Patel, Durrington, Reckless, Davis, Sivers and Potter2005), a family history of premature CHD was defined as coronary heart disease in a male first degree relative <55 or female <65.
Genetic-based risk assessment: Saliva samples were analysed by the Cardiovascular Genetics Laboratory at University College London. Deoxyribonucleic acid (DNA) was isolated from buccal cells using Oragene-Saliva kits (DNA Genotek, Kanata, Ontario, Canada). Nine single nucleotide polymorphism (SNPs) in eight different genes (Supplementary Table 1) were identified, with reported genotype accuracy of >99.5. All nine SNPs are associated with CHD risk in published meta-analyses (for references see Supplementary Table 1). For each individual the combined risk profile score, classified as being at ‘average genetic risk’ or ‘above-average genetic risk’, was estimated by counting the number of relevant SNPs carried. In line with other genetic risk prediction scores, those with more than six SNPs were classified as at ‘above-average risk’ (Drenos et al., Reference Wood, Durrington, McInnes, Poulter, Rees and Wray2007).
Anxiety
High levels of anxiety have been reported in patients participating in a range of screening programmes (Marteau, Reference Marteau1989), and measuring changes in anxiety was therefore considered an important measure in this feasibility study. This was assessed using the six-item State version of the Spielberger’s State-Trait Anxiety Inventory (STAI) (Marteau and Bekker, Reference Marteau and Bekker1992). Each item has a scale to describe the feelings of the participant at that point in time which ranges from ‘not at all’ to ‘very much’. Scores range from 4 to 24 with 24 indicating the maximum level of reported state anxiety. The shortened form of the STAI was derived from the long form 20-item Spielberger’s (1983) State-Trait Anxiety Inventory. This was originally developed as a research instrument to study anxiety in normal adult population samples, not to detect casedness for clinical anxiety. Normative data are available for the full 20-item STAI and the short form can be compared with this by pro-rating. However, different studies have produced different normative scores depending on the population being studied (e.g., age, gender, health intervention). For this reason the short version STAI is routinely compared with a baseline measure from the same participant. Further, the short form has been utilized in several primary care genetic screening studies ( Axworthy et al., Reference Axworthy, Marteau, Brock and Bobrow1996; Rose et al., Reference Rose, Humm, Hey, Jones and Huson1999).
Smoking status
This was assessed by measures of smoking status, and stages of change of smoking cessation (Prochaska et al., Reference Prochaska, Velicer, Redding, Rossi, Goldstein, DePue, Greene, Rossi, Sun, Fava, Laforge, Rakowski and Plummer2005). Smoking status classed participants into three categories: current smoker, quitter and never smoked. Number of cigarettes smoked; number of cigars smoked; and amount of tobacco consumed by the participants were also collected. These, with the smoking status variable, enabled calculation of change in smoking behaviour between baseline and follow-up. For analysis, the variables were dichotomized into two categories: those who ‘stayed the same/increased their smoking habit’ and those who ‘smoked less/quit their smoking habit’.
The five stages of change of smoking cessation were also collated and analysed for participants who were current smokers or had quit. For the analysis, the stages of change were dichotomized into two categories: action and maintenance; and preparation, contemplation and pre-contemplation.
Exercise
This was assessed by using a measure of exercise and self-reported stages of change of physical activity. The former was presented as two variables giving the number of minutes spent exercising moderately and vigorously. In line with recent recommendations, scores were combined into one variable, by 1 min of vigorous exercise being taken as equivalent to 2 min of moderate [U.S. Department of Health and Human Services (DHSS), 2008]. For analysis, the score was then categorized into three bands, where participants exercising for 0–149 min were labelled as ‘inactive/sedentary’; 150–299 min were labelled as ‘medium’; and participants exercising 300 min and above were labelled as ‘high’ (DHSS, 2008). Similar to smoking, the five stages of change items were dichotomized into two categories: action and maintenance; and preparation, contemplation and pre-contemplation.
Dietary fat intake
This was assessed by measures of dietary fat intake and of stages of change for fat intake. For the former, the Dietary Instrument for Nutrition Education (DINE) instrument was used to calculate dietary fat rating score (Roe et al., Reference Roe, Strong, Whiteside, Neil and Mant1994). In line with the author’s recommendations, this score was then categorized into three groups. A fat score of <30 was labelled as ‘low’; 30–40 was ‘medium’; and above 40 was ‘high’. The five stages of change items for fat intake were dichotomized as for smoking and exercise.
All behavioural and psychological outcome measures were assessed by self-administered lifestyle outcome questionnaires.
Statistical analysis
Primary measure of the feasibility study was response rate after invitation to participate in the study. Based on our previous study (Qureshi et al., Reference Qureshi, Armstrong, Dhiman, Saukko, Middlemass, Evans and Kai2012), a response rate of 45% was estimated. To achieve this predicted recruitment rate with a marginal error of 5%, at 90% power, the sample size needed is 268 people. The association between categorical conventional CVD risk assessment and genetic assessment was explored. Changes in anxiety scores between baseline and eight month follow-up were reported using the mean change between scores and analysed using paired t-test. Further, change in proportion achieving self-reported behaviour change at eight months, from baseline, was also determined. In addition, changes in exercise activity, dietary fat intake and smoking status, were evaluated in a subgroup of participants with ‘room for improvement’ in their baseline lifestyle outcome measures (i.e., in those reporting low or moderate exercise levels, high or moderate dietary fat intake, or smoking at baseline).
To elicit the relationship between above-average genetic test result and anxiety, linear regression analyses was performed, adjusting for the outcome at baseline, gender, age, CVD risk score and education.
Results
Practice recruitment
All 10 participating practices recruited patients; 10% (1) of the practices were single handed and 50% (5) had four or more whole time equivalent general practitioners. The list size varied from 2000 to 33 000 patients (mean 9400).
Participants recruited
A total of 119 (37.1%) participants returned satisfactory genetic saliva samples and completed the baseline questionnaires. These were predominately men (58%), with few people from ethnic minorities participating (Table 1); 20% of the participants did not report educational status; but of those who responded 30% had achieved A-levels or higher qualifications. Further, a dietary DINE score could not be calculated in 60% of participants at baseline due to missing data items. Focusing on participants with ‘room for improvement’, at baseline, there were 62 (52%) reporting low or moderate exercise levels, 17 (14%) smokers and 12 (10%) with high/moderate dietary fat intake.
Table 1 Profile of participants completing CHD genetic test and baseline questionnaires
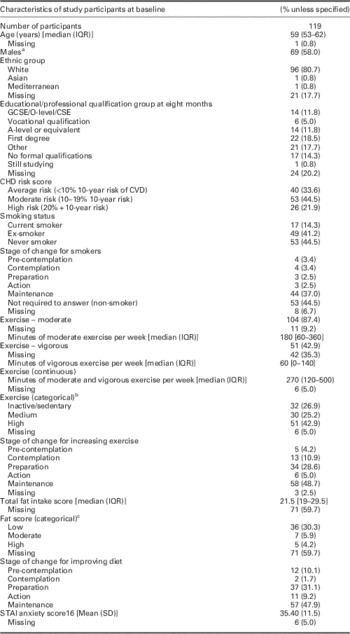
CHD=coronary heart disease; IQR=interquartile range; CVD=cardiovascular disease; STAI=Spielberger State-Trait Anxiety Inventory.
a Of the 50 women recruited, 76% (38) were over 50 years old.
b For exercise level: vigorous exercising includes activities such as running, aerobics, fast bicycling, competitive sports or heavy gardening that causes large increases on breathing. Moderate exercising includes activities such as fast walking, cycling for pleasure, dancing and gardening that cause some increase in breathing. For these categories the amount of time spent vigorously or moderately exercising are combined; 1 min of vigorous exercise equates to 2 min of moderate exercise. Inactive/sedentary relates to patients who are inactive or do <150 min of moderate physical exercise per week; medium relates to patients who do between 150 and 300 min of moderate physical activity per week (inclusive); and high relates to patients who do >300 min of moderate physical activity per week.
c For the total fat: a score of <30 is a low fat intake; a score between 30 and 40 (inclusive) is a moderate fat intake; and a score of >40 is a high fat intake.
Comparing responders to total sampling frame, recruited patients had similar age and gender. There were proportionally lower numbers of patients at high CVD risk (based on conventional CVD risk assessment) in the recruited group. However, there was no statistical difference in CVD risk score categories between total sample and recruited participants (P=0.151).
Outcome measures
Conventional and genetic-based cardiovascular risk assessment
A total of 79 (66.4%, 95% CI 57.2–74.8%) participants were categorized above-average cardiovascular risk on conventional assessment, 65 of whom (82.3%) were only average risk on genetic assessment. In contrast, 23 (19.3%, 95% CI 12.7–27.6%) participants were categorized above-average risk on genetic assessment, nine (39%) of whom were average risk on conventional CVD assessment (Table 2). The discrepancy between assessments was similar in males and females: of 60 male participants categorized above-average risk on conventional assessment, 49 (82%) were only average risk on genetic assessment, while among female participants the discrepancy was 84% (16/19) (see Supplementary Tables 2a and 2b for full details).
Table 2 Cardiovascular risk assessment: comparing categorization between conventional and follow-up genetic risk assessment
CVD RA=cardiovascular disease risk assesment.
From 119 participants, 34% had a family history of CHD in a specified first or second degree relative, this included 13 (11%) participants with a family history of premature CHD in first degree relatives and 16 (14%) in second degree relatives. There was no statistical significant association between genetic risk categories and presence of family history of CHD. This is both where CHD was only in first degree relative (χ2 0.20; P=0.65), and when any first or second degree relative reported the condition (χ2 0.90; P=0.34). Supplementary Tables 3a and 3b further demonstrate this finding.
Anxiety levels
The mean increase in anxiety score between baseline and eight month follow-up for 88 participants, completing the STAI at both time points, was 2.1 (95% CI −0.1–4.3; P=0.06). Irrespective of the risk calculated using either approach (Table 3), there was no statistically significant change in anxiety score between baseline and follow-up. Further, there was no statistically significant difference between anxiety scores at eight months between participants at average and above-average risk based on genetic assessment (unadjusted β, 1.2, 95% CI −5.4–7.9; adjusted β, 3.1, 95% CI −2.1–8.2). With incomplete completion of STAI measures at eight months in 28% of participants, the data was reanalysed by replacing missing outcome data at eight months with four month data or baseline measure (if four month not available) and noted the proportions and change in STAI scores were similar to non-imputed analysis (Table 3) except increase in STAI score following genetic test was statistically significant (5.63, 95% CI 1.45–9.81) in the subgroup where both conventional and genetic assessment risk were categorized as average (Supplementary Table 4).
Table 3 Change in STAI scores at eight month follow-up comparing conventional cardiovascular risk assessment with genetic test-based risk assessment
CVD=cardiovascular disease; STAI=Spielberger State-Trait Anxiety Inventory.
a This is the percentage of each subgroup with inventory completed at baseline and eight months follow-up.
Lifestyle changes
Considering lifestyle change from baseline to eight month follow-up among participants reporting at both time points, the proportion in action/maintenance phase increased by 13% (from 54 to 61) for diet, 2% (from 51 to 52) for exercise, and decreased by 3% (from 35 to 34) for smokers.
A small proportion of participants had ‘room for improvement’ in lifestyle behaviour at baseline, and numbers fell further, when identifying participants with data at both baseline and eight months follow-up (Table 4). Of 46 participants with sedentary or medium exercise levels at baseline (and data at both time points), 17 (37.0%) reported improved activity at eight months follow-up.
Table 4 Changes in lifestyle behaviour for patients with potential room for improvement according to genetic risk assessment categories
a Percentage is out of number with room for improvement and had complete eight-month follow-up data. Improved self-reported behaviour change is improved exercise activity; smoking cessation or reduction; reduced fat intake.
b Percentages are out of total number improved.
Discussion
Summary
Over a third of patients offered CHD genetic testing took up the invitation, and a third of participants reporting a family history of CHD in first or second degree relatives. This study also found that the majority (82%) of participants classified at above-average risk on conventional CVD risk assessment in primary care were classified at only average risk using genetic-based assessment. In contrast, fewer participants (39%) at above-average risk on genetic assessment were classified as average risk on conventional CVD risk assessment.
Strengths and limitations
This is the first study to compare CHD genetic assessment with more conventional cardiovascular risk assessment in primary care, and identifying the practice population’s response to an invitation to a CHD genetic test following conventional assessment. The recruited participants were individuals who had completed conventional cardiovascular risk assessment, in particular those who had lower risk scores. In the near future, the most likely avenue for individuals to take up CHD genetic tests is through direct-to-consumer testing. This may not be a comparable population to those recruited to this study.
This study had limited ability to demonstrate the relationship between change in anxiety and lifestyle risk-reducing behaviour with genetic risk identification. Any lack of effect might be explained by the CHD genetic test following the conventional assessment. At baseline there may have already been some lifestyle change owing to the previous cardiovascular risk assessment. This may partly explain the limited ‘room for improvement’ in lifestyle behavioural change.
Although the study suggested no change in anxiety score with study participation, with the wide confidence intervals and study design, the findings need to be interpreted with caution. Further, to assess the anxiety associated with the offer of genetic assessment, the baseline measure should have preceded the offer.
Comparison with existing literature
Despite the suggestion that personalizing risk, through genetic information, would motivate individuals to change their lifestyle to reduce disease risk, trials and simulated scenario-based studies have yet to demonstrate this (Henrikson et al., Reference Henrikson, Bowen and Burke2009; Marteau et al., Reference Marteau, French, Griffin, Prevost, Sutton, Watkinson, Attwood and Hollands2010; Meisel et al., Reference Meisel, Walker and Wardle2012; Grant et al., Reference Grant, O’Brien, Waxler, Vassy, Delahanty, Bissett and Green2013).
Considering any potentially adverse effects of genetic assessment in this context, the results are consistent with other studies that have reviewed perceptions and attitudes towards direct-to-consumer testing and demonstrated that testing does not lead to anxiety (Bloss et al., Reference Bloss, Schork and Topol2011; Goldsmith et al., Reference Goldsmith, Jackson, O’Connor and Skirton2012). However, there is concern that positive genetic tests will lead to a fatalistic response, with individuals not engaging in risk-reducing behaviour, while those with a negative test results will be falsely assured (Senior et al., Reference Senior, Marteau and Peters1999; Lippi et al., Reference Lippi, Favaloro and Plebani2011).
Implications for clinical practice
Framingham-based and other clinical approaches to cardiovascular risk assessment capture environmental risk factors and gene–environment interactions (NCEP, 2002; Wood et al., Reference Wood, Wray, Poulter, Williams, Kirby, Patel, Durrington, Reckless, Davis, Sivers and Potter2005; Hippisley-Cox et al., Reference Hippisley-Cox, Coupland, Robson and Brindle2010), while genetic testing captures genetic predisposition. The former are being actively offered in British primary care (NHS Health Check Programme, 2009). However, if individuals also opt for commercial direct-to-consumer genetic tests, the discrepancy between more conventional assessment and genetic-based assessment will need to be explained. In this study 62% of conventional and genetic assessment results did not match. Further, a perceived strong family history may be a trigger to pursue commercial testing. General practitioners will likely be the first port of call for these queries, and with their patients, face the challenges of negotiating differing messages from results, family history and attendant perceptions about cardiovascular risk. General practitioners and practice nurses should explore patients’ rationale for undertaking genetic test-based risk assessment and their perceptions of family history and conventional risk assessment (Middlemass et al., Reference Middlemass, Yazdani, Kai, Standen and Qureshi2014). This may help to avoid confusion in patients’ minds reinforcing unhealthy behaviour, for example, when faced with a negative or low genetic risk despite an increased risk on conventional assessment.
Future research
We recognize that larger intervention studies are needed to replicate the current findings, and in particular to better assess any effect on anxiety and lifestyle risk-reducing behaviour. The sample size for a larger study will be informed by the 37% response rate to this feasibility study. Baseline outcome measure questionnaires should be completed before conventional cardiovascular risk assessment and CHD genetic testing. The high proportion of missing values for dietary fat DINE score suggests future studies use an alternative dietary measure. The rationale for making (or not making) any behaviour changes can be further explored through qualitative interviews. Like other studies of cardiovascular risk prevention, we attracted proportionally less individuals from lower socio-economic groups and minority ethnic populations. Greater recruitment of such groups could enable identification of a greater proportion of individuals with ‘room for improvement’ in lifestyle risk-reducing behaviour.
Acknowledgements
The ADDGEN study would like to thank the patients, clinicians and general practice staff for participating in this study. The authors also thank the staff of the British Heart Foundation Cardiovascular Genetics laboratory at University College London.
Financial Support
The study formed part of the National Institute for Health Research (NIHR) task linked funding for ‘Clinical Genetics in Primary Care’ R&D programme. The views expressed in this article do not necessarily reflect those of the NIHR.
Conflicts of Interest
Humphries is the Medical Director and minority shareholder of the UCL start-up coronary heart disease risk genetic testing company Storegene, and has received honoraria for speaking at educational meetings with a pharmaceutical sponsor, but has donated all of these to various medical charities. No other authors reported any potential conflicts.
Supplementary material
To view Supplementary Materials for this article, please visit http://dx.doi.org/10.1017/S1463423615000122


