


Introduction
Residents are often involved in the care of patients in emergency departments (EDs) in both academic centers and community hospitals. However, residents’ effect on wait times is not well studied and the available literature shows conflicting results, due to heterogeneity of study designs and logistical differences between EDs, even within similar regions and health care systems. Current literature from the United States and Europe would suggest that resident physicians either have no impact or increase ED wait times.Reference Lammers, Roiger and Rice 1 - Reference McGarry, Krall and McLaughlin 4 However, the majority of these studies used different time periods for analysis with a before-and-after design, where changes in hospital and health-care-system-based factors between time periods, could also impact wait times, in addition to confounders such as inefficiencies within a newly introduced (yet to be optimized) residency program. Given the discordance in the literature, we designed a robust method to analyze the effect of residents on ED wait times.
We aimed to compare the effect of having residents working alongside staff on ED shifts compared to no residents by measuring patient wait times from initial triage to physician initial assessment time and from initial triage to patient disposition time, and the number of patients leaving without being seen or treated.
Methods
Setting and population
The Strathroy Middlesex General Hospital (SMGH, Strathroy, Ontario, Canada) is a medium-volume community hospital (20,000 to 30,000 visits per year). We used the time period from July 1, 2011 to June 30, 2012 to reflect a resident’s academic year. There were three shifts per day, 7am–3pm, 2pm–10pm, and 9pm–7am, with occasional shifts over statutory holidays differing from these traditional shift times. There was single coverage except for the two hours of overlap for shift change. Residents worked the same shift times as staff physicians. The ED is a 15-bed unit, with eleven high-acuity beds and four low-acuity beds. There is a dedicated low-acuity area; however, it does not have a separate staff physician. There are three nurses 24 hours a day. Residents were able to see patients independently, review with the staff physician, start the workup (either before or after review with the staff), perform charting, write prescriptions, and discuss management plans with patients. After reviewing the case, staff can elect to see the patient too, although this is not done for every patient.
Study design
We designed an observational study using retrospective electronic chart review (PowerChart® [Cerner: London]) for all patient visits during the study period. To define the two comparison groups of staff working alone and staff working with a resident, we collected shift schedules for staff physicians and residents. “Staff physicians” were defined as independently licensed physicians in Ontario who worked at the study hospital. For some of the subgroup analysis, staff physicians were further subcategorized into staff who work mostly alone (worked fewer than 5 shifts with residents over the study year), staff who sometimes work with residents (worked at least 5 shifts alone and 5 shifts with residents over the study year), and staff who always work with residents (worked fewer than 5 shifts alone over the study year). “Occasional staff physicians” were defined as physicians who have worked fewer than 10 shifts in the study year at the study hospital. “Resident physicians” were defined as family medicine residents rotating through the hospital ED, including first and second year residents (PGY-1 and PGY-2, respectively) but excluding third year (PGY-3) fellowship residents. We do not have any emergency specialty residents at our site.
For our study, we included patients of all ages who were registered during any of the regular shift times. Patients were excluded if they were seen during shifts that included a third year fellowship resident or seen during non-traditional shift times. Patients with missing data for any of the time points were also excluded. Shifts with missing staff data were also excluded.
Prior to initiating our research, the study gained approval by the Health Sciences Research Ethics Board at The University of Western Ontario.
Measures
We obtained three time parameters for every ED visit in our wait time model: initial triage time, physician initial assessment time, and disposition or decision to admit time (Figure 1). T1 reflects the duration between initial triage time to physician initial assessment time. Total length of stay (LOS) reflects the duration between initial triage time to disposition or decision to admit time. We also collected data on the number of patients leaving without being seen (LWBS) and patients leaving without being treated (LWBT). Additional variables collected were patient age, gender, triage level, and date and time of visit. Triage levels were defined by the 5-level Canadian Triage and Acuity Scale (CTAS): 1, Resuscitation; 2, Emergent; 3, Urgent; 4, Less urgent; and 5, Non-urgent.
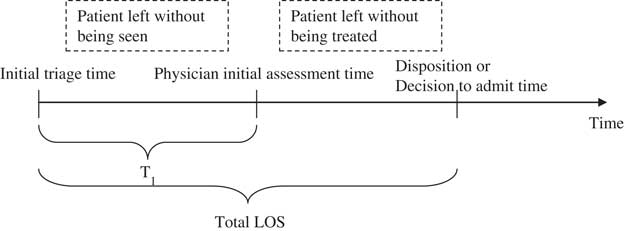
Figure 1 Wait time model, indicating T1 and total length of stay (LOS) derived from initial triage time, physician initial assessment time, and disposition or decision to admit time.
Primary outcome measures were wait times to physician initial assessment (T1), total LOS, percent of patients LWBS, and percent of patients LWBT.
Data analysis
Using shift schedule data, each patient visit was categorized into staff-only or staff-with-resident, based on the initial triage time. Patients registered during the overlap hour of shift changes were assigned to the latter shift for consistency. T1 and total LOS were calculated. Statistical analysis was completed using independent sample t-tests using the total study population and subgroups. Comparisons between more than two groups were performed with one-way ANOVA and Bonferroni post-hoc test. Frequency statistics in demographic variables were calculated with the chi-square test. Using a small effect size (0.10) with a two-sided type 1 error of 0.05 and a power of 95%, the calculated sample size required was 2,093 patients.
Results
During the study period, 23,283 patient visits were triaged, 21,141 (91%) of which were included in this study. Of these patients, 10,959 (52%) were seen when the staff physician was working alone, covering 577 shifts; another 10,182 patients (48%) were seen when the staff physician was working with a resident, covering 490 shifts (Figure 2). Percentages for excluded cases do not add up to 100% because of overlap, with the majority of excluded cases due to irregular shift times, such as 12-hour shifts during the holiday season. In addition, a total of 941 patients left without being seen or treated; thus, these cases were included for relevant LWBS and LWBT analysis, but excluded from further wait time analysis. A total of 53 staff physicians worked during the study period, and as previously defined, 11 staff worked mostly alone (3 with EM certification, either CCFP EM or RCPSC, average 14 years experience), 7 staff sometimes worked with residents (2 with EM certification, average 10 years experience), 4 staff always worked with residents (0 with EM certification, average 16 years experience), and 31 were occasional physicians (16 with EM certification, average 15 years experience). A total of 45 resident physicians worked during the study period. Occasional physicians never worked with residents.
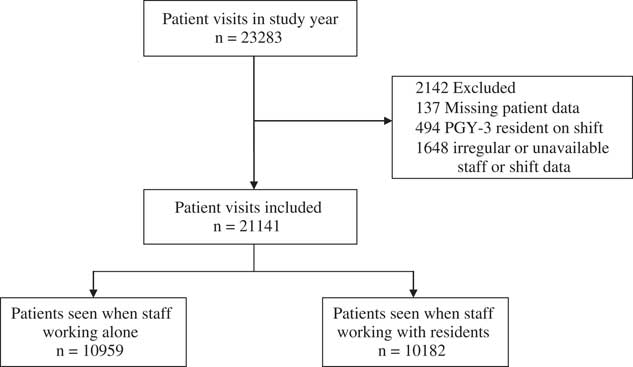
Figure 2 Inclusion of patient visits over study year
Main differences in patient demographics include that the staff-only group was less busy (0.56 fewer patients registered per hour, 95% CI 0.53 to 0.59, p<0.001) and were more likely to be working overnight (45.8% vs 20.4%, p<0.001) than shifts when staff were working with residents (Table 1). Overall, the majority of visits (91%) were triaged as CTAS 3 or 4. The number of patients LWBS was significantly greater with staff-only shifts than staff-with-residents shifts (4.9% vs 2.8%, p<0.001), with no difference in patients LWBT (0.5% vs 0.5%).
Table 1 Characteristics of ED patient visits for staff-only and staff-with-resident groups.

* Unless otherwise specified
Time to initial physician assessment (T1)
Wait times to initial physician assessment (T1) were significantly reduced when staff worked with residents compared to when they worked alone (15 minutes difference, [95% CI 13 to 17], p<0.001). Within subgroups, the reduction in T1 when staff worked with residents remained significant regardless of ED volume, shift time, weekday versus weekend, quarter of the year, or patient disposition to home or admitted/transferred (Table 2).
Table 2 Wait times from triage to physician initial assessment time (T1).

*Indicates subgroups of staff members who never (<5 shifts with residents), sometimes (at least 5 shifts with residents and alone), or always (<5 shifts alone) work with residents. Occasional physicians work <10 shifts at the study hospital over one year. **Non-significant between PGY-1 and PGY-2 residents, p=0.12.
To assess for cluster effect based on individual staff physicians, we looked at a subgroup of seven physicians who sometimes worked with residents, as previously defined. Shifts where staff worked with residents had a significantly shorter T1 than shifts where staff worked alone (25 minutes [95% CI 22 to 28 minutes], p<0.001). Occasional physicians had the shortest T1 while working alone, which may reflect cluster effect. Comparing shifts with first and second year residents (PGY-1 and PGY-2), both significantly reduced T1 compared to staff working alone, with no significant difference between PGY-1 and PGY-2 residents for reducing T1 (3 minutes less in PGY-2 group, [95% CI 0 to 6], p=0.12). Mean T1 based on hour of initial triage is shown in Figure 3a.

Figure 3 Mean wait times based on hour of initial triage, when staff are working alone (solid line) or with a resident (dashed line). Number of patients registered for each hour over one year is represented by the solid bar graph. Two time variables represented are (a) from initial triage time to physician initial assessment (T1) and (b) from initial triage time to disposition time (total LOS).
Emergency department total length of stay (LOS)
Total LOS was reduced when staff worked with residents rather than working alone (12 minutes, 95% CI 8 minutes to 17 minutes, p<0.001). Within subgroups, total LOS was significantly reduced when residents were working, regardless of ED volume or weekday versus weekend (Table 3). Given that the total LOS was reduced by 12 minutes and T1 was reduced by 15 minutes, the time between initial assessment and patient disposition for the staff-with-resident group was actually 3 minutes longer.
Table 3 Wait times from triage to disposition time (total length of stay).

*Indicates subgroups of staff members who never (<5 shifts with residents), sometimes (at least 5 shifts with residents and alone), or always (<5 shifts alone) work with residents. Occasional physicians work <10 shifts at the study hospital over one year. **Non-significant between PGY-1 and PGY-2 residents, p=0.51.
Analyzing a subgroup of seven physicians who sometimes work with residents, as previously defined, shifts with staff working with residents resulted in significantly reduced total LOS compared to shifts with staff working alone (24 minutes, or 13% reduction in total LOS [95% CI 19 to 29 minutes], p<0.001). Comparing shifts with PGY-1 and PGY-2 residents, both significantly reduced total LOS, with no significant difference between PGY-1 and PGY-2 residents on reducing total LOS (1 minute less in the PGY-2 group, [95% CI -4 to 7], p=0.51). Mean total LOS based on initial triage time is shown in Figure 3b.
Discussion
Our study is the first to identify a wait time reduction for physician initial assessment and total LOS for patients when residents worked in the ED. The reduction in total LOS for the staff-with-resident group is a factor of reduced time to initial assessment. We postulate that residents were associated with a shorter LOS due to seeing the patients earlier, reviewing the case, starting the workup, and completing the charting. This process saves the staff physician time, allowing them to attend to other patients. Although the individual patient seen by the resident is likely to stay longer after their initial assessment, because the resident will take more time with the workup and review, the overall effect for all patients seen during the shift is a reduced LOS.
Previous studies have shown either no difference or an increase in wait time with resident physicians working.Reference Lammers, Roiger and Rice 1 - Reference McGarry, Krall and McLaughlin 4 Our study used a single time period to analyze wait times, in order to mitigate the confounding factors of other changes within the ED over time. This approach is different compared to some previous studies that used a before-and-after model based on implementation of a residency program.
One previous study showed that emergency specialty residents increased total LOS in the ED after introduction of the residency program to the study’s hospital site.Reference Lammers, Roiger and Rice 1 Another study evaluating residents’ effects on ED throughput found no difference after residents entered the system.Reference McGarry, Krall and McLaughlin 4 Using a time period during a residents’ strike in Spain, one study demonstrated that shifts where staff physicians worked by themselves resulted in significantly shorter LOS and fewer laboratory and radiographic tests ordered.2 The reduced number of tests was likely a major factor responsible for the reduced LOS.Reference Salazar, Corbella and Onaga In another study in a pediatric ED where residents are always present, patients seen by trainees were associated with a greater LOS of 17 minutes compared with patients seen only by the staff physician, but because residents were always present, the study could not determine residents' effects on mean wait times for the entire department.3 The study concluded that patients seen by residents may have a greater LOS, which is reasonable given that the residents may review the case with the staff physician, take more time thinking about the case, and order more investigations.Reference James, Harper and Johnston
In the ambulatory care clinic setting, observational and survey-based studies showed clinical clerks (medical students) and resident physicians reduced the wait times for patients (time from check-in to initial assessment) but increased overall consultation times. One study found no significant differences in patient satisfaction between patients seen by residents or patients seen by staff physicians.Reference Bestvater, Dunn and Nelson 5 Two other studies showed that residents increase the amount of time spent teaching by the preceptor but reduced the amount of time required for charting, and overall did not affect the amount of time required per patient.Reference Usatine, Nguyen and Randall 6 , Reference Usatine, Tremoulet and Irby 7
Our study also found that there was a reduction in patients LWBS when residents were working. In the literature, improved LOS has been correlated to fewer numbers of patients LWBS.Reference Fernandes, Price and Christenson 8 This improvement has been found to lead to improved patient satisfaction but no firm conclusion can be drawn as to adverse outcomes, as the majority of patients leaving due to prolonged wait times are also of lower acuity.Reference Kennedy, MacBean and Brand 9 , Reference Ibanez, Guerin and Simon 10 Patients who leave the ED without being seen are equally likely as those who were assessed and treated to seek follow-up care.Reference Monzon, Friedman and Clarke 11
Our study found no difference in T1 or total LOS between PGY-1 and PGY-2 residents. The family medicine residency program in Canada is two years long. Previous studies of longer residency programs report that more senior residents training in emergency medicine reduces wait times and provides more effective physician-patient communication.Reference DeBehnke, O’Brien and Leschke 12 , Reference Cramm and Dowd 13 However, one study reported that more senior residents resulted in greater total LOS.Reference Lammers, Roiger and Rice 1
Limitations
Limitations of this study include the lack of true randomization, as it is an observational study with retrospective chart review. There were also differences between comparison groups; for example, shifts with residents tended to be morning shifts while shifts with staff alone were more often afternoon and night shifts. There is also limited ability to generalize the results, given that each ED, even within the same region, sees a different spectrum of patients and has different operating structures. This heterogeneity is also reflected within previous studies of similar research questions, which have resulted in differing conclusions. Our study site is viewed as a rural community hospital, which has been shown in Ontario to have shorter wait times than urban hospitals for both high- and low-acuity patients.Reference Hutten-Czapski 14 Our study also used a small group of physicians, which limited the generalizability to our results to other physician groups and hospitals. For example, in our study, the group of occasional physicians had shorter T1 and total LOS than any other physician group working alone, and this may reflect the individual variability of physicians.
Overall admission rates were low at 6.5%, whereby at urban centers, admission rates are generally much higher. We did not have available data on how many and how long admitted patients waited in the ED, which could contribute to overall wait times in terms of occupying nursing staff and beds; however, given the low admission rate compared to urban centers, we often do not have admitted patients waiting for more than a few hours for a bed on the ward. Our study also did not include medical students, for whom the evidence thus far shows either no impact or an increase on total LOS.Reference Chan and Kass 15 , Reference Gerbeaux, Ledoray and Liauthaud 16 Additionally, this study does not account for how many patients the residents actually saw or the wait times of patients seen first by residents rather than staff physicians; however, this was not the objective of our study, which was to evaluate the overall ED throughput when residents were working by measuring overall wait times. Other outcome measures would also be of value in future research, including return visits to the ED for the same presenting complaint, patient satisfaction, and morbidity and mortality data.
Conclusion
Our study is the first to demonstrate that the addition of resident physicians to a medium-volume rural community ED is associated with improved wait times to physician initial assessment and total length of stay, with fewer patients leaving without being seen. Studies have shown mixed results on the impact of residents on ED wait times, ranging from significantly reduced wait times, in our study, to significantly increased wait times in some previous studies. Our data generate further research avenues, including comparing staff physicians to residents in EDs of different volumes and location, as well as comparing resources use by residents, such as investigations and procedures.
Competing interests: None declared.


