


INTRODUCTION
The densification of natural snow is not a simple process of mechanical compaction caused by the pressure of overlying snow. This process may be more adequately understood as a sintering phenomenon under pressure, similar to pressure sintering or hot press frequently investigated in powder metallurgy and ceramics. According to theories of pressure sintering, rearrangement of particles, dislocation creep and diffusional creep contribute to the process. Rearrangement of ice particles is caused by plastic yielding, particle fracture and sliding between particles. Dislocation creep and diffusional creep are related respectively to the movements of dislocations and vacancies or interstitials in the ice lattice. Recently Maeno and Ebinuma (1983) constructed pressure sintering diagrams of ice and applied them to the densification of snow at polar glaciers. The present paper gives new results obtained by pressure sintering experiments of ice under various pressures and temperatures.
SPECIMENS AND EXPERIMENTAL METHODS
Ice spheres for the pressure sintering experiment were made by spraying and freezing pure water droplets (their electrical conductivities being 1.8 μS/cm at +25°C) in liquid nitrogen. The ice spheres were sieved to give a uniform average diameter of 199 um with a standard deviation of 51 μm.
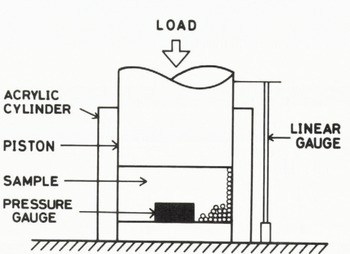
Fig. 1. Schematic diagram of the pressure sintering apparatus.
Figure 1 is a schematic diagram of the experimental apparatus for pressure sintering. Ice particles were packed in an acrylic cylinder of 20 or 58 mm in diameter, and the cylinder was tapped by hand to attain more uniform and closer packing. The initial height of the sample was about 10 mm. Then the sample was compressed by iron disks at a constant pressure and temperature; the applied pressure was calculated by dividing the applied load by the area of the cylinder. The applied pressure was varied between 0.1 and 2.0 MPa, and the temperature between -25 and -9 ±0.5 °C. The change of the sample length was measured using a linear gauge (Kyowa Dengyo DT-Type) and recorded with a strip recorder (Yokogawa Electric Works Type 3056). In some cases, a small pressure gauge (6 mm in diameter and 0.6 mm in thickness, Kyowa Dengyo PS-Type) was set at the bottom of a sample to measure pressure. When the changes in the length and pressure within a sample were rapid, they were measured and recorded at intervals of 10 seconds by using a data logger (Kyowa-Dengyo UCAM5B) controlled by a small computer (Commodore CBM4000).
The strain rate of densification (?) of a sample (density: ρ = m/hs, m = mass, h = height, s = area) is written as
since m and s are kept constant. Time intervals of calculating the strain rate were changed from 10 seconds to 2 hours to take into account their gradual decrease with time. In the calculation, fourth-power fitting was employed to seven consecutive data points and the strain rate was defined as the differential at the middle point.
RESULTS
Figure 2 shows the change of density with time at temperatures of -9 and -25°C. According to measurements with the strip recorder, initial densities immediately after loads were applied were usually between 540 and 620 kg/m3, and the more careful measurements of this initial process with the data logger will be mentioned later. It is seen that the density increased rapidly at first and then more gradually as time progressed. The behavior can be more clearly shown in Figure 3, in which the strain rate of densification is shown as a function of density, applied pressure and temperature. At each pressure and temperature, logarithm of the strain rate was proportional to the density. Also, the slope was noted to change at a critical density. The variation in slope for a given curve in Figure 3 suggests that the mechanism producing densification changes at a particular density.
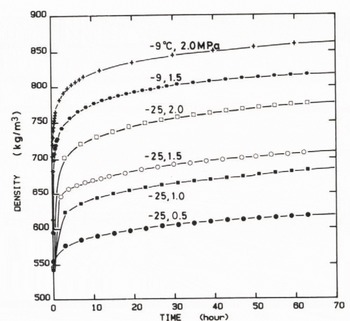
Fig. 2. Density plotted against time.
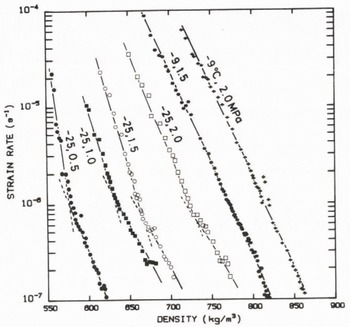
Fig. 3. Strain rate of densification plotted against density.
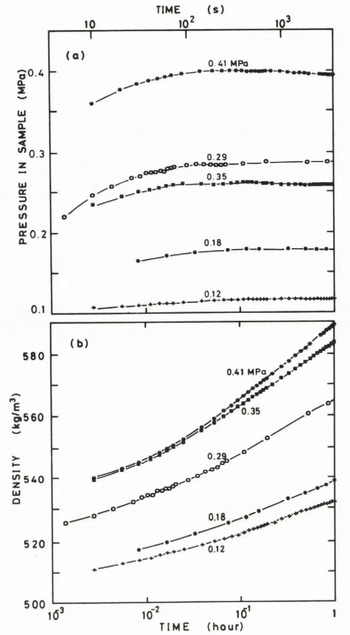
Fig. 4. (a) Time variation of pressure in the ice sample, (b) Time variation of density. Temperature is -15°C and applied pressure is varied from 0.12 to 0.41 MPa.
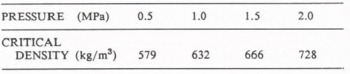
The critical density where slope changed was found to increase with the applied pressure (Table 1), but seemed to have a maximum between 700 and 750 kg/m5. It is not clear at present whether this corresponds to the optimum density (730 kg/ms) found from analyses of core samples drilled at Mizuho Station, Antarctica. At optimum density, contacts between particles are maximum (Maeno 1978).
Figure 4 shows the time variation of density and pressure measured within a sample at the very beginning of densification; the measurement was carried out with the larger cylinder (58 mm in diameter) at a temperature of -15 °C. In each run the measured pressure increased in the first few minutes and reached a constant value close to the applied pressure. Densities at which the measured pressure within a sample became constant are tabulated in Table 2.
Table 1. VALUES OF THE CRITICAL DENSITY AT -25 °C.
The constant measured pressure within a sample is thought to indicate that a stable packing mode was attained in the internal structure. It should be noted that the mode was reached at densities ranging from 520 to 560 kg/m3. This density range is in reasonable agreement with 550 kg/m3, which has frequently been reported as a maximum density attained by mechanical packing of snow in natural snow covers and glaciers (Perutst and Seligman 1939; Anderson and Benson 1963).
Table 2. VALUES OF DENSITY AT WHICH THE INTERNAL PRESSURE BECOMES CONSTANT.
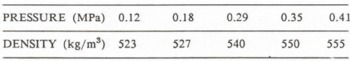
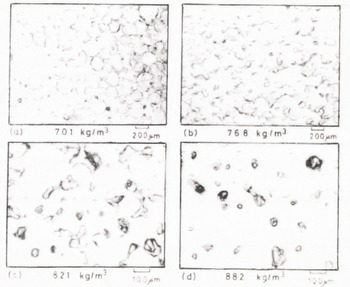
Fig. 5. Photographs of thin sections of samples pressure-sintered to different densities: (a) 701 kg/m3 (-9°C, 1.0 MPa, 6 hours); (b) 768 kg/m3 (-9°C 15 MPa, 8 hours); (c) 821 kg/m3 (-9°C, 1.5 MPa, 75 hours)-(d) 882 kg/m3 (-9”C, 2.0 MPa, 148 hours).
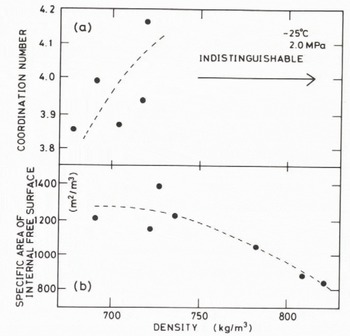
Fig. 6. (a) Two-dimensional coordination number versus density, (b) Specific area of internal free surface plotted against density. The sample was pressure-sintered at 2 0 MPa and -25 °C.
Thin sections of pressure-sintered specimens showed that each ice sphere was distinguishable at lower densities, e.g. 701 kg/m3 (Figure 5a), but became indistinguishable by about 750 kg/m3 (Figure 5b) because of the growth of bonds between particles. This was also recognized by the measurement of two-dimensional coordination numbers (the number of particles with which a particle contacts) as shown in Figure 6a. The coordination number showed a clear increase with density. The specific area of internal free surface, which was measured from thin sections with the method of Smith and Guttmann (1953), did not change greatly at densities below about 750 kg/m3. At higher densities, however, it decreased with increasing density (Figure 6b).
DISCUSSION
Several contribute to mechanisms have been considered to the densificaron of snow; among them, three are important. The strain rate of densification can be expressed in terms of them as
where re, ?dis and ?dif are strain rates due to rearrangement of ice particles, dislocation creep and diffusional creep, respectively, ? is a function of pressure, temperature and internal structure. Here the internal structure refers to the density, the diameter and the packing mode of particles. The present experiments were carried out at a constant pressure and temperature so that ? is only dependent on the internal structure. This is evident in the clear proportionality between In (?) and ρ shown in Figure 3. The variation of the slope in Figure 3 is considered to correspond to the change of mechanisms of pressure sintering at the critical density.
The slope below the critical density is larger than that above it (Figure 3). In other words, the predominant mechanism working below the critical density has a strong dependence on the density, and therefore on the internal structure. This result suggests that the predominant mechanism is related to the process of particle rearrangement.
This interpretation is supported by the increase in the two-dimensional coordination number (Figure 6a) which indicates the relative movement of ice particles to attain closer packing. The predominance of particle rearrangement is also in harmony with the result that the specific area of internal free surface is almost constant below the critical density (Figure 6b). Otherwise the specific area should have decreased due to the probable growth of bonds between ice particles Microscopic observations of thin sections showed that the average diameter of ice particles decreased just after the pressure sintering experiment was initiated, and then increased with time (Ebinuma and Maeno 1984) The first decrease is considered to be caused by local fracture of particles, which accompanies the rearrangement of particles. It should be noted however that the critical density at each experimental condition is dependent on the degree of growth of bonds and modes of deformation and packing. Therefore the Packing mode at each critical density might be different from the closest packing of spheres at which the density is 679 kg/m3 (relative density: 0.74).
At densities above the critical density, each particle can not change its relative position, and further densification proceeds mostly by plastic creep. According to a pressure-sintering diagram (Figure 7) constructed by Maeno and Ebinuma (1983) for ice particles of 200 μm in diameter pressure-sintered at -25 °C, most of our experiments (shaded in the figure) are associated with the dislocation creep region. At lower densities, however, our experimental condition is close to the region of yielding, and at higher densities grain boundary diffusion may also contribute. More detailed comparison of measured strain rates with theoretical ones was made by Ebinuma and Maeno (1984), showing that dislocation creep was the most important process in densification at densities higher than the critical density.
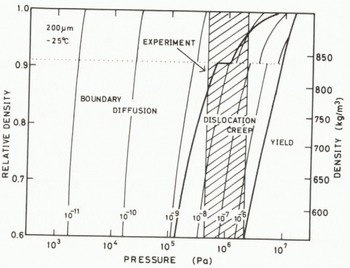
Fig. 7. Pressure sintering diagram for ice particles of 200 urn in diameter at -25°C (after Maeno and Ebinuma 1983 with changes). Contours are strain rates of densification in s-1. The shaded area shows a condition of the present experiments.
ACKNOWLEDGEMENTS
The authors thank Professor S Kobayashi and Dr R Naruse of the Institute of Low Temperature Science, for valuable discussion. The authors also acknowledge the referees for helpful comments. This work was partly supported by a Special Fund for Scientific Research of the Ministry of Education, Science and Culture, Japan, and National Institute of Polar Research.


