


1. Introduction
In accordance with von Liebig’s Law of the Minimum, researchers frequently use plateau production functions to empirically assess the response of crop yields to inputs. Recent studies following Tembo et al. (Reference Tembo, Brorsen, Epplin and Tostão2008) have focused on estimating plateau production functions with stochastic plateaus. Such models incorporate random effects to capture the influence of stochastic events—such as pests, weed pressure, and weather—on crop yield response. Allowing for yearly stochastic variations in the plateau, this approach has yielded an accurate model of plant response and producers’ profit expectations and has since been extended to include additional random parameters and non-linearities (Tumusiime et al., Reference Tumusiime, Wade Brorsen, Mosali, Johnson, Locke and Biermacher2011). While the stochastic plateau production function has been applied to a number of different crops including wheat, winter rye, and cotton (Biermacher et al., Reference Biermacher, Brorsen, Epplin, Solie and Raun2009; Harmon et al., Reference Harmon, Boyer, Lambert, Larson and Gwathmey2016; Roberts et al., Reference Roberts, Brorsen, Solie and Raun2011; Taylor et al., Reference Taylor, Epplin, Brorsen, Fieser and Horn2010), there are relatively few applications in corn yields and most of them have been conducted in Tennessee (Boyer et al., Reference Boyer, Larson, Roberts, McClure, Tyler and Zhou2013, Reference Boyer, Larson, Roberts, McClure and Tyler2014, Reference Boyer, Larson, Roberts, McClure, Tyler and Smith2015).
We use the stochastic plateau model to estimate irrigated no-tillage corn yield response functions to nitrogen in northeastern Colorado. Delgado and Bausch (Reference Delgado and Bausch2005) suggest that farmers in Colorado may apply excessive amounts of nitrogen fertilizer during crop cultivation, which can cause unreasonably high levels of nitrates in groundwater. The overuse of fertilizer also reduces producers’ profits by way of increased input costs. Because of the plateau form of the production function, an increase in the use of inputs does not necessarily translate into a marginal change in output. Based on these observations, we determine economically optimal nitrogen rates in northeastern Colorado, as relatively little is known about optimal nitrogen levels of irrigated no-tillage continuous corn in the study area. We use data from a long-term irrigated no-tillage continuous corn study conducted in Fort Collins, Colorado. This rich data set allows us to evaluate year-to-year weather variability as well as the cumulative effects of the no-tillage practice on corn profitability.
In what follows, our primary objectives include (1) estimating the profit-maximizing nitrogen fertilizer rates and yields for irrigated continuous corn under a no-tillage system, and (2) analyzing expected net returns using the profit-maximizing nitrogen fertilizer rates and yields. Expected profits are estimated using standard methods of Monte Carlo integration, and economically optimum nitrogen rates are calculated using non-linear optimization. In addition, we propose and develop an alternative parameterization of the stochastic plateau model that follows a switching regression (SR) format. This alternative parameterization is proposed as a tool for checking the robustness of the results obtained with the classic stochastic plateau model. Moreover, this alternative can help researchers check if the optimization algorithm used to maximize the likelihood function converged to a local instead of a global optimum. We compare the goodness of fit of the alternative parameterization to the classic stochastic plateau model as a point of reference in the application to no-tillage corn.
Lastly, we compare the reported use of nitrogen among local corn producers and recommended levels from extension services to optimal nitrogen levels estimated in this study. The results of this comparison suggest the overuse of nitrogen with negative impacts on producer profits and presumably poorer environmental outcomes. This suggests that continued work in optimal nitrogen recommendations is warranted, particularly if longer-term experiments allow researchers to bring the advantages of the stochastic plateau production function to bear. By incorporating more variation in weather and other stochastic variables affecting crop response through extended data, agricultural economists will be able to provide more accurate input recommendations and assessments of the economic impacts of input use.
2. Conceptual and Econometric Framework
A risk-neutral producer’s objective is to maximize expected net returns from corn production:
 $${\rm{ma}}{{\rm{x}}_N}\;E\left( \pi \right) = {\rm{p}}E\left( y \right) - {\rm{r}}N$$
 $${\rm{s}}.{\rm{t}}.\;\;\;\;\;\;\;y = {\rm{F}}\left( N \right),\;\;N \ge 0$$
where $E\left( \pi \right)$
is the expected net return ($/ha) for the producer, p is the corn price ($/kg), r is the nitrogen fertilizer price ($/kg),
$E\left( \pi \right)$
is the expected net return ($/ha) for the producer, p is the corn price ($/kg), r is the nitrogen fertilizer price ($/kg), $N$
is the quantity of fertilizer applied (kg/ha), and
$N$
is the quantity of fertilizer applied (kg/ha), and $E\left( y \right)$
is the expected yield (kg/ha).
$E\left( y \right)$
is the expected yield (kg/ha).
In the case of yield response to a single input, Tembo et al. (Reference Tembo, Brorsen, Epplin and Tostão2008) give the general form of the linear response stochastic plateau (LRSP) production function as:
 $${y_{it}} = F\left( {{N_{it}}} \right) + {\varepsilon _{it}} + {u_t}$$
where
 $$F\left( {{N_{it}}} \right) = \min \left\{ {{\beta _0} + {\beta _1}{N_{it}},\;\;{P_m} + {v_t}} \right\}$$
and t indexes over time, i is the plot or location, ${y_{it}}$
is the yield in plot i in year t,
${y_{it}}$
is the yield in plot i in year t, ${N_{it}}$
is the nitrogen applied to plot i in year t,
${N_{it}}$
is the nitrogen applied to plot i in year t, ${\varepsilon _{it}} \sim N\left( {0,\sigma _\varepsilon ^2} \right)$
is a random error term,
${\varepsilon _{it}} \sim N\left( {0,\sigma _\varepsilon ^2} \right)$
is a random error term, ${u_{t}} \sim N\left( {0,\sigma _u^2} \right)$
is an intercept year random effect, and
${u_{t}} \sim N\left( {0,\sigma _u^2} \right)$
is an intercept year random effect, and ${v_t} \sim N\left( {0,\sigma _v^2} \right)$
is a plateau year random effect. In the Tembo et al. (Reference Tembo, Brorsen, Epplin and Tostão2008) specification, the error and random effects are assumed to be independent. The fixed-effect parameters are the intercept
${v_t} \sim N\left( {0,\sigma _v^2} \right)$
is a plateau year random effect. In the Tembo et al. (Reference Tembo, Brorsen, Epplin and Tostão2008) specification, the error and random effects are assumed to be independent. The fixed-effect parameters are the intercept ${\beta _0}$
, the slope
${\beta _0}$
, the slope ${\beta _1}$
, and the average plateau yield
${\beta _1}$
, and the average plateau yield ${P_m}$
.
${P_m}$
.
Tumusiime et al. (Reference Tumusiime, Wade Brorsen, Mosali, Johnson, Locke and Biermacher2011) expanded the model of Tembo et al. (Reference Tembo, Brorsen, Epplin and Tostão2008) by allowing for additional randomness in the slope parameter and relaxing the assumption of independence in the variance parameters. $F\left( {{N_{it}}} \right)$
is then
$F\left( {{N_{it}}} \right)$
is then
 $$F\left( {{N_{it}}} \right) = \min \left\{ {{\beta _0} + \left( {{\omega _t} + {\beta _1}} \right){N_{it}}\;\;,\;\;{P_m} + {v_t}} \right\}$$
and ${\omega _t} \sim N\left( {0,\sigma _\omega ^2} \right)$
is the slope random effect. The random effect (variance) parameters
${\omega _t} \sim N\left( {0,\sigma _\omega ^2} \right)$
is the slope random effect. The random effect (variance) parameters ${\omega _t}$
,
${\omega _t}$
, ${v_t}$
, and
${v_t}$
, and ${u_t}$
are normally distributed and allowed to be correlated.
${u_t}$
are normally distributed and allowed to be correlated.
The addition of these random effects and their correlation helps the production function capture the influence of stochastic events on the yield response. Footnote 1 A closed-form for the likelihood function is not available for both model specifications, but it can be estimated using Gaussian quadrature approximations. Both model specifications can be estimated using frequentist techniques for the estimation of non-linear mixed-effects models. Ouedraogo and Brorsen (Reference Ouedraogo and Brorsen2017) detail an alternative Bayesian approach.
These stochastic plateau specifications are highly flexible and can also incorporate additional non-linearities in yield response. However, the use of the most flexible specifications is often limited in practice by the relatively short samples available from most agricultural experiments. In addition, estimating the expectation of ${y_{it}}$
requires the use of numerical integration. Using the estimates of the parameters of the production function in equation (4), we calculate
${y_{it}}$
requires the use of numerical integration. Using the estimates of the parameters of the production function in equation (4), we calculate $E\left( {{y_{it}}} \right)$
using standard methods of Monte Carlo integration.
$E\left( {{y_{it}}} \right)$
using standard methods of Monte Carlo integration.
2.1 An Alternative Parameterization
We propose and develop an SRFootnote 2 type of plateau production function with random effects. This alternative parameterization of the linear stochastic plateau model is presented as a tool for the robustness check of the main results obtained with the LRSP. It also has the objective of helping researchers avoid local optima when estimating non-linear mixed-effects models. The SR has the direct interpretation of a stochastic level of nitrogen required to reach the yield plateau. It, therefore, represents a complementary specification to the LRSP.
Following Maddala and Nelson (Reference Maddala and Nelson1974), the SR specification for yield response to a single input can be expressed in the same fashion as equation (2). In this case, $F\left( N \right)$
has a threshold point
$F\left( N \right)$
has a threshold point ${\beta _2}{\rm{\;}}$
that includes a random effect such that
${\beta _2}{\rm{\;}}$
that includes a random effect such that
 $$F\left( N \right) = \left\{ {\matrix{ {\left( {{\beta _0} + {u_t}} \right) + {\beta _1}{N_{it}};\hskip 26pt{N_{it}} \lt \left( {{\beta _2} + {\nu _t}} \right)} \cr {\left( {{\beta _0} + {u_t}} \right) + {\beta _1}\left( {{\beta _2} + {\nu _t}} \right);\;{N_{it}} \ge \left( {{\beta _2} + {\nu _t}} \right)} \cr } } \right.$$
The threshold point ${\beta _2}$
is the minimum nitrogen level necessary to reach the plateau yield. As shown in equation (5), the threshold point is an unknown parameter determined by the data.
${\beta _2}$
is the minimum nitrogen level necessary to reach the plateau yield. As shown in equation (5), the threshold point is an unknown parameter determined by the data. ${v_t} \sim N\left( {0,\sigma _v^2} \right)$
represents the
${v_t} \sim N\left( {0,\sigma _v^2} \right)$
represents the ${\beta _2}$
year random effect which shifts the minimum nitrogen level necessary to reach the plateau yield and consequently causes the plateau to shift up or down. Like in the LRSP, here
${\beta _2}$
year random effect which shifts the minimum nitrogen level necessary to reach the plateau yield and consequently causes the plateau to shift up or down. Like in the LRSP, here ${u_{t}} \sim N\left( {0,\sigma _u^2} \right)$
is the intercept year random effect that allows the whole function to shift up or down. Without loss of generality, we can assume no correlation among
${u_{t}} \sim N\left( {0,\sigma _u^2} \right)$
is the intercept year random effect that allows the whole function to shift up or down. Without loss of generality, we can assume no correlation among ${u_{t\;}}\;{\rm{and}}\;{v_{t\;.}}$
Like the LRSP, the SR is an empirical embodiment of von Liebig’s Law of the Minimum and describes a production function where the corn yield increases in a linear fashion with the addition of nitrogen until the threshold point ${\beta _2}$
is reached. This threshold point
${\beta _2}$
is reached. This threshold point ${\beta _2}$
defines the yield plateau; beyond the threshold point, additional nitrogen use will not increase the corn yield.
${\beta _2}$
defines the yield plateau; beyond the threshold point, additional nitrogen use will not increase the corn yield.
By including random effects for all of the parameters, equation (5) becomes:
 $$F\left( N \right) = \left\{ {\matrix{ {\left( {{\beta _o} + {u_t}} \right) + \left( {{\beta _1} + {\omega _t}} \right){N_{it}};\hskip 32pt{N_{it}} \lt \left( {{\beta _2} + {\nu _t}} \right)} \cr {\left( {{\beta _o} + {u_t}} \right) + \left( {{\beta _1} + {\omega _t}} \right)\left( {{\beta _2} + {\nu _t}} \right);\hskip 8pt{N_{it}} \ge \left( {{\beta _2} + {\nu _t}} \right)} \cr } } \right.$$
which is similar to the model specification presented in equation (4). Likewise, the variance parameters ${\omega _t}$
,
${\omega _t}$
, ${v_t}$
, and
${v_t}$
, and ${u_t}$
are assumed to be correlated and normally distributed. Allowing for nonzero covariances permits a richer set of relationships between the random effects.
${u_t}$
are assumed to be correlated and normally distributed. Allowing for nonzero covariances permits a richer set of relationships between the random effects.
The key difference between the SR parameterization and the classic LRSP is the selection of parameters of interest. LRSP treats the plateau yield, ${P_m}$
, as a parameter and adds the random effect
${P_m}$
, as a parameter and adds the random effect ${v_t}$
to
${v_t}$
to ${P_m}$
to account for stochastic effects in the plateau itself. In doing so, LRSP captures most of the stochastic variation of the plateau yield but does not provide the researcher with information on how much of this variation can be attributed to nitrogen use. In contrast, SR treats the minimum nitrogen level to reach the plateau yield as a switching parameter. The yield plateau and its variation are then influenced and determined by this parameter and its random effect
${P_m}$
to account for stochastic effects in the plateau itself. In doing so, LRSP captures most of the stochastic variation of the plateau yield but does not provide the researcher with information on how much of this variation can be attributed to nitrogen use. In contrast, SR treats the minimum nitrogen level to reach the plateau yield as a switching parameter. The yield plateau and its variation are then influenced and determined by this parameter and its random effect ${v_t}$
. This parameterization is an advantage if one wishes to explore how much of the yield plateau variation can be attributed to nitrogen use.
${v_t}$
. This parameterization is an advantage if one wishes to explore how much of the yield plateau variation can be attributed to nitrogen use.
The impact of the random effects of this parameterization can be shown graphically. Figure 1(a) represents the shifts caused by random effect ${u_t}$
, which adjusts the production function across the entire domain of the input. The adjustment in terms of yield is constant across the level of nitrogen. Figure 1(b) shows the plateau shifts caused by the random effect
${u_t}$
, which adjusts the production function across the entire domain of the input. The adjustment in terms of yield is constant across the level of nitrogen. Figure 1(b) shows the plateau shifts caused by the random effect ${v_t}$
and Figure 1(c) represents the plateau shifts caused by the random effect
${v_t}$
and Figure 1(c) represents the plateau shifts caused by the random effect ${\omega _t}$
. As it is evident from the figures, the plateau can shift over time due to a number of factors, some of which are unobservable to producers and uncontrollable even in experimental settings. The random variation of the plateau—also viewed as the maximum yield one can obtain due to a limiting input—leaves the producer with the task of determining the best use and management of nitrogen. Recognizing this task as being left to the producer, we estimate the alternative SR parameterization where
${\omega _t}$
. As it is evident from the figures, the plateau can shift over time due to a number of factors, some of which are unobservable to producers and uncontrollable even in experimental settings. The random variation of the plateau—also viewed as the maximum yield one can obtain due to a limiting input—leaves the producer with the task of determining the best use and management of nitrogen. Recognizing this task as being left to the producer, we estimate the alternative SR parameterization where ${\beta _2}$
is modeled as a parameter instead of
${\beta _2}$
is modeled as a parameter instead of ${P_m}$
.
${P_m}$
.

Figure 1. Potential shifts induced by the random effects.
Similar to the LRSP, the estimation of $E\left( {{y_{it}}} \right)$
for the SR parameterization requires integration that must be solved numerically, and therefore, we use standard methods of Monte Carlo integration.
$E\left( {{y_{it}}} \right)$
for the SR parameterization requires integration that must be solved numerically, and therefore, we use standard methods of Monte Carlo integration.
3. Data
We estimate and compare the nitrogen response models using experimental data collected from a long-term, no-tillage continuous corn study conducted at the Agricultural Research Development and Education Center (ARDEC), located in Fort Collins, Colorado. Nitrogen fertilization treatments included a control (no nitrogen) plus eight treatment levels (34, 68, 101, 134, 168, 202, 224, and 246 kg/ha).Footnote 3 All plots were irrigated with a linear-move sprinkler system. The study was initiated in 2001 on a clay loam soil field, with one to two percent slope, that had previously been continuously cropped to corn for 8 years. Plots are close together and assumed to have soil uniformity. Data include 16 years of crop production, from 2001 to 2017, excluding 2008 due to an unusual and severe hailstorm that decimated the corn crop.
4. Estimation
We estimated the LRSP and SR specifications using MATLAB NLMEFIT, a solver for non-linear mixed-effects models. To calculate expected net returns and profit-maximizing nitrogen rates for the different tillage systems, we use the parameter estimates in combination with Monte Carlo methods. Ten thousand draws from the jointly normally distributed vector $\left[ {{u_t},{\omega _t},{\nu _t}} \right] \sim N\left( {0,{\rm{\Omega \;}}} \right)$
are generated using the respective variance/covariance estimates of the LRSP and SR parameterizations. Nitrogen applications varying by one unit over the interval [0, 246] are also generated. Yield expectations are computed for each of the simulated nitrogen applications evaluated at the 10,000 draws of the vectors of random effects. Finally, profit-maximizing nitrogen rates are calculated for each model using a traditional grid search since the problem involves only one choice variable.
Footnote 4
$\left[ {{u_t},{\omega _t},{\nu _t}} \right] \sim N\left( {0,{\rm{\Omega \;}}} \right)$
are generated using the respective variance/covariance estimates of the LRSP and SR parameterizations. Nitrogen applications varying by one unit over the interval [0, 246] are also generated. Yield expectations are computed for each of the simulated nitrogen applications evaluated at the 10,000 draws of the vectors of random effects. Finally, profit-maximizing nitrogen rates are calculated for each model using a traditional grid search since the problem involves only one choice variable.
Footnote 4
5. Results
First, we estimate the model specified in equation (3), henceforth designated LRSP1. The robustness of its results is checked with the alternative parameterization proposed in equation (5), henceforth designated SR1. We then extend both of the models by adding additional random effects. For LRSP1 this amounts to estimating the plateau function of equation (4), henceforth designated LRSP2. The robustness of LRSP2 is checked with the alternative parameterization proposed in equation (6), henceforth designated SR2. All results are presented in Table 1. Mean-squared errors (MSE) support the use of models with additional random effects over those without.
Table 1. Regression results for the LRSP and SR models
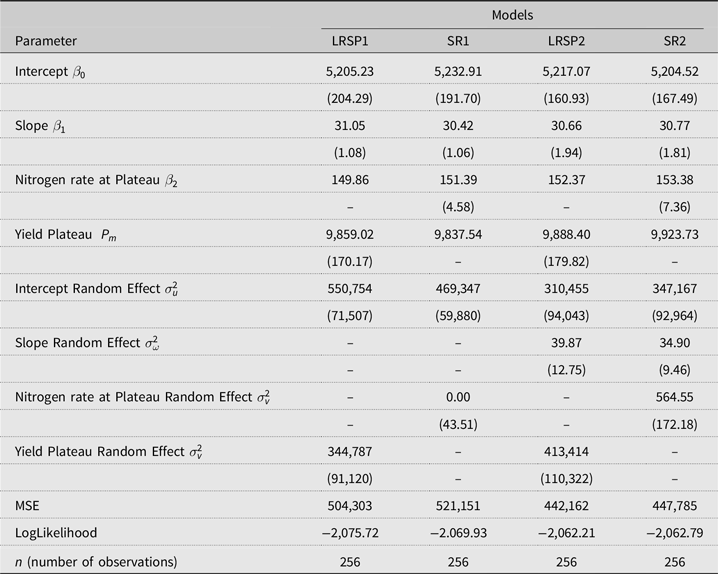
Notes: LRSP1 model corresponds to equation (3). LRSP2 model corresponds to equation (4). SR1 model corresponds to equation (5). SR2 model corresponds to equation (6). Standard errors are in parenthesis. We used bootstrapping techniques to obtain consistent estimates of the corresponding standard errors for the random effects parameters. The predicted parameter $\widehat {{\beta _2}}\;$
for LRSP models and
$\widehat {{\beta _2}}\;$
for LRSP models and $\widehat {\;{P_m}}$
for SR models are calculated using the estimation results for each model.
$\widehat {\;{P_m}}$
for SR models are calculated using the estimation results for each model.
Given that these are nested models, we also use likelihood ratio tests (Greene, Reference Greene2017) to compare model 1 (restricted) and model 2 (unrestricted) within each parameterization. The value of the likelihood ratio statistic is 27.02 for LRSP and 14.28 for SR. The model with additional random effects in each parameterization has five more parameters than the model without, and hence the critical values of the test statistic are distributed chi-squared with $\chi _{\left( {5,\;0.05} \right)}^2 = 11.07$
and
$\chi _{\left( {5,\;0.05} \right)}^2 = 11.07$
and $\chi _{\left( {5,\;0.01} \right)}^2 = 15.09$
. We reject the more parsimonious models at the 1% level of significance for LRSP and at the 5% level of significance for SR. We conclude that allowing all parameters to have random effects, and assuming full correlation among the random effects, produces a model with superior fit.Footnote
5
This result supports the findings of Makowski and Wallack (Reference Makowski and Wallach2002) and Tumusiime et al. (Reference Tumusiime, Wade Brorsen, Mosali, Johnson, Locke and Biermacher2011) in other crops.
$\chi _{\left( {5,\;0.01} \right)}^2 = 15.09$
. We reject the more parsimonious models at the 1% level of significance for LRSP and at the 5% level of significance for SR. We conclude that allowing all parameters to have random effects, and assuming full correlation among the random effects, produces a model with superior fit.Footnote
5
This result supports the findings of Makowski and Wallack (Reference Makowski and Wallach2002) and Tumusiime et al. (Reference Tumusiime, Wade Brorsen, Mosali, Johnson, Locke and Biermacher2011) in other crops.
Table 1 also captures some of the differences between the LRSP and SR model parameterizations. LRSP focuses on the estimation of the plateau yield $\;{P_m}$
and produces a coefficient and standard error for this parameter. The standard error facilitates hypothesis testing with respect to the plateau. Since the model does not estimate the value of the minimum nitrogen to reach the plateau,
$\;{P_m}$
and produces a coefficient and standard error for this parameter. The standard error facilitates hypothesis testing with respect to the plateau. Since the model does not estimate the value of the minimum nitrogen to reach the plateau, ${\beta _2}$
, it must be predicted using the estimated parameters. If one is interested in the standard error of
${\beta _2}$
, it must be predicted using the estimated parameters. If one is interested in the standard error of ${\beta _2}$
, the delta rule or bootstrapping methods can be used to obtain measures of uncertainty. In contrast, the SR parameterization directly estimates the minimum nitrogen needed to reach the plateau and produces a coefficient and standard error. This represents a potential advantage of SR over LRSP, as the switching level of nitrogen may be of most interest to producers. Ultimately, it may be best to estimate both SR and LRSP and use the parameterization with the greatest likelihood value with the goal of avoiding local optima in the search algorithms used to estimate the models.
${\beta _2}$
, the delta rule or bootstrapping methods can be used to obtain measures of uncertainty. In contrast, the SR parameterization directly estimates the minimum nitrogen needed to reach the plateau and produces a coefficient and standard error. This represents a potential advantage of SR over LRSP, as the switching level of nitrogen may be of most interest to producers. Ultimately, it may be best to estimate both SR and LRSP and use the parameterization with the greatest likelihood value with the goal of avoiding local optima in the search algorithms used to estimate the models.
The nitrogen rate at the yield plateau is similar for models LRSP2 and SR2—152 kg/ha for LRSP2 and 153 kg/ha for SR2. The yield plateau is 9,888 kg/ha for LRSP2 and is marginally lower than the 9,923 kg/ha estimated by SR2 (35 kg/ha difference that corresponds to 0.3% of the yield/ha). Adding a random effect to the slope and allowing a full correlation among the random effects did not cause considerable changes in the parameter estimates among our models. This might be explained by the nature of the experiment, as irrigation helps the soil to maintain the same level of moisture every year and reduce the impact of rainfalls (Laporte, Duchesne, and Wetzel, 2012). The moisture level for dryland and non-irrigated conditions depend heavily on rainfall, which can create larger random effects due to year-to-year variations in rainfall.
Boyer et al. (Reference Boyer, Larson, Roberts, McClure, Tyler and Zhou2013) also estimate corn response functions using experimental data from the U.S. and mixed-effects plateau models. They report no-tillage continuous corn response functions using a 6-year data set (2006–2011) from an experiment conducted at Milan, Tennessee. Although not directly comparable to the results of Boyer et al. (Reference Boyer, Larson, Roberts, McClure, Tyler and Zhou2013) due to differences in location and agronomic characteristics, the results in Table 1 are relatively close to their reported corn yield plateau of 9,912 kg/ha and nitrogen rate at the plateau of 153 kg/ha.
Figure 2 shows the corn yield expectations for the simulated nitrogen applications using the LRSP2 and SR2 models. For reference, we also plot the actual yield averages. The expectations are similar for both the LRSP2 and SR2.

Figure 2. Expected grain yields for LRSP2 and SR2.
5.1 Profit Analysis
We estimate expected returns using partial budgets. Three different prices for N are taken into account: $0.72, $0.96, and $1.20 per kg. These prices per kg are equivalent to prices of $300, $400, and $500 per ton of 46-0-0 urea fertilizer, respectively. Likewise, we assume corn prices of $0.12, $0.20, and $0.28 per kg. We selected the prices to be representative of prices reported over the last decade (USDA-NASS, 2019).
Using the expected yield estimates obtained with our preferred model, LRSP2, expected net returns are calculated from equation (1) under the different price scenarios defined above. Table 2 shows the profit-maximizing nitrogen rates, yields, and net returns for the different assumed prices. The expected profit-maximizing nitrogen rates ranged from 162 to 197 kg/ha depending on the price scenario.Footnote 6
Table 2. Expected profit-maximizing nitrogen rates (kg/ha), profit-maximizing yields (kg/ha), and net returns ($/ha) for irrigated continuous-corn
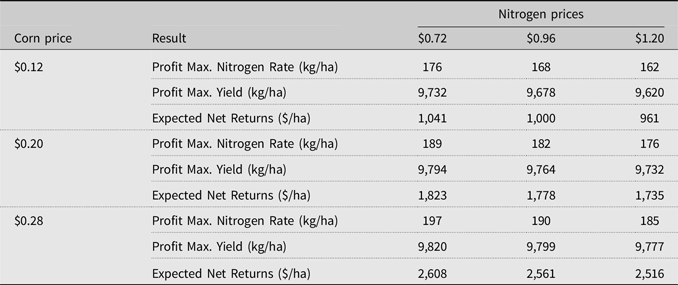
For these nitrogen rates, the corresponding expected corn yields vary from 9,620 to 9,820 kg/ha. These expected yields are equivalent to 153–156 bu/acre and are close to the average corn yield of 155 bu/acre reported in the northeastern Colorado region by the National Agricultural Statistics Service (Meyer et al., Reference Meyer, Ott, Lohrenz, Gunn, Brokmeyer, McBride and Schmidt2017). For this specific corn average, the nitrogen fertilizer recommendation of the Colorado Extension Service—which follows a yield-based algorithm developed by the University of Nebraska—would have been of 145 kg/ha.
Although there are no official statistics about how much nitrogen on average farmers use for irrigated no-tillage continuous-corn in northeastern Colorado, previous literature (e.g. Delgado and Bausch, Reference Delgado and Bausch2005) and corn trials conducted by Colorado State University (e.g. CSU, 2019) indicate a common use of at least 240 lb/acre of nitrogen for conventional tillage systems. This rate corresponds to 269 kg/ha of nitrogen, that when compared to our profit-maximizing estimates, translates as an excess use of approximately 72–107 kg/ha of nitrogen in the study region. At an average price of $0.96 per kg of nitrogen, this excess use would represent a loss to the producers of about $80/ha. Depending on the price scenario, these losses can represent up to 8% of the expected net returns, hence significantly impacting farm profits.
6. Summary and Discussion
We estimate irrigated no-tillage continuous-corn yield response functions to nitrogen using data from a long-term study of corn yields conducted at the Agricultural Research Development and Education Center located in Fort Collins, Colorado. For our estimation, we utilize the LRSP function of Tembo et al. (Reference Tembo, Brorsen, Epplin and Tostão2008), and to check the robustness of our results we also estimate an alternative parameterization using an SR plateau specification. Under equivalent assumptions on the random parameters and correlation of the random effects, this alternative parameterization performs as good as the classic LRSP. We suggest the SR specification as a useful robustness check for the frequentist estimation of plateau-type production functions with stochastic variations. The availability of various estimation approaches allows the researcher to check the stability and robustness of parameter estimates, and in the specific case of non-linear models, it helps avoid local optima.
Results show the expected profit-maximizing nitrogen rates range from 162 to 197 kg per hectare depending on the price scenario. When compared to the reported local use of nitrogen (269 kg/ha), our estimates and the prospective Colorado Extension recommendation suggest farmers overfertilize the corn crop in the study area. Overfertilization and excess nitrogen use not only cause economic losses to farmers, but they also exact environmental costs on society (Williamson, Reference Williamson2011).
Delgado and Bausch (Reference Delgado and Bausch2005) report nitrogen-leaching problems related to the excess use of nitrogen in northeastern Colorado. This excessive use of fertilizer can be attributed in part to the common use of yield-based methods for nitrogen recommendations. These are part of the principal algorithms of most decision tool software being sold to farmers for fertilizer management (Rodriguez et al., Reference Rodriguez, Bullock and Boerngen2019). The yield-based algorithms are based on achieving a specific corn yield goal such that if a farmer wants more corn bushels per acre, he needs to apply more nitrogen (Camberato, Reference Camberato2012). Such algorithms often disregard the existence of a yield plateau and von Liebig’s Law of the Minimum. Thus, avoiding excess nitrogen applications, and promoting alternative practices such as applying nitrogen in phase with crop demand should be encouraged in the area.
Naturally, our results are conditioned on the empirical situation at hand and may not hold for all data. But as a general rule, this study indicates that the SR stochastic plateau production function is a useful approach for measuring yield response. Future research could apply this alternative parameterization along the LRSP to other crops and locations to determine optimal input rates.
Acknowledgments
The authors would like to thank USDA-ARS personnel in Fort Collins, Colorado, especially Dr. Ardell D. Halvorson, who collected grain yield data from 2001 to 2013. We are also thankful for the useful comments and suggestions from three anonymous reviewers. All remaining errors are ours.
Financial Disclosure
This work was supported by Virginia Tech Cooperative Agreement Number 58-3012-7-007 with USDA/ARS; and by Hatch Project VA 136247 Regional project NC-1034.
Conflicts of Interest
None declared.
Appendix 1
Table A1. Random effects covariance and correlation matrix of Models LRSP2 and SR2
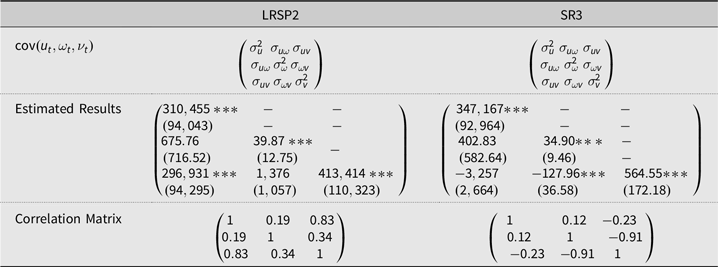
Notes: Standard errors are in parenthesis for the corresponding covariance matrices. We used bootstrapping techniques to obtain consistent estimates of the corresponding standard errors for both models.
***Significant at the 0.01 level.
Appendix 2
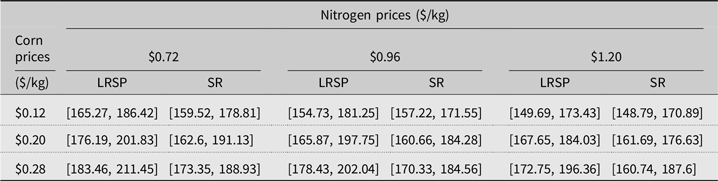
Table A2. 95% confidence intervals of the profit-maximizing nitrogen rates


 Open access