
DISCUSSION POINTS
-
• If, as Shore writes, “all problems started out as solutions,” how might resource recovery at wastewater treatment plants create problems in the future?
-
• Other than wastewater, what sectors have the most potential for adopting resource recovery technology and processes?
-
• What are the most salient lessons to be learned from Chicago’s management of waste during the 19th and 20th centuries, and what could have been done differently to avoid some of the problems those management strategies created?
Part one: Retreat of the glacier, reversal of the river, and a great metropolis grows on a soggy, mucky land
Chicago’s water story begins with ice. Roughly 16,000 years ago, the last glacier—known as the Wisconsonian—extended as far as Shelbyville, 200 miles south of Chicago, and not much further. Imagine a sheet of ice a half-mile or more in height crushing the landscape, pressing and grinding, moving at a glacial pace. Based on the estimated volume of the ice sheet, if we consider just the load on Cook County’s 946 square miles, that comes to 9,155,920,000,000 pounds of ice. Give or take a cube or two (Fig. 1).

Figure 1. Illustration courtesy of Bobby Garro Sutton.
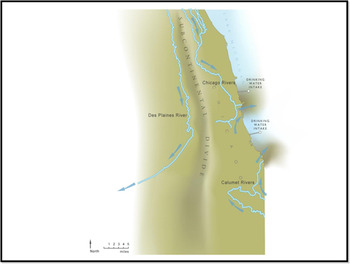
As Joel Greenberg notes in his A Natural History of the Chicago Region, “The force of the glacier also ordained that the Chicago region would straddle the eastern Continental Divide, separating the drainage area of the Atlantic Ocean from that of the Gulf of Mexico. The rivers Des Plaines, Fox, Kankakee, and their tributaries were in the Illinois and Mississippi watershed, while the Chicago, Calumet, Pike, Root, and St. Joseph fed the Great Lakes (Fig. 2).” Reference Greenberg1

Figure 2. Before 1900, the Chicago River flowed into Lake Michigan. Image courtesy of the Metropolitan Water Reclamation District of Greater Chicago.
As the glacier slowly retreated to the north, it scoured the landscape, leaving an enormously rich mix of soils, leaving glacial ridges and moraines, leaving giant ice cubes that created prairie potholes as they melted, and leaving a very great lake—a massive body of water that geologists call Lake Chicago. As that lake drained and began to form Lake Michigan, it further flattened the clay deposits left by the retreat of the glacier. The weight of the glacier also left a landscape that was soggy, mucky, and wet with little change in elevation.
Che-ca-gou was the Pottawatomi name for the nodding wild onion that grew in profusion along the banks of local rivers and streams (and still grows in the region today). The Chicago River was slow and marshy; its flow into Lake Michigan occasionally reversing from strong winds and storms. During wet spring seasons, explorers found a half-mile portage between the Lake and the tributaries to the Des Plaines River (at a site now called Mud Lake!) so that fur traders could make a connection to the Mississippi watershed and find passage to the continent’s interior.
As Steven Johnson points out in his fascinating book called How We Got to Now, most cities were located near water–along rivers or next to seaports–but they had hills descending to the waters or harbors around which they evolved. Reference Johnson2 Not so, Chicago, which, because of its glacial past, is mostly flat.
As Johnson notes, “Building a city on perfectly flat land would seem like a good problem to have; you would think hilly, mountainous terrain like that of San Francisco, Cape Town, or Rio would pose more engineering problems, for buildings and for transportation.” Reference Johnson2 And in the middle of the 19th century, gravity-based drainage was key to urban sewer systems. But flat lands don’t drain. Add to this lack of topography the fact that the land was nonporous and swampy. When it rained there was nowhere for the water to go.
With the completion of the Illinois & Michigan Canal in 1848, providing a better connection to move goods between Lake Michigan and the east with the Mississippi and the heartland, Chicago’s population soared, more than tripling in the 1850s.
This boom strained the city’s housing and transportation resources, but the biggest challenge was what to do with human and animal waste. “We rarely think about it,” writes Johnson, “but the growth and vitality of cities have always been dependent on our ability to manage the flow of human waste that emerges when people crowd together. From the very beginnings of human settlements, figuring out where to put all the excrement has been just as important as figuring out how to build shelter or town squares or marketplaces.” Reference Johnson2
It’s no wonder that people congregated and settled along rivers. They served as vital routes for moving people and goods, as transportation corridors and water supply, but rivers also move. Waste dumped into them would be washed downstream. Plus, nature is resilient and can process and recycle organic waste in modest amounts. Sunlight disinfects bacteria; nutrients cycle as fertilizer. But as the number of people dwelling in an area increases, the amount of waste overwhelms the capacity of natural systems to deal with it. Rivers and harbors become polluted; people get sick.
In Chicago, as early settlements grew along the banks of the Chicago River, people dumped all manner of human and animal waste into the river, which flowed into Lake Michigan, the source of their drinking water. Yet even as the population surged, there remained no water treatment to remove bacteria or contaminants from drinking water, and no sewage treatment for waste. Big problem: contaminated drinking water leads to disease and death. Chicago could not grow and thrive without a safe, secure source of drinking water.
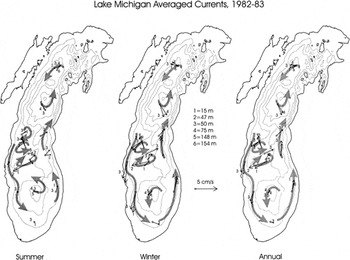
As Fig. 3 shows, however, there is very little natural circulation at the bottom end of Lake Michigan. Whatever is dumped into the southern end of the lake tends to stay there for a very long time.

Figure 3. Summer, winter, and annual circulation in Lake Michigan. Isobaths every 50 m. Reprinted with permission from Elsevier from: D. Beletsky, J.H. Saylor, and D.J. Schwab: Mean circulation in the Great Lakes. Journal of Great Lakes Research 25, (1999). Reference Beletsky, Saylor and Schwab3
In early 1855, Chicago’s leaders created a Board of Sewerage Commissioners to address the problem of poor drainage and contaminated water. They hired Ellis Chesbrough, then the chief engineer of the Boston Water Works, to come and solve the problem. Chesbrough had worked on rail and canal projects, which proved to be fortuitous. Because burrowing deep underground to build sewers was deemed to be too expensive and too difficult, Chesbrough came up with another idea. Let’s raise the city itself to make way for sewers! Thus began one of the most ambitious engineering projects of the 19th century. “Building by building, Chicago was lifted by an army of men with jackscrews,” Johnson describes in his book. “As the jackscrews raised the buildings inch by inch,” he continues:
“…workmen would dig holes under the building foundations and install thick timbers to support them, while masons scrambled to build a new footing under the structure. Sewer lines were inserted beneath buildings with main lines running down the center of streets, which were then buried in landfill that had been dredged out of the Chicago River, raising the city almost ten feet on average…
Amazingly, life went on largely undisturbed as Chesbrough’s team raised the city’s buildings. One British visitor observed a 750-ton hotel being lifted, and described the surreal experience in a letter: ‘The people were in [the hotel] all the time coming and going, eating and sleeping—the whole business of the hotel proceeding without interruption.’ As the project advanced, Chesbrough and his team became ever more daring in the structures they attempted to raise. In 1860, engineers raised half a city block: almost an acre of five-story buildings weighing an estimated 35,000 tons was lifted by more than 6000 jackscrews. Other structures had to be moved as well as lifted to make way for the sewers. ‘Never a day passed during my stay in the city,’ one visitor recalled, ‘that I did not meet one or more houses shifting their quarters. One day I met nine. Going out on Great Madison Street in the horse cars we had to stop twice to let houses get across.’ Reference Johnson2
The result was the first comprehensive sewer system in any American city. Within three decades, more than 20 cities had followed Chicago’s lead, planning and installing their own underground networks of sewer tunnels. These massive underground engineering projects created a template that would come to define the 20th century metropolis: the idea of a city as a system supported by an invisible network of subterranean services…Today, entire parallel worlds exist underground, powering and supporting the cities that rise above them. We think of cities intuitively now in terms of skylines, that epic reach toward the heavens. But the grandeur of those urban cathedrals would be impossible without the hidden world below grade.” Reference Johnson2
Through enormous enterprise, Chesbrough designed and Chicago built a system to convey waste into the river. But where did the Chicago River flow in admittedly sluggish fashion? Into Lake Michigan. Try to imagine the stench and the filth of Chicago’s river 150 years ago. “By the early 1870s,” Johnson writes, “the city’s water supply was so appalling that a sink or tub would regularly be filled with dead fish, poisoned by the human filth and then hoovered up into the city’s water pipes. In summer months, according to one observer, the fish ‘came out cooked and one’s bathtub was apt to be filled with what squeamish citizens called chowder.’” Reference Johnson2
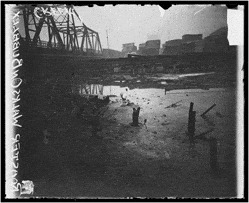
In Upton Sinclair’s novel The Jungle, about Chicago’s stockyards and meatpacking houses published in 1906, he describes a side branch of the river called Bubbly Creek: “The grease and chemicals that are poured into it undergo all sorts of strange transformations, which are the cause of its name; it is constantly in motion, as if huge fish were feeding in it, or great leviathans disporting themselves in its depths. Bubbles of carbonic gas will rise to the surface and burst, and make rings two or three feet wide. Here and there the grease and filth have caked solid, and the creek looks like a bed of lava; chickens walk about on it, feeding, and many times an unwary stranger has started to stroll across, and vanished temporarily (Fig. 4).” Reference Sinclair4

Figure 4. Chicken stands on crusted sewage on Bubbly Creek at Morgan Street. Image from the Chicago Daily News, reprinted with permission from DN-0056899, Chicago Daily News negatives collection, Chicago History Museum. 5
By the late 1880s, the menace of water-borne diseases such as cholera and typhoid had become dire. In 1889, city planners established the Chicago Sanitary District, charged with studying and solving the problem of the city’s contaminated drinking water supply. Again the solution was big and bold, expensive and enormous. City officials decided to reverse the river and use water from the lake to flush sewage downstream! Construction began on the 28-mile Sanitary and Ship Canal, a massive engineering project to connect the south branch of the Chicago River with the Des Plaines River and provide a path for sewage and cargo. It’s hard to imagine the magnitude of the enterprise today. Digging the Canal took 11 years to complete, but in early January 1900 the last barrier was lifted and the Chicago River was reversed. (A lock and gates had been constructed where the main stem of the Chicago River empties into Lake Michigan to manipulate water flow, now readily visible from Chicago’s Navy Pier.) By flushing sewage downstream and away from the lake, Chicago’s drinking water was protected. By providing a route for commercial barge traffic between the Mississippi River and the Great Lakes, Chicago’s prominence as a transportation hub was cemented.
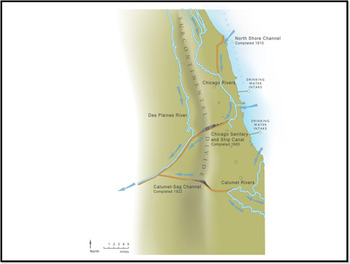
Subsequently the eight-mile long North Shore Channel was dug between what is now Wilmette Harbor and the North Branch of the Chicago River to use water from the lake to flush sewage from the northern suburbs and the north side of Chicago downstream, and the 22-mile Cal-Sag Channel completed in 1922 the massive, man-made Chicago Area Waterway System or CAWS (see map in Fig. 5).

Figure 5. After 1900, the Chicago River flowed toward the Mississippi River. Image courtesy of the Metropolitan Water Reclamation District of Greater Chicago.
In his seminal environmental history of Chicago, Nature’s Metropolis, William Cronon writes that Chicago “benefited from the intersecting geographies of nature and capital. On one side, Lake Michigan had given it a harbor where the northern lumber ships could unload their heavy burdens onto the waiting docks. On the other side, the spreading fan of the canal and the railroad network pointed to the heart of the treeless country, putting the city in immediate contact with nearly every western community where tallgrass prairies were becoming farms. If the weight and bulk of lumber meant that only water and rails could move it profitably in large quantities, then no other city in the Great West was better situated to become its chief depot. When the 1848 opening of the Illinois and Michigan Canal doubled Chicago’s lumber receipts in a single year, the event was a clear portent of things to come. Ecology and economy had converged: the city lay not only on the border between forest and grassland but also on the happy margin between supply and demand.” Reference Cronon6
It’s been said that all problems started out as solutions. We would be wise to remember that. The solution to the problem of Chicago’s contaminated drinking water was to dig a canal and reverse a river. It worked remarkably well and permitted Chicago to become a great metropolis. But that, in turn, created at least two new problems.
First, the reversal of the river changed the shape of the Lake Michigan watershed, creating what is now known as “the Chicago diversion.” All the rain falling on a significant portion of the Chicago landscape that would formerly have replenished Lake Michigan now made its way into the Chicago River and away from the lake (Fig. 5). In addition, all the water withdrawn from the lake for human and industrial use was discharged through sewers that dumped into the Chicago waterways—and flowed away from the lake. Since 1967, when the Illinois Department of Natural Resources began tracking rainfall and withdrawals, approximately 126 trillion gallons of water have been diverted from Lake Michigan. (If you’re concerned about sustainable ecosystems, that’s a problem—mitigated in part by two diversions into the Great Lakes by two hydro projects in Canada. For a captivating read, I recommend The Great Lakes Water Wars by Peter Annin, 2009.) Reference Annin7
Second, the canals known as the Chicago Area Waterways System cut through the eastern subcontinental divide, the natural hydrologic barrier separating the Lake Michigan watershed from that of the Mississippi. The Sanitary and Ship Canal and the Cal-Sag Channel now connect two watersheds that had not been connected previously—or only intermittently—thus providing a highway for environmental havoc by allowing invasive species to move in both directions. Zebra mussels have made their way from the lake into the Mississippi River watershed. Skipjack herring have moved in the opposite direction. Silver and bighead carp have been making their way up the Mississippi into the Illinois and Des Plaines Rivers for the past 30 years and are now within 22 miles of Lake Michigan. In some parts of the Illinois River, these aggressive, invasive species now constitute 80% of the biomass. It is feared that if they make their way into the Great Lakes via conduits such as the CAWS and are able to establish viable populations, they will devastate the Lakes’ $7 billion annual sport and commercial fisheries. 8 And what of Chicago’s burgeoning river recreation and tourism industries? Asian carp are notorious for leaping above the surface when boat motors are detected. Will the public want to recreate on and along the rivers if there’s even a remote possibility of being hit by a soaring carp?
Part two: From treating waste to recovering resources, becoming the utility of the future
For nearly 30 years, from the reversal of the Chicago River in 1900 until the late 1920s, Chicago and its suburbs used freshwater from Lake Michigan to flush raw sewage downstream. As one might imagine, residents of St. Louis were less than pleased at Chicago’s solution and sought to stop the reversal. A subsequent lawsuit proceeded apace until the federal judge asked representatives of the Gateway City where they discharged their sewage. “Into the Mississippi,” they replied. Case closed. Chicago’s ability to withdraw water from Lake Michigan, however, was ultimately capped at 3200 cfs by a U.S. Supreme Court decree. [See Wisconsin v. Illinois, 388 U.S. 426 (1967).] 9
Remember, in 1889, when the Chicago Sanitary District embarked on its ambitious plan to protect Chicago’s drinking water by using lake water to flush sewage downstream through a system of manmade canals, there was no Environmental Protection Agency. No requirement to conduct an environmental impact study. No real understanding of ecosystems. (Arthur Tansley coined the term “ecosystem” in 1935.) Reference Tansley10 No fish lived in some sections of the Chicago River; raw sewage created a dead zone, leaving no oxygen for aquatic life.
Should we note that Chicago’s leaders and engineers were doing the best that they could to address an imminent public health threat by acting within the prevailing culture of man’s dominion over nature? Water was considered a viable dumping ground for human waste. Indeed, Chicago improved its drinking water quality by diverting the river’s flow away from the lake yet continuing to use the river and manmade channels as conduits for waste!
By the late 1920s, more modern sewage treatment techniques had been developed in Europe and parts of the United States, and the Sanitary District began building its own treatment plants. No longer would Chicago and its suburbs discharge raw sewage into the waterways but, instead, separate liquid waste from solid waste, remove some contaminants, and clean up the rivers. In 1955, the Chicago Sanitary District changed its name to the Metropolitan Sanitary District to reflect its expanded service area. (The name changed again in 1989 to the Metropolitan Water Reclamation District of Greater Chicago, often abbreviated as MWRD, in an attempt to distance the agency from the primary task of sewage treatment and to portray itself as reclaiming water.) The seven sewage treatment plants ranging in capacity from four mgd to 1400 mgd had all been completed by 1980 and serve the equivalent of 10 million people daily (as they process both residential and industrial wastewater).
For about 80 years then, from the 1930s to about 2010, sewage treatment plants in the Chicago region, including one of the world’s largest, separated liquid waste from solids, sending the liquid residue downstream and depositing the solid residuals onto land. Waste in, waste out.
In 1970 a group of individuals representing more than 20 large sewerage agencies established the Association of Municipal Sewerage Agencies (AMSA), with a goal of securing federal funding for treatment plant upgrades to meet water quality standards of the Clean Water Act. “I always felt these utility managers were environmentalists,” says Ken Kirk, longtime AMSA executive director:
“About 10–15 years after we started, I suggested that they change their name to reflect that we were really about water quality and protecting the environment. They told me to get lost, that they weren’t going to change the name, period. About five to 10 years later, I approached them again, suggesting that the name of the group be shifted to something more environmentally focused. They were somewhat more receptive and put in small letters under AMSA what it means. In 2000 or so I went back again and said, ‘You really need to consider changing your name.’ By that time the old guard was gone and they said, ‘Absolutely.’ We took care of that within a couple of weeks and became the National Association of Clean Water Agencies (NACWA). It represented a shift in attitude toward themselves as environmental advocates and also of their agencies. The focus is still on securing funding from the federal government, but also on alternative ways to work with the EPA and environmental organizations. I knew this is where they had to concentrate their efforts; they had to be viewed by others as environmentalists.” Reference Kirk11
Driven by energy costs and regulation, Kirk says, approximately half of the wastewater utilities in the U.S. are now on a path to become “resource recovery” agencies focused on cutting costs and producing revenue. Reference Kirk11 In other words, all those things we used to consider ‘waste’ have value, and treatment plants are seeking to capture and monetize that value. In the summer of 2013, NACWA, the Water Environment Federation (WEF), and the Water Environment Research Foundation (WERF) produced The Water Resources Utility of the Future: A Blueprint for Action. 12 The Blueprint coined the phrase, “Utility of the Future,” to recognize a fundamental shift in the way America’s clean water utilities were beginning to define their role in society: from managers of waste to managers of valuable resources. 12
Perhaps there was no more telling sign that the MWRD was embarking on a significant shift in its culture (and prospect) than that it had to seek a statutory change from the state legislature to be able to sell things. For its entire history, the MWRD had thought of itself, had defined itself, as a waste agency. As the recognition dawned that many of the waste streams flowing into the sewage treatment plants had value—and that the MWRD might be able to sell products and generate revenue—the District’s attorneys advised that the agency did not have the statutory authority to make money from waste!
Hence, Illinois House Bill 4716, introduced in 2014 and passed with wide bipartisan support, gave the District such authority:
-
(i) The General Assembly finds that:
-
(a) technological advancements in wastewater treatment have resulted in the ability to capture recovered resources and produce renewable energy resources from material previously discarded;
-
(b) the capture and beneficial reuse of recovered resources and the production of renewable energy resources serves a wide variety of environmental benefits including, but not limited to, improved water quality, reduction of greenhouse gases, reduction of carbon footprint, reduction of landfill usage, reduced usage of hydrocarbon-based fuels, return of nutrients to the food cycle, and reduced water consumption;
-
(c) the district is a leader in the field of wastewater treatment and possesses the expertise and experience necessary to capture and beneficially reuse or prepare for beneficial reuse recovered resources, including renewable energy resources; and
-
(d) the district has the opportunity and ability to change the approach to wastewater treatment from that of a waste material to be disposed of to one of a collection of resources to be recovered, reused, and sold, with the opportunity to provide the district with additional sources of revenue and reduce operating costs.
-
-
(ii) As used in this Section: “Recovered resources” means any material produced by or extracted from the operation of district facilities, including, but not limited to:
-
(a) solids, including solids from the digestion process, semi-solids, or liquid materials;
-
(b) gases, including biogas, carbon dioxide, and methane;
-
(c) nutrients;
-
(d) algae;
-
(e) treated effluent; and
-
(f) thermal energy or hydropower.
-
“Renewable energy facility” shall have the same meaning as a facility defined under Section 5 of the Renewable Energy Production District Act.
“Renewable energy resources” means resources as defined under Section 1–10 of the Illinois Power Agency Act.
“Resource recovery” means the recovery of material or energy from waste as defined under Section 3.435 of the Illinois Environmental Protection Agency Act.
-
(iii) The district may sell or otherwise dispose of recovered resources or renewable energy resources resulting from the operation of district facilities, and may construct, maintain, finance, and operate such activities, facilities, and other works as are necessary for that purpose.
-
(iv) The district may take in materials which are used in the generation of usable products from recovered resources, or which increase the production of renewable energy resources, including, but not limited to food waste, organic fraction of solid waste, commercial or industrial organic wastes, fats, oils, and greases, and vegetable debris.
(70 ILCS 2605/56 new) 13
Let’s consider phosphorus, the 11th most abundant element on Earth. Found most commonly in the form of phosphate bound up in rock, many large reserves are in politically unstable places such as Algeria, South Africa, and Syria. Phosphorus is absolutely essential for plants to grow, yet some geologists estimate that there remain only 50–70 years left of phosphate that can be economically mined for use as fertilizer. Plus, unlike fossil fuels, there are no substitutes for phosphorus—no synthetic form of this vital element. Knowing this, in 1974 renowned scientist Isaac Asimov wrote, “Life can multiply until all the phosphorus is gone and then there is an inexorable halt which nothing can prevent…We may be able to substitute nuclear power for coal, and plastics for wood, and yeast for meat, and friendliness for isolation—but for phosphorus there is neither substitute nor replacement.” Reference Asimov14
Phosphorus is present in many of the foods we eat and is a key constituent of fertilizer, so it is often present in stormwater runoff from lawns, corporate campuses, and farms. In waterways, phosphorus can be a significant problem—it causes plants to grow, namely algae, which suck up available oxygen during decomposition, leaving none for aquatic life. In August 2014, a large algal bloom containing toxic bacteria in the Western Basin of Lake Erie threatened the drinking water for 400,000 residents in the Toledo area and caused public health officials to declare a state of emergency. The permits for sewage treatment plants place limits on the amount of phosphorus that can be discharged in wastewater as regulatory agencies grapple with impaired lakes, rivers, and streams. Most utility managers expect state and federal authorities to impose even more stringent limits soon. Even though most nutrients enter waterways from nonpoint sources like agricultural runoff, the current regulatory environment makes point sources like treatment plants an easy target for reduced nutrient loading.
Anticipating new limits, the MWRD began exploring ways to capture phosphorus at the treatment plants and turn it into a resource instead of a problem. (Some phosphorus was already being removed from the waste stream using a chemical process at the smaller John E. Egan plant operated by the District. Ferric chloride was added to the nutrient-rich waste stream where it could react with phosphorus and form removable precipitates. But the chemical process was costly and resulted in phosphorus bound up in biosolids in a form less accessible to plants.)
District engineers learned of another chemical process that can produce phosphorus in the form of struvite pellets called the Ostara Nutrient Recovery Technology. After MWRD staff visited installations in Portland, OR, and Madison, WI, the District began installing the world’s largest phosphorus recovery facility using the Ostara technology at the Stickney treatment plant in 2012. At peak recovery, the District expects to remove 1150 tons of phosphorus from the waste stream annually, producing approximately 10,000 tons of struvite crystals. Even more remarkable, the fertilizer using these prills (called Crystal Green®) is designed to release slowly, so runoff from farms using this fertilizer will have a less severe impact on the quality of nearby waterways. “Unlike conventional phosphate fertilizers, which release nutrients upon watering or irrigation,” Ostara’s website explains, “Crystal Green releases nutrients in direct response to root demand and minimizes issues of tie-up, leaching, or runoff and provides a steady source of phosphorus (along with nitrogen and magnesium) throughout the entire season.” 15 The MWRD would have been required to reduce its phosphorus discharge regardless of whether the process produced a usable product. However, using the Ostara technology will generate an estimated $4 million annually at peak production (resulting in net revenue of $1 million to the District). Thus a vicious cycle turns into a virtuous cycle.
It’s true that revenue from Ostara probably will not cover capital costs of installation for another 55 years, but if the District were to remove phosphorus through traditional chemical precipitation at its Stickney plant, the overall costs would be far higher. The capital cost for Ostara was $32 million, with annual chemical costs of approximately $1.2 million. Large-scale chemical precipitation technology at Stickney would require an estimated capital cost of only $28 million, but annual chemical costs of $25.2 million! By adopting the Ostara process, the MWRD produces something in the Midwest that can be used in the Midwest.
In May 2016, the MWRD opened the Ostara facility and early signs indicate that phosphorus levels in the wastewater to be discharged are way down. Prior to installing Ostara technology at the MWRD’s Stickney plant, phosphorus concentrations in effluent were around 1 mg/L. After Ostara became operational, the MWRD’s internal testing began finding average phosphorus concentrations of 0.3 mg/L.
What about biogas? The digestion of organic matter without oxygen produces gas—in our bodies and at sewage plants. The microorganisms found in anaerobic digesters at many sewage treatment plants break down organic materials and produce a mixture of primarily methane and carbon dioxide. Many plants use that gas to heat digesters and facilities. Indeed, the MWRD is able to capture and use between 50 and 80% of the methane produced by its digesters. But at some times of the year excess gas has been flared off, as the District did not have a way to store or use the extra gas. Through newer technologies, however, additional organic matter—either food waste or fats, oils and grease—can be fed into the digesters, generating more gas, which can be processed and sold back into the natural gas pipeline, converted into biofuel (compressed natural gas or CNG) and used to fuel truck and bus fleets, or used to generate electricity via steam turbines. MWRD’s executive director, David St. Pierre, reports that once a biogas generation project is completed at the Stickney plant, the average amount of renewable natural gas produced and used for vehicle fuel—assuming the District receives 500,000 gallons per day of organic waste feedstock—will equal approximately 68,940 gallons gasoline equivalent every day. Reference St. Pierre16 Presto! Wastewater utilities can generate renewable energy, cut down on greenhouse gas emissions, and reduce the solid waste stream in cities.
East Bay Municipal Utility District, serving Oakland and Berkeley, CA, has a pilot program diverting 20–40 tons a day of food scraps from restaurants that would have gone to landfills and converting the biogas produced by the treatment process into electricity. DC Water in Washington, DC, has adopted a first-in-the-U.S. approach—it’s called Cambi and was developed in Norway—to convert its waste stream into energy and reduce its production of sewage sludge, thus cutting its trucking costs in half.
By adapting anaerobic digesters at two of its largest treatment plants over the next few years to produce renewable energy, the MWRD is on a path to become energy neutral by 2023. Mind you, this is an agency that used to spend $50 million annually on electricity. Biogas generation and use will help the District get to 70% of its energy reduction goal.
Biosolids are another leg of resource recovery. Sewage plants separate solid residuals from liquid waste and the resultant solids used to be called sewage sludge. Through improvements in industrial pretreatment and treatment processes to reduce the presence of metals and kill pathogens, sewage sludge processed at treatment plants that meet the highest EPA standards are called Class A biosolids. The Milwaukee Metropolitan Sewerage District has produced an organic nitrogen fertilizer in the form of kiln-dried pellets and sold as Milorganite™ for nearly 90 years. For many years the MWRD conveyed tons of its sludge on barges down the Illinois River to apply on former strip-mine land in Fulton County, IL. More recently, it pays for lower-quality biosolids to be trucked and used as daily cover for landfills, as a soil amendment for golf courses and athletic fields, and as fertilizer on farms. Most of the solids produced today meet the highest quality standards set by the EPA, so the MWRD is now mixing Class A biosolids with wood chips from Chicago’s forestry program to produce high-quality compost that can be sold. Another example of waste to resource.
Arguably, the most important resource in wastewater is the water itself. In many places, the effluent from wastewater plants is used in industrial processes or as irrigation. In Oakland County, CA, treated water is injected into wells where infiltration will further cleanse it and that water will gradually recharge the groundwater supply. In Cook County, hardly any treated water is reused. Wade Miller, former director of the Water ReUse Foundation, noted that 32 billion gallons of effluent are discharged into the nation’s waterways, including 12 billion gallons to the oceans and only about eight percent is beneficially reclaimed. Reference Miller17 But he projects a five percent growth annually in the reuse of treated water. “The burning platform is water scarcity…97.2% of the water on the planet is saline. Desalination and reuse are the only ‘new’ sources of water and,” he noted in remarks, “there will be a 40% disparity between supply and demand by 2030.” Reference Miller17
The ready and ample availability of freshwater—namely Lake Michigan—and its low cost are the biggest obstacles to reuse in the Chicago region. Still, visionary planners and leaders are beginning to explore opportunities for reuse even where water is plentiful and cheap. MWRD engineers are in discussions with the Ford Motor Company, which operates a large assembly plant on the south side of Chicago near the District’s Calumet treatment plant. Could Ford use treated effluent at lower cost to prepare cars for painting rather than potable water? Could Koppers, which operates a large chemical plant near the District’s Stickney wastewater plant, use treated effluent in its operations? We think so and are actively exploring those opportunities.
The move from a linear economy to a circular economy that resource recovery represents certainly makes sense—and may also make cents—for utilities. One might reasonably ask, What took so long? Why did this culture shift not happen sooner and why aren’t all utilities doing this? First, utilities—especially publicly owned utilities—are risk averse. Of municipal utilities George Hawkins, CEO of DC Water has famously said, “We are all in a fierce race to be second.” Reference Hawkins18 And utilities are risk averse for good reason. “We are the only utility whose product people consume,” Hawkins says of water suppliers. Reference Hawkins18 Protecting public health is vital in both the drinking water and wastewater realms. One needs to look no further than Flint, MI, to see a stark example of a utility’s failure to protect the health of its customers and users.
The Clean Water Act typically does not require the US EPA to factor in costs when forming and implementing health-based standards for wastewater effluent. Requirements that some dischargers utilize the best practicable or best available pollution control technologies mean standards become more stringent as technology advances. Indeed, regulations and directives from federal agencies like the EPA, as well as lawsuits from environmental or civic organizations, are often necessary to push utilities forward. For example, the MWRD was reluctant to adopt expensive effluent disinfection technology at its plants until 2011 when the US EPA required large stretches of CAWS to be designated for primary contact activities like swimming, leaving the District with little choice but to install tertiary treatment at two large plants. More recently, the District reached settlements in lawsuits brought by the Sierra Club, Natural Resources Defense Council, Prairie Rivers Network, and other groups over alleged illegal discharges of phosphorus into waterways. As a result, the MWRD will be required to engage in a study of nutrient pollution from its plants, work with the Illinois EPA and environmental groups on developing a plan for reducing nutrient pollution, and adhere to new numeric nutrient criteria.
Second, no manager of a public utility wants to spend public money on an unproven technology. “If you do something and it doesn’t work, you’re subject to fines and penalties,” Ken Kirk noted. Reference Kirk11 “In Europe, they have large utilities that can adopt technologies on a large scale,” said David St. Pierre, MWRD’s Executive Director. Reference St. Pierre16 Not so in the United States where each of the 55,000 water utilities and 14,000 wastewater utilities wants to be sure that any technology adopted will be guaranteed to work and no central testing agency exists to ensure performance. Utility operators, especially those in northeastern Illinois, have not forgotten the lesson of our waste management past: today’s great ideas might become tomorrow’s problems. It’s certainly worth acknowledging there may be unintended consequences of resource recovery that become evident in the future. For example, as demand for waste material increases over the next century, will wastewater agencies be able to compete with private sector suppliers that may enter the market? And while treated biosolids and effluent meet stringent safety standards today, will future research make those same standards seem lax? If resource recovery technology requires more energy to operate—and therefore increases greenhouse gas emissions—are we minimizing one environmental problem while contributing to another, and is it a worthy trade-off? These are questions that must be asked, and many utility operators are still waiting for answers.
Finally, as with any bureaucracy, especially a large one, entropy dictates that leaders and employees maintain the status quo. Happily, as the examples in this article demonstrate, the culture at some major water and wastewater utilities is changing and moving in the direction of sustainability.
What’s the next frontier? Possibly Big Data…mining the wastes streaming into sewage plants for genetic information, for clues about disease, for insights into social trends in a given sewershed, for pharmaceutical use and minute amounts of rare metals. All these may someday be sources of revenue for sewage plants.
Resource recovery is the wave of the future but also, in some ways, a return to the ethics of earlier generations and simpler times. Practice thrift. Respect our common home. Take what you need, but let nothing go to waste. Give back to those who gave to you. The wisdom of these maxims may be more essential now than ever. The challenges we face—from invasive species, to budget shortfalls, to climate change—are unprecedented in their magnitude. But many of the solutions are, quite literally, hidden beneath our noses, in the expansive network of subsurface pipes and tunnels transporting water, nutrients, organics, and data over miles and miles throughout the great metropolis. Wastewater treatment systems are often, by design, out of sight and out of mind. It’s time for that to change.
Let this be the century of celebrating water and wastewater, resource recovery, and circular economies. Let the word “waste” imply nothing more than a lack of imagination.