


1. Introduction
In our previous works, we have analysed the viscous flow through an inhomogeneous granular material. As a first step, Sano (Reference Sano1983) analysed the effect of a macroscopic cylindrical hollow space (hereafter referred to as a ‘cavity’) exposed to an otherwise uniform flow  $U^\infty$ at infinity. The magnitude of the effect depends on the ratio $\zeta _0 \equiv R_0/\sqrt {k}$, where $R_0$ is the cavity size and $k$ is the permeability of the material. As $\zeta _0$ increases, the velocity at the centre of the circular cylindrical cavity $v_S^C$ becomes as large as $3 U^\infty$, whereas the volume flux into that cavity region $Q_S$ amounts to two times the volume flux $Q_0$ that would pass through the same region without the cavity. The analysis was extended to a three-dimensional cavity. Raja Sekhar & Sano (Reference Raja Sekhar and Sano2000) analysed the effect of a macroscopic spherical cavity exposed to an otherwise uniform flow $U^\infty$ at infinity. The latter revealed that the velocity at the centre of the cavity $v_S^C$ amounts to $6 U^\infty$, and that the volume flux into the cavity region $Q_S$ amounts to $3 Q_0$ as $\zeta _0$ increases. These results were experimentally verified by laser Doppler velocimetry (LDV) measurement for a cylindrical cavity (Momii Reference Momii1989). Meanwhile, experimental verification of a three-dimensional (3-D) cavity is limited because of the difficulty in experimental set-up and measurement of the 3-D cavity. However, as far as the hemispherical cavity bounded by a transparent plate across the diameter is concerned, the velocity field was measured by an LDV, and good agreement with theory was obtained except for the region very close to the plane boundary (Sano et al. Reference Sano, Sano, Takagi and Yamada2013). Above a certain critical velocity $U_c^\infty$, the cavity is found to be destroyed from the upstream-side boundary (see Kaneko & Sano Reference Kaneko and Sano2005; Sano & Kaneko Reference Sano and Kaneko2005; Koizumi, Shirahashi & Sano Reference Koizumi, Shirahashi and Sano2009; Sano et al. Reference Sano, Sano, Takagi and Yamada2013).
The interaction of two or more cavities in two-dimensional case are examined both experimentally (Kaneko & Sano Reference Kaneko and Sano2003, Reference Kaneko and Sano2005) and numerically (Sano & Nagata Reference Sano and Nagata2006a; Sano Reference Sano2008, Reference Sano2011). For instance, the interaction of two cavities of equal sizes depends on the centre-to-centre distance  $l$ between them as well as the orientation angle $\alpha$ between the centreline connecting the two cavities and the incident flow direction. These studies revealed that (i) the volume flux into the downstream cavity increases in a configuration with smaller $\alpha$ and smaller $l$, e.g. as much as $10\,\%$ increase was observed for $| \alpha | \lesssim 15^{\circ}$ and $l \lesssim 3$. On the other hand, they found that (ii) it decreases for larger $\alpha$ and smaller $l$, e.g. as much as $10\,\%$ decrease was observed for $|\alpha - 90^{\circ} |\lesssim 15^{\circ}$ and $l \lesssim 3$. The variations increase as much as $20\,\%$ as the distance $l$ becomes small, but decrease to a few per cent as $l$ becomes as large as 5. They also pointed out the possibility of the collapse of the cavities and fluidisation, which are caused by the local increase of the stress on the cavity boundaries due to the increase of the velocity (Kaneko & Sano Reference Kaneko and Sano2005; Sano & Kaneko Reference Sano and Kaneko2005; Sano & Nagata Reference Sano and Nagata2006a,Reference Sano and Nagatab; Sano Reference Sano2011, Reference Sano2020).
Recently, an asymptotic analysis of the two interacting cavities has been made in the 2-D case (Sano Reference Sano2020), and 3-D case (Sano, Karmakar & Sekhar Reference Sano, Karmakar and Sekhar2022). In the former, two circular cylindrical cavities are arranged in an arbitrary configuration, and the velocity, volume flux, stress distribution on the cavity boundaries, etc. are analysed by taking account of the effect of the other cavity asymptotically. The latter theory is applied to explain the experimental results on the collapse of two 2-D cavities, and the dependence of the position of the onset of collapse on the orientation angle  $\alpha$ is elucidated. The analysis is extended to the 3-D case, where two spherical cavities of the same radius $R_0$ are arranged along the stream. Making use of the axisymmetry and the fore–aft symmetry, the effect of the other cavity is asymptotically taken into account up to the order of $(R_0/l)^4$. The dependence of the velocity, volume flux, stress distribution on the cavity boundaries, etc. on the parameter $\zeta _0$ and the separation distance of the cavities $l$ are examined. For practical application, however, we need further analysis on two or more 3-D cavities of unequal sizes in a general configuration.
In order to access a solution that is applicable to a general configuration and is valid for any arbitrary position  $r$, one may develop a numerical solution that is based on computational approaches like the finite element, finite volume or boundary integral equations. Indeed, there is a preliminary numerical simulation of two spherical cavities of radius $a$ exposed to a uniform flow based on a two-fluid model (Sano Reference Sano2008). Although the latter provides the flow field in special cases such as $\alpha =0,\ {\rm \pi}/3$ and $\alpha ={\rm \pi} /2$ etc., under fixed $l/a=3$, as well as the volume flux $l/a$ vs $\alpha$ diagram into respective cavities ( $l$ is the centre-to-centre distance of the two cavities; $\alpha$ is the orientational angle), there is not much literature available in this direction. In this paper, the asymptotic analysis is extended to the interaction of two spherical cavities of radius $a$ and $b$ with arbitrary configuration $(l, \alpha )$. Although the present analysis is limited up to the order of $(a/l)^3$ or $(b/l)^3$, it allows cavities of arbitrary sizes and orientation. Particular attention is paid to the interaction of two cavities of equal size, and the dependences of the volume flux on the orientation $\alpha$ are examined. This is with a view to elucidating the mechanism of the collapse of cavities, as observed in 2-D experiments and the numerical simulation mentioned above, which may predict landslides, the collapse of the river banks and cliffs at times of heavy rainfall as well as create the new water channels in an otherwise impermeable granular tissues as in angiogenesis.
Note that the characteristics of the collapse, deformation and movement of our macroscopic cavity in a granular material are different from the behaviour of the void region in a fluidised bed observed in a solid–gas or fluid–gas transportation or processing system. In a solid–gas system such as a vertically set reactor of packed bed, void spaces in a granular material grow with the upward flow of gas. Here, the solid phase (the granular material) is dense and regarded as a continuous phase, among which small void domains (gas phase, sometimes referred to as ‘bubbles’) are distributed. Under a vertical stream, initially small void spaces side-by-side merge and/or catch up with each other as they rise up the packed bed of particles, which grow in size, and continue upward motion with acceleration by hydrostatic pressure. The macroscopic interface that distinguishes the solid and gas phases may depend on many factors, such as flow rate of the gas phase, concentration and distribution (or homogeneity) of each phase, ratio of material densities, etc. so that the boundary of these ‘bubbles’ may not necessarily be clear, but their direction of motion is the same as the main gas flow directed upward. With the increase of flow, the whole system turns into a pneumatic transport regime, through bubbling fluidisation and turbulent fluidisation (see Davidson & Harrison Reference Davidson and Harrison1963; Davidson, Harrison & Guedes de Carvalho Reference Davidson, Harrison and Guedes de Carvalho1977; Grace Reference Grace1986; Holdich Reference Holdich2002; Yang Reference Yang2003; Kunii & Levenspiel Reference Kunii and Levenspiel2013).
On the other hand, in the fluid–gas system, where fluid is the continuous phase, bubbles rise through the fluid phase, and their front boundaries form clear convex interfaces. Depending on the Reynolds number, Eötös number and Morton number, the rear side of the bubble may be dimpled, skirted or irregularly deformed, sometimes associated with a wobbling motion in addition to the convective motion by the upward main stream (Clift, Grace & Weber Reference Clift, Grace and Weber1978). Even in the absence of the main stream, bubbles move upwards under gravitational acceleration. In this case, if the bubble is viewed from the coordinate system fixed to the bubble, the latter is observed to be stationary, and is exposed to a uniform flow at infinity, which reveals the motion toward the upstream direction. The latter situation looks similar to our void space in a granular material exposed to a uniform flow at infinity. However, the difference lies in the presence of flux into the cavity, which obscures the front boundary. Our granular material with macroscopic cavity, which may be called a heterogeneous granular material, is in a quasi-equilibrium state, so that the mechanical structure is maintained by solid contact forces between highly concentrated grains. Viewed as a two-phase system, it may be regarded as a ‘fixed-bed’ regime as classified in the literature (Grace Reference Grace1986), but the flow direction is free from gravity in our system. So far, the fixed-bed regime has seemed to attract little attention in an industrial application or particle technology for the purpose of transportation of two-phase flows under gravity. Although a description of the slowly moving ‘bubble’ has been found, in which gas flow bends toward the bubble (Davidson & Harrison Reference Davidson and Harrison1963; Holdich Reference Holdich2002; Yang Reference Yang2003; Kunii & Levenspiel Reference Kunii and Levenspiel2013), the direction of motion of the ‘bubble’ is the same as that of the gas flow. In the latter, determination of minimum fluidisation velocity focuses on the force balance between the gravitational force and fluid drag, in which the bed is well expanded with the increase of fluid flow in the upward direction. However, in a far earlier stage before such an expansion occurs in which the main bodies of the particles are still in solid contact, the configuration change of grains at the boundary of a void space (larger than the interstices of particles) can trigger the global scale structural change. Thus, the prediction of an accurate velocity of the gas flow mentioned above will be important in fluidisation technology, to which such inhomogeneity of the gas phase (void space) is decisive. The transition from the fixed-bed regime to another regime is much more important in basically solid structures, where the local change of structure can trigger catastrophic phenomena, such as landslides, collapse of river banks and cliffs. As will be shown in this paper, the direction of propagation of the collapse in our case is opposite to the flow, which is a striking contrast to the void space propagation in a vertically set reactor of a solid–gas transportation system. Although our analytical approach is limited to a very early stage of the collapse, in which the cavity remains almost spherical, it provides the most vulnerable configuration of cavities and the direction of spread of the void space. Our findings will provide a clue to the mechanism of the collapse of the material by the enhanced fluid mechanical force, and will bridge the gap between fluidisation and solidification in granular materials (see Campbell Reference Campbell1990; MiDi Reference MiDi2004; Aranson & Tsimring Reference Aranson and Tsimring2006; Forterre & Pouliquen Reference Forterre and Pouliquen2008; Gray Reference Gray2018; Morris Reference Morris2020).
In the following, we show the method of calculation (§ 2), results on the flow and stresses due to the interaction of 3-D cavities (§ 3) and discuss (§ 4) their characteristics and physical implications for the collapse of granular material, based on the present calculation and the previous one. Conclusions (§ 5) and appendices follow.
2. Method of calculation
2.1. Governing equations
The basic equations we adopt are the equations of continuity for an incompressible viscous flow
 \begin{equation} \boldsymbol{\nabla}^* \boldsymbol{\cdot} {\boldsymbol v}^* = 0, \end{equation}
the generalised Darcy equation in a granular material
 \begin{equation} \frac{\mu}{k} {\boldsymbol v}^* ={-}\boldsymbol{\nabla}^* p^* +\mu \varDelta^* {\boldsymbol v}^*, \end{equation}
and the Stokes equation inside a clear fluid region
 \begin{equation} \mu \varDelta^* {\boldsymbol v}^*=\boldsymbol{\nabla}^* p^*, \end{equation}
where  ${\boldsymbol v}^*$ and $p^*$ are the velocity and the pressure, respectively, with physical dimensions, $\mu$ is the viscosity of the fluid and $k$ is the permeability of the granular material. The existing literature indicates that, although the ratio $\mu _e / \mu$ ( $\mu _e$ is the effective viscosity of fluid in the granular material) is of some interest, there is no precise mechanism to define it accurately. Accordingly, different models have been used to estimate the dependency of the effective viscosity $\mu _e$ on the viscosity $\mu$ inside a porous medium (see Givler & Altobelli Reference Givler and Altobelli1994; Martys, Bentz & Garboczi Reference Martys, Bentz and Garboczi1994; Ochoa-Tapia & Whitaker Reference Ochoa-Tapia and Whitaker1995; Nield & Bejan Reference Nield and Bejan2013). In order to avoid any ambiguity, several authors considered the ratio $\mu _e / \mu =1$ (see Koch, Hill & Sangani Reference Koch, Hill and Sangani1998; Masoud, Stone & Shelley Reference Masoud, Stone and Shelley2013), which is also the present case. For the general case $\mu _e/ \mu \ne 1$, see Appendix A. We impose the continuity of velocity and stress at the boundary of the cavity, which were satisfactorily satisfied by our previous analysis and experiments.
2.2. Flow through a single spherical cavity
2.2.1. General expressions
We have already obtained the flow through a macroscopic spherical cavity in an otherwise homogeneous granular material (Sano et al. Reference Sano, Karmakar and Sekhar2022). The variables are made non-dimensional by the characteristic length  $\sqrt {k}$ (microscopic scale) and the typical size of the cavity $R_0$ (macroscopic scale), velocity $U^\infty$ and viscosity $\mu$ as
 \begin{equation} {\boldsymbol x}=\frac{{\boldsymbol x}^*}{R_0},\quad {\boldsymbol v}=\frac{{\boldsymbol v}^*}{U^\infty},\quad (p, \tau_{ij})=\frac{(p^*, \tau_{ij}^*)}{\mu U^\infty / R_0}, \end{equation}
so that we have the basic equations in non-dimensional form
 \begin{equation} \boldsymbol{\nabla} \boldsymbol{\cdot} {\boldsymbol v} = 0,\quad (\varDelta -\zeta_0^2) {\boldsymbol v} = \boldsymbol{\nabla} p,\quad \Delta {\boldsymbol v} = \boldsymbol{\nabla} p, \end{equation}
where  $\zeta _0 = R_0/ \sqrt {k}$. If we consider a cavity of radius $a^*$ (or in normalised form $a =a^*/R_0$) exposed to an otherwise uniform flow $U_j^\infty$ in the $x_j$ direction, the flow field in non-dimensional form is given as follows.
(i) Outside cavity ( $r \ge a$)
 \begin{equation} v_i = [\delta_{ij}+T_{ij}({\boldsymbol r},a)] U_j^\infty,\quad T_{ij}({\boldsymbol r},a) = C(a) h_{ij}({\boldsymbol r})+D(a) H_{ij}({\boldsymbol r}), \end{equation}
where
 $$\begin{gather} h_{ij}({\boldsymbol r})=\left(f(r) \delta_{ij}-\frac{x_i x_j}{r^2} g(r)\right) \exp({-\zeta_0 r}),\quad H_{ij}({\boldsymbol r})={-}\frac{\delta_{ij}}{r^3}+\frac{3x_i x_j}{r^5}, \end{gather}$$
 $$\begin{gather}f(r)=\frac{\zeta_0^2}{r}+\frac{\zeta_0}{r^2}+\frac{1}{r^3},\quad g(r)=\frac{\zeta_0^2}{r}+\frac{3\zeta_0}{r^2}+\frac{3}{r^3}, \end{gather}$$
 $$\begin{gather}C(a)=\frac{15 a^3 \,{\rm e}^{\zeta_0 a}}{\varDelta_0(a)}, \quad D(a) = \frac{a^3 \varDelta_1(a)}{\varDelta_0(a)}, \end{gather}$$
 $$\begin{gather}\varDelta_0(a)=(\zeta_0 a)^3+6(\zeta_0 a)^2+45 \zeta_0 a+45, \quad \varDelta_1(a)=\varDelta_0(a)-30(\zeta_0 a+1). \end{gather}$$
 (ii) Inside cavity ( $r \le a$)
 \begin{equation} v_i=U_j^\infty [A(a) (2 r^2 \delta_{ij}-x_i x_j)+B(a) \delta_{ij}], \end{equation}
where
 \begin{equation} \left.\begin{gathered} A(a)={-} \frac{3\zeta_0^2 (1+\zeta_0 a)}{\varDelta_0 (a)},\quad B(a)=\frac{\varDelta_2(a)}{\varDelta_0 (a)},\\ \varDelta_2(a)=3[2(\zeta_0 a)^3+7(\zeta_0 a)^2+15 \zeta_0 a +15]. \end{gathered}\right\} \end{equation}
2.2.2. Flow through a single spherical cavity under  $U^\infty$ in the $x$ direction


For a particular case  $U_j^\infty = \delta _{jx}$, the above expressions are described as
 $$\begin{gather} v_x= 1+C(a)\left(f(r)-\frac{x^2}{r^2} g(r) \right) \exp({-\zeta_0 r}) +D(a) \left(-\frac{1}{r^3}+\frac{3x^2}{r^5}\right), \end{gather}$$
 $$\begin{gather}v_y={-}C(a)\frac{xy}{r^2}g(r)\exp({-\zeta_0 r}) +D(a)\frac{3xy}{r^5},\quad v_z = v_y ( y \rightarrow z ),\quad {\rm for}\ r \ge a, \end{gather}$$
 $$\begin{gather}v_x= A(a) (2r^2 - x^2)+B(a), \quad v_y={-} A(a) xy, \quad v_z = v_y ( y \rightarrow z), \quad {\rm for}\ r \le a. \end{gather}$$
 In terms of the spherical coordinate system, with the  $x$ axis along the flow direction at infinity, they are for $r \ge a$
 $$\begin{gather} v_r=\left(1-2C(a)\frac{1+\zeta_0 r}{r^3} \exp({-\zeta_0 r})+\frac{2D(a)}{r^3}\right) \cos\theta,\quad \left[= \frac{1}{r^2 \sin\theta} \frac{\partial \varPsi}{\partial \theta}\right], \end{gather}$$
 $$\begin{gather}v_\theta = \left({-}1-C(a)f(r) \exp({-\zeta_0 r})+\frac{D(a)}{r^3} \right) \sin\theta,\quad \left[={-} \frac{1}{r \sin\theta} \frac{\partial \varPsi}{\partial r}\right], \end{gather}$$
 $$\begin{gather} \varPsi = \sin^2\theta \left(\frac{1}{2} r^2 - C(a)\frac{1+\zeta_0 r}{r} \exp({-\zeta_0 r})+\frac{D(a)}{r}\right), \end{gather}$$
 $$\begin{gather}p= \zeta_0^2 \left({-}r+\frac{D(a)}{r^2}\right)\cos\theta, \end{gather}$$
 $$\begin{gather} \tau_{rr}= \left[\zeta_0^2 r+\frac{4C(a)}{r} g(r) \exp({-\zeta_0 r}) -D(a) \left(\frac{\zeta_0^2}{r^2}+\frac{12}{r^4}\right)\right]\cos\theta, \end{gather}$$
 $$\begin{gather}\tau_{\theta r}= \left[C(a)\left(\frac{\zeta_0^3}{r}+\frac{3\zeta_0^2}{r^2}+\frac{6\zeta_0}{r^3}+\frac{6}{r^4}\right) \exp({-\zeta_0 r}) -\frac{6D(a)}{r^4}\right]\sin\theta, \end{gather}$$
and for  $r \le a$
 $$\begin{gather} v_r= [A(a) r^2+B(a)] \cos\theta,\quad v_\theta ={-} [2A(a) r^2+B(a)]\sin\theta, \end{gather}$$
 $$\begin{gather}\varPsi = \tfrac{1}{2} [A(a) r^4+B(a)r^2] \sin^2\theta, \end{gather}$$
 $$\begin{gather} p=10 A(a) r \cos \theta, \end{gather}$$
 $$\begin{gather}\tau_{rr}={-}6 A(a) r\cos\theta,\quad \tau_{\theta r}={-}3 A(a) r\sin\theta. \end{gather}$$
2.3. Interaction of two spherical cavities
We consider two spherical cavities  ${{\rm C}a}$ and ${{\rm C}b}$ in a general configuration. This situation is described by first choosing the $x$ axis along the uniform flow, which passes the centre of the cavity ${{\rm C}a}$ (denoted by $O$). Next, we choose the $y$ axis such that it passes the centre of cavity ${{\rm C}a}$ and that the $xy$ plane includes the centre of the other cavity ${{\rm C}b}$ (denoted by $O'$). The third axis $z$ is chosen perpendicular to the $xy$ plane, so that the $x, y, z$ axes form the right-handed Cartesian coordinate system (see figure 1). We denote the radius of the cavities ${{\rm C}a}$ and ${{\rm C}b}$ by $a$ and $b$, respectively, and the centre-to-centre distance of the cavities by $l$. We assume non-overlapping cavities ( $l > a+b$), and denote the angle of orientation of the line connecting the centres of the two cavities from the $x$ direction by $\alpha$. We also take a spherical polar coordinate system $(r, \theta, \phi )$ with its origin at O, where $\theta$ is the zenith angle measured from the $x$ axis. We denote the position vector of ${\boldsymbol{OP}}$ by $\boldsymbol r$, ${\boldsymbol{O'P}}$ by ${\boldsymbol r}'$ and ${\boldsymbol{OO'}}$ by $\boldsymbol l$. Then the distance $r' (\equiv |{\boldsymbol r}'|)$ is given by $r' = \sqrt {l^2+r^2-2rl\cos (\theta -\alpha )+z^2}$, where $r = |{\boldsymbol r}|$.

Figure 1. Interaction of two cavities.
2.3.1. Flow outside the cavity
(i) Flow outside the two independent cavities
The flow field around a cavity  ${{\rm C}a}$ exposed to a uniform velocity $U^\infty \ (=1)$ in the $x$ direction at infinity, (2.4a,b) is expressed by
 \begin{equation} v_x= [1+ T_{xx}({\boldsymbol r},a) ] U^\infty,\quad v_y=T_{yx}({\boldsymbol r},a) U^\infty,\quad v_z=T_{zx}({\boldsymbol r},a) U^\infty, \end{equation}
and the flow around a cavity  ${{\rm C}b}$ is similarly given. In the presence of two independent cavities, we assume that the total flow field outside of the cavities is described by the superposition
 $$\begin{gather} v_x = 1+ T_{xx}({\boldsymbol r},a)+T_{xx}({\boldsymbol r}',b), \end{gather}$$
 $$\begin{gather}v_y = T_{yx}({\boldsymbol r},a)+T_{yx}({\boldsymbol r}',b),\quad v_z = T_{zx}({\boldsymbol r},a)+T_{zx}({\boldsymbol r}',b). \end{gather}$$
(ii) Flow outside the two interacting cavities
To increase the accuracy taking account of the effect of the other cavity, we estimate the induced flow  $\delta {\boldsymbol U}(O)$ near the cavity ${{\rm C}a}$ due to the cavity ${{\rm C}b}$ assuming that the two cavities are sufficiently far apart ( $l \gg a+b$)
 \begin{align} (\delta {U}_x^\infty (O), \delta { U}_y^\infty (O), \delta {U}_z^\infty (O)) &\equiv \left( T_{xx}({\boldsymbol r}',b), T_{yx}({\boldsymbol r}',b), T_{zx}({\boldsymbol r}',b) \right)|_{O}\nonumber\\ &=\frac{D_b}{l^3} ( K_x, K_y, 0)+O\left(\frac{r}{l}\right)^4, \end{align}
where
 \begin{equation} K_x = 3\cos^2\alpha -1, \quad K_y = 3\cos\alpha \sin\alpha, \end{equation}
and  $D_b = D(b)$ for brevity. The latter is the additional uniform flow on the cavity ${{\rm C}a}$ due to cavity ${{\rm C}b}$. Similarly, the additional uniform flow on the cavity ${{\rm C}b}$ due to cavity ${{\rm C}a}$ is
 \begin{equation} (\delta
{U}_x^\infty (O'), \delta {U}_y^\infty (O'), \delta {
U}_z^\infty (O')) = \frac{D_a}{l^3} ( K_x, K_y,
0)+O\left(\frac{r}{l}\right)^4.
\end{equation}
\begin{equation} (\delta
{U}_x^\infty (O'), \delta {U}_y^\infty (O'), \delta {
U}_z^\infty (O')) = \frac{D_a}{l^3} ( K_x, K_y,
0)+O\left(\frac{r}{l}\right)^4.
\end{equation}
Taking into account of the exponential decay of the Darcylet, and the  $r^{-3}$ decay of the dipole flow, we assume the local flow around respective cavities up to order $O(l^{-3})$ will be generated by the uniform flow $\delta _{xj} + \delta {U}_j^\infty$. In this approach, the velocity around the cavity ${{\rm C}a}$ is given by
 $$\begin{gather} {v}_x^a =[1+T_{xx}({\boldsymbol r},a)] \left(1+\frac{D_b}{l^3} K_x\right) +T_{xy}({\boldsymbol r},a)\left(\frac{D_b}{l^3}K_y\right) +O\left(\frac{r}{l}\right)^4, \end{gather}$$
 $$\begin{gather}{v}_y^a =T_{yx}({\boldsymbol r},a) \left(1+\frac{D_b}{l^3} K_x\right) +[1+T_{yy}({\boldsymbol r},a)]\left( \frac{D_b}{l^3}K_y\right) +O\left(\frac{r}{l}\right)^4, \end{gather}$$
 $$\begin{gather}{v}_z^a = T_{zx}({\boldsymbol r},a)\left(1+\frac{D_b}{l^3} K_x\right) +T_{zy}({\boldsymbol r},a) \left(\frac{D_b}{l^3} K_y\right) +O\left(\frac{r}{l}\right)^4. \end{gather}$$
Local velocity field around cavity  ${{\rm C}b}$ is similarly given by shifting the origin of the coordinate system to $O'$, describing the position vector ${\boldsymbol r}'$ from the latter and exchanging the roles of $a$ and $b$.
$b$.
To describe the global flow field we examine the superposition of (2.26a–c) and the similar flow field in which the roles of  ${{\rm C}a}$ and ${{\rm C}b}$ are exchanged. However, the asymptotic behaviour $(r \gg 1)$ of the above yields
 \begin{equation} {v}_x \sim 2+\frac{K_x}{l^3} (D_a+D_b),\quad {v}_y \sim \frac{K_y}{l^3} (D_a+D_b), \quad {v}_z \sim 0, \end{equation}
which should be  ${v}_x=1,\ {v}_y={v}_z=0$. Thus, our global flow field should be described by subtracting the flow field
 \begin{equation} {v}_x=1+\frac{K_x}{l^3} (D_a+D_b),\quad {v}_y=\frac{K_y}{l^3} (D_a+D_b),\quad {v}_z=0, \end{equation}
from the simply superposed flow field (for this renormalisation, see also Appendix B), so that we have
 \begin{align} {v}_x &= [1+T_{xx}({\boldsymbol r},a)] \left(1+\frac{D_b}{l^3} K_x\right) +T_{xy}({\boldsymbol r},a)\left(\frac{D_b}{l^3}K_y\right) \nonumber\\ &\quad +[1+T_{xx}({\boldsymbol r'},b)] \left(1+\frac{D_a}{l^3} K_x\right) +T_{xy}({\boldsymbol r'},b)\left(\frac{D_a}{l^3}K_y\right) -1-\frac{K_x}{l^3} (D_a+D_b), \end{align}
 \begin{align} {v}_y &= T_{yx}({\boldsymbol r},a) \left(1+\frac{D_b}{l^3} K_x\right)+ [1+T_{yy}({\boldsymbol r},a)]\left( \frac{D_b}{l^3}K_y\right) \nonumber\\ &\quad +T_{yx}({\boldsymbol r'},b) \left(1+\frac{D_a}{l^3} K_x\right) + [1+T_{yy}({\boldsymbol r'},b)]\left( \frac{D_a}{l^3}K_y\right) -\frac{K_y}{l^3} (D_a+D_b), \end{align}
 \begin{align} {v}_z &= T_{zx}({\boldsymbol r},a)\left(1+\frac{D_b}{l^3} K_x\right) +T_{zy}({\boldsymbol r},a) \left( \frac{D_b}{l^3} K_y\right) +T_{zx}({\boldsymbol r'},b)\left(1+\frac{D_a}{l^3} K_x\right) \nonumber\\ &\quad +T_{zy}({\boldsymbol r'},b) \left( \frac{D_a}{l^3} K_y\right). \end{align}
2.3.2. Flow inside the cavity
(i) Local flow field outside of cavities in terms of spherical coordinate system
To obtain the flow field inside the cavity  ${{\rm C}a}$, we rewrite (2.26a)–(2.26c) to a local spherical polar coordinate system $(r, \theta, \phi )$, whose origin is at the centre of cavity ${{\rm C}a}$. The polar axis is chosen along the $x$ axis from which the zenith angle $\theta$ is measured, while the azimuthal angle $\phi$ is measured from the $y$ axis. By these choices, we have
 \begin{equation} x=r\cos\theta,\quad y=r\sin\theta\cos\phi,\quad z=r\sin\theta\sin\phi. \end{equation}
Relations between the velocity components in the present spherical coordinate system and the Cartesian coordinates are
 \begin{equation}
\left({\begin{array}{@{}c@{}} {{v_r}}\\ {{v_\theta }}\\
{{v_\phi }} \end{array}} \right) = \left(
{\begin{array}{@{}ccc@{}} {\cos \theta } & {\sin \theta \cos
\phi } & {\sin \theta \sin \phi }\\ { - \sin \theta } &
{\cos \theta \cos \phi } & {\cos \theta \sin \phi }\\ 0 & {
- \sin \phi } & {\cos \phi } \end{array}} \right)\left(
{\begin{array}{@{}c@{}} {{v_x}}\\ {{v_y}}\\ {{v_z}}
\end{array}} \right).
\end{equation}
\begin{equation}
\left({\begin{array}{@{}c@{}} {{v_r}}\\ {{v_\theta }}\\
{{v_\phi }} \end{array}} \right) = \left(
{\begin{array}{@{}ccc@{}} {\cos \theta } & {\sin \theta \cos
\phi } & {\sin \theta \sin \phi }\\ { - \sin \theta } &
{\cos \theta \cos \phi } & {\cos \theta \sin \phi }\\ 0 & {
- \sin \phi } & {\cos \phi } \end{array}} \right)\left(
{\begin{array}{@{}c@{}} {{v_x}}\\ {{v_y}}\\ {{v_z}}
\end{array}} \right).
\end{equation}
In this coordinate system, the flow outside of the cavity  ${\rm C}{a}\ (r\ge a)$ is given by
 $$\begin{gather} v_r =\left(1+L(r,a) \right) \left[ \left(1+\frac{D_b}{l^3} K_x\right)\cos\theta +\frac{D_b}{l^3}K_y \sin\theta\cos\phi \right] +O\left(\frac{r}{l}\right)^4, \end{gather}$$
 $$\begin{gather}v_\theta ={-} \left( 1+M(r,a) \right) \left[ \left(1+\frac{D_b}{l^3} K_x\right) \sin\theta - \frac{D_b}{l^3}K_y \cos\theta\cos\phi \right] +O\left(\frac{r}{l}\right)^4, \end{gather}$$
 $$\begin{gather}v_\phi =\left(1+M(r,a) \right)\left(- \frac{D_b}{l^3} K_y \sin\phi\right) +O\left(\frac{r}{l}\right)^4, \end{gather}$$
where
 \begin{equation} \left.\begin{gathered} L(r,a) = C(a)[f(r)-g(r)]\exp({-\zeta_0 r})+\frac{2D(a)}{r^3},\\ M(r,a) = C(a) f(r) \exp({-\zeta_0 r})-\frac{D(a)}{r^3}, \end{gathered}\right\} \end{equation}
and  $f(r),\ g(r)$ are the same as those defined in (2.6a,b). The pressure and stress components up to $O((r/l)^3)$ are as follows:
 \begin{equation} p={-}\zeta_0^2 \left(r - \frac{D(a)}{r^2} \right) \left[\left(1+\frac{D_b}{l^3} K_x\right) \cos\theta + \frac{D_b}{l^3}K_y \sin\theta\cos\phi \right], \end{equation}
 \begin{align} \tau_{rr} &= \left[\zeta_0^2 r +\frac{4}{r} C(a) g(r)\exp({-\zeta_0 r})-D(a) \left(\frac{\zeta_0^2}{r^2}+\frac{12}{r^4}\right)\right] \nonumber\\ &\quad \times\left[\left(1+\frac{D_b}{l^3}K_x\right)\cos\theta+ \frac{D_b}{l^3} K_y\sin\theta\cos\phi \right], \end{align}
 \begin{align} \tau_{\theta r} &= \left[C(a)\left(\frac{\zeta_0^3}{r}+\frac{3\zeta_0^2}{r^2}+\frac{6\zeta_0}{r^3}+ \frac{6}{r^4}\right)\exp({-\zeta_0 r}) -\frac{6D(a)}{r^4}\right] \nonumber\\ &\quad \times\left[\left(1+\frac{D_b}{l^3}K_x\right)\sin\theta-\frac{D_b}{l^3} K_y \cos\theta\cos\phi \right], \end{align}
 \begin{align} \tau_{\phi r} &=\left[C(a) \left(\frac{\zeta_0^3}{r}+\frac{3\zeta_0^2}{r^2}+\frac{6\zeta_0}{r^3}+\frac{6}{r^4}\right) \exp({-\zeta_0 r}) -\frac{6D(a)}{r^4}\right] \frac{D_b}{l^3} K_y \sin\phi. \end{align}
The flow pertaining to cavity  ${{\rm C}b}$ is similarly given with replacement of $a, b, x, \ldots, r$ by $b, a, x', \ldots, r'$, using the local spherical polar coordinate system with origin $O'$.
$O'$.
(ii) Flow inside the respective cavities
Results shown in the previous subsections suggest that the flow inside cavity  ${{\rm C}a}$ is given by the type of solution (2.9), where the asymptotic flow $[1+( D_b/l^3) K_x+O(D_b / l^{4}) ] U^\infty$ in the $x$ direction and the one $(D_b/l^3)[K_y+O(D_b / l^{4}) ] U^\infty$ in the $y$ direction are superposed, so that the flow inside the cavity ${{\rm C}a}$ is expected to be of the form
 $$\begin{gather} {v}_x = \left(1+\frac{D_b}{l^3} K_x\right) [A(a) ( 2r^2 - x^2)+B(a) ]- \frac{D_b}{l^3} K_y A(a) xy +O\left(\frac{D_b}{l^{4}}\right), \end{gather}$$
 $$\begin{gather}{v}_y ={-} \left(1+\frac{D_b}{l^3} K_x\right) A(a)x y +\frac{D_b}{l^3} K_y [A(a) ( 2r^2 - y^2)+B(a) ] +O\left(\frac{D_b}{l^{4}}\right), \end{gather}$$
 $$\begin{gather}{v}_z ={-} \left(1+\frac{D_b}{l^3} K_x\right) A(a)x z -\frac{D_b}{l^3} K_y A(a) yz +O\left(\frac{D_b}{l^{4}}\right). \end{gather}$$
The flow inside the cavity  ${{\rm C}b}$ is similarly described by exchanging $a, b, x, y, r$ with $b, a, x', y', r'$.
In terms of the local spherical polar coordinate system pertaining to cavity  ${{\rm C}a}$, velocity components inside the cavity (2.36a–c) are given by
 $$\begin{gather} {v}_r = [A(a) r^2+B(a)] \left[ \left(1+\frac{D_b}{l^3}K_x \right)\cos\theta +\frac{D_b}{l^3}K_y \sin\theta\cos\phi \right] +O\left(\frac{D_b}{l^{4}}\right), \end{gather}$$
 $$\begin{gather}{v}_\theta ={-}[2A(a) r^2+B(a)] \left[ \left(1+\frac{D_b}{l^3}K_x \right)\sin\theta -\frac{D_b}{l^3}K_y \cos\theta\cos\phi \right] +O\left(\frac{D_b}{l^{4}}\right), \end{gather}$$
 $$\begin{gather}{v}_\phi ={-} \frac{D_b}{l^3}K_y [2A(a)r^2+B(a)] \sin\phi +O\left(\frac{D_b}{l^{4}}\right), \end{gather}$$
 \begin{equation} {p}=10 A(a) r \left[\left(1+\frac{D_b}{l^3}K_x\right) \cos \theta + \frac{D_b}{l^3}K_y \sin\theta \cos\phi\right]+O\left(\frac{D_b}{l^{4}}\right), \end{equation}
 $$\begin{gather} {\tau}_{rr}={-} 6 A(a) r \left[ \left(1+\frac{D_b}{l^3}K_x\right) \cos \theta+ \frac{D_b}{l^3}K_y \sin\theta \cos\phi\right]+O\left(\frac{D_b}{l^{4}}\right), \end{gather}$$
 $$\begin{gather}{\tau}_{\theta r} ={-} 3 A(a) r \left[ \left(1+\frac{D_b}{l^3}K_x\right) \sin \theta - \frac{D_b}{l^3}K_y \cos\theta \cos\phi\right]+O\left(\frac{D_b}{l^{4}}\right), \end{gather}$$
 $$\begin{gather}{\tau}_{\phi r} ={-} 3 \frac{D_b}{l^3}K_y A(a) r \sin\phi+O\left(\frac{D_b}{l^{4}}\right). \end{gather}$$
The coefficients  $A(a), B(a), C(a), D(a)$ are determined by the continuity of the velocity components and stress components at the boundary $r=a$, which are the same as (2.10a,b) and (2.7a,b). The flow inside the cavity ${{\rm C}b}$ is similarly determined by exchanging the roles of cavities ${{\rm C}a}$ and ${{\rm C}b}$.
3. Results
In a typical granular material we encounter, such as sand of grain size  $0.1 \sim 0.25$ mm, the observed value of the permeability is $k \sim 2 \times 10^{-7}\,\textrm {cm}^2$, which implies that the value of $\zeta _0$ is $2 \times 10^3$ for a cavity of 1 cm. We have shown in our previous papers (Sano Reference Sano1983; Raja Sekhar & Sano Reference Raja Sekhar and Sano2000; Sano et al. Reference Sano, Karmakar and Sekhar2022) that the $\zeta _0$-effect saturates at around $\zeta _0 \approx 100$. Therefore, we choose the magnitude of $\zeta _0 = 100$ as a consistent value in the following, unless otherwise stated. As far as the special case $\alpha = 0$ of the present calculation is concerned, our previous result (Sano et al. (Reference Sano, Karmakar and Sekhar2022), denoted here JFM2022), which is valid up to $O(1/l^4)$, agrees with the present analysis up to $O(1/l^3)$ by the change of renormalisation. More precisely, the normalisation of $\varPsi ^e$ ((4.2) of our JFM2022 paper) is made to all expressions by multiplying by a factor of $1/(1+2E/l^3)$, which is equal to $\varDelta / \varDelta _0$ ((4.15a–e) and (4.16a–c)). Then, the normalised $\varPsi$ differs from the $\alpha =0$ of the present case by $(3E_1r^3/l^4)\sin ^2\theta \cos \theta$. Here, the order of the latter is $O(1/l^4)$, but the flux into the cavity, estimated at $r=a, \theta ={\rm \pi} /2$, happens to be zero, because of the vanishing coefficient. This implies that the interaction appears to be at utmost $O(1/l^5)$, which is $0.03, 0.01, 0.004, \ldots$ for $l=2, 2.5, 3, \ldots$, respectively. In the present configuration, the above argument may not strictly be applied, but is expected to be valid in the $\alpha \approx 0$ region that covers the most influential part. We also show a comparison of our flow field with that obtained by numerical simulation as given in Appendix C, to support qualitative agreement. Based on this evidence, results obtained for $l/a \gtrsim 2.5$ are shown in the following.
3.1. Velocity field
We show some examples of the streamlines on the  $z=0$ plane.
Figure 2(a–c) shows the dependence on the separation distance  $l$ of the two cavities of the same size $(a=1, b=1)$ positioned in tandem ( $\alpha =0^{\circ }$); (a) $l=2.5$, (b) $l=3$, and (c) $l=5$. We see that the flow field is symmetric with respect to the mid-plane between the cavities.

Figure 2. Dependence of the flow field on the separation distance  $l$ (
$l$ ( $a=1, b=1, \alpha =0^{\circ }$, $\zeta _0=100$): (a) $l=2.5$; (b) $l=3$; (c) $l=5$.
Figure 3(a–c) shows the dependence on the orientation  $\alpha$ of the two cavities of the same size $(a=1, b=1)$ with $l=3$; (a) $\alpha =30^{\circ }$, (b) $\alpha =60^{\circ }$ and (c) $\alpha =90^{\circ }$.

Figure 3. Dependence of the flow field on  $\alpha$ in the $z=0$ plane ( $a=1, b=1, l=3$, $\zeta _0=100$): (a) $\alpha =30^{\circ }$; (b) $\alpha =60^{\circ }$; (c) $\alpha =90^{\circ }$.
Figure 4(a–d) shows the flow field for  $\alpha = 0^{\circ }, 30^{\circ }, 60^{\circ }, 90^{\circ }$, with $a=1, b=2$ and $l=6$. We see a change in flow pattern depending on the configuration of the two cavities.

Figure 4. Dependence of the flow field on  $\alpha$ in the $z=0$ plane ( $a=1, b=2, l=6$, $\zeta _0=100$): (a) $\alpha =0^{\circ }$; (b) $\alpha =30^{\circ }$; (c) $\alpha =60^{\circ }$; (d) $\alpha =90^{\circ }$.
Figure 5(a,b) describes examples of the perspective view of the streamlines. To avoid the complexity due to the overlapping streamlines, only those that flow into respective cavities are drawn. Here, the black broken lines show the positions of the cavities, whose centres are on the  $z=0$ plane. Note that only the dividing streamlines which flow into cavities ${{\rm C}a}$ and ${{\rm C}b}$ are drawn in blue and red, respectively, and that those of the upstream-side ones are drawn.

Figure 5. Perspective view of the streamlines for (a)  $\alpha = 45^{\circ}$ and (b) $\alpha = 10^{\circ}$, ( $a=b=1, l=4.0$).
3.2. Velocity profiles
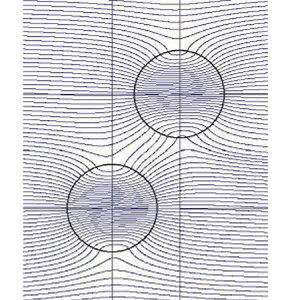
Figure 6 shows the contour plot of the velocity  $v = \sqrt {v^2_x+ v^2_y}$ on the $z = 0$ plane. The dotted pink and black circles show the position of the cavities. We see that the velocity increases as we move towards the centre of the respective cavities. The flow behaviour is $180^{\circ}$ rotational symmetric about the mid-point between the centre of the two cavities. The flow field around each of the cavities reflects the dipole characteristics. Namely, the far field around a single cavity is
 \begin{align} v_x \sim 1 + T_{xx}({\boldsymbol r}, a)\approx 1 + \left(\frac{a}{r}\right)^3 (3 \cos^2 \theta - 1),\quad v_y \sim T_{xy}(r, a) \approx \left(\frac{a}{r}\right)^3 3 \cos \theta \sin \theta, \end{align}
so that  $v \approx 1$ for $\theta =\alpha _c \equiv \pm \cos ^{-1}(1/\sqrt {3}) = \pm 54.7356\cdots ^{\circ} (\textrm {mod}\ 180^{\circ} )$ for $r \gg a$. The main contribution to the flow at a distance comes from the second term in $T_{ij}$, that characterises the potential doublet. Indeed, respective terms of $T_{ij}$ are
 \begin{align} \left.\begin{gathered} C(a) h_{ij} \sim C(a)\exp({-\zeta_0 r}) \sim \frac{15}{\zeta_0 r} \left(1-\frac{6}{\zeta_0 a} +O\left(\frac{1}{\zeta_0 a}\right)^2\right) \exp({-\zeta_0 (r-a)}),\\ D(a)H_{ij} \sim \frac{a^3}{r^3}\left(1-\frac{30}{(\zeta_0 a)^2}+O\left(\frac{1}{\zeta_0 a}\right)^3\right), \end{gathered}\right\} \end{align}
the former being very small compared with the latter for  $\zeta _0 \gg 1, r \gg a$. Here, contour-value unity is due to the uniform far field condition. Fore-and-aft symmetry of the flow field is observed for the case $\alpha = 0^{\circ}$ with respect to the mid-plane (see figure 6a). One may observe that, for the cases $\alpha = 0^{\circ}$ and $30^{\circ}$, the water chain connecting the cavities is strong (see figure 6a,b), and for the case $\alpha \gtrsim 55^{\circ }$ the water chain is weak (figure 6c,d). In other words, the interaction of the cavities is more prominent when the two cavities are oriented nearly along the flow and less prominent with increase of $\alpha$ (up to $\alpha \lesssim 55^{\circ }$). As $\alpha$ further increases, the water chain almost disappears and contour lines in the respective cavities tend to become independent. For the case $\alpha =90^{\circ }$ we can recognise a negative interaction between the cavities, and the water chain disappears completely (see figure 6d).

Figure 6. Contour plot of the magnitude of velocity  $v$ on the $z=0$ plane ( $a=b=1, l=2.5, \zeta _0=100$): (a) $\alpha =0^{\circ }$; (b) $\alpha =30^{\circ }$; (c) $\alpha =55^{\circ }$; (d) $\alpha =90^{\circ }$.
Dependence of  $v_{x}$ on $l$ for two equal sized cavities positioned in tandem is shown in figure 7(a). We see that the velocity profile in this case is symmetric with respect to the plane $x=l/2$. As $l$ increases the velocity at the respective centres decreases. For sufficiently large $l$, two cavities are almost independent. As $l$ decreases, the velocity at the centre of the respective cavities increases. These dependencies will be further clarified in the next subsection.

Figure 7. Velocity profile along the  $x$ axis for two cavities of equal radii ( $a=b=1, \zeta _0=100$). (a) Dependence of $v_x$ on $l$ (
$l$ ( $\alpha =0^{\circ }$). (b) Dependence of $v_x$ on $\alpha$ ( $l=4$).
Figure 7(b) depicts the axial velocity for two equal size cavities but with different orientation angles  $\alpha$. Difference of the velocity is remarkable for the cases $\alpha =0^{\circ }$ and $\alpha =30^{\circ }$ whereas it is less when $\alpha =60^{\circ }$ and $\alpha =90^{\circ }$. The reason is easily seen from figures 6(c) and 6(d), where contour lines around cavity ${\rm C}{b}$ have almost no overlap across the mid-plane between the centre of the two cavities. One noticeable thing is that the axial velocity in the neighbouring portion of the first cavity for $\alpha \approx 55^{\circ }$ case is the same as that of a single cavity (see figure 7b).
Figure 8 shows the velocity profile  $v_{x}$ on the plane passing the centres of both cavities. Here, the velocity profile is plotted with respect to $x=0$ (blue line) and $x=l \cos \alpha$ (red line). As $\alpha$ increases, the maximum velocity at the respective centres decreases. We see that, for $\alpha =0^{\circ }$, the magnitude of the axial velocity is larger (see figure 8a) than that for $\alpha =30^{\circ }$ and $\alpha =60^{\circ }$ (see figure 8b,c). This fact implies that cavities positioned nearly along the flow interact strongly.

Figure 8. Velocity profile on the  $z=0$ plane along $x=0$ (blue) and $x=l \cos \alpha$ (red) ( $a=b=1,l=2.5,\zeta _0=100$): (a) $\alpha =0^{\circ }$; (b) $\alpha =30^{\circ }$; (c) $\alpha =60^{\circ }$.
Figure 9 shows the axial velocity profile along the  $x$-axis for two cavities of different sizes in a tandem position ( $\alpha =0^{\circ}$). Figure 9(a) shows the $v_x$ profile for different sizes of cavity ${{\rm C}b}$ keeping the size of ${{\rm C}a}$ and the distance $l$ constant. We observe that the peak velocity of ${{\rm C}a}$ increases as $b$ increases, whereas the peak velocity of ${{\rm C}b}$ is almost unchanged. The same characteristics are recognised if the positions of ${{\rm C}a}$ and ${{\rm C}b}$ are exchanged. Thus, it follows that, if two cavities of different sizes are placed at a fixed distance along the stream, the peak velocity of the larger cavity is almost unchanged whereas that of the smaller cavity is remarkably influenced. Figure 9(b) shows the dependence of $v_x$ on $\zeta _0$, in which two cavities of different sizes are positioned in tandem. We see that the magnitude of the velocity increases with $\zeta _0$. The velocity is almost uniform for low values of $\zeta _0$ due to the high permeability of the porous medium. We see that, when $r \gg 1$, $v_x \approx 1$ owing to the undisturbed flow.

Figure 9. Velocity profile along the  $x$ axis for two cavities of unequal radii ( $a=1, \alpha =0^{\circ}, l=6$). (a) Dependence on $b$, and (b) dependence on $\zeta _0$.
3.3. Velocity at the centre of the cavity
From (2.36a)–(2.36c), the velocity at the centre of the cavity  ${{\rm C}a}$ is
 \begin{equation}
(v_x)^{C}_{a} =
\left(1+\epsilon_{bl} K_x\right) B(a),\quad (v_y)^{C}_{a}
= \epsilon_{bl} K_y B(a),\quad (v_z)^{C}_{a} = 0,
\end{equation}
\begin{equation}
(v_x)^{C}_{a} =
\left(1+\epsilon_{bl} K_x\right) B(a),\quad (v_y)^{C}_{a}
= \epsilon_{bl} K_y B(a),\quad (v_z)^{C}_{a} = 0,
\end{equation}
where  $\epsilon _{bl}=D_b/l^3$, so that the magnitude $v^{C}_{a}$ and orientation $\theta ^{C}_{a}$ are
 \begin{align} v^{C}_{a} &= B(a) \sqrt{(1+\epsilon_{bl}K_x)^2+(\epsilon_{bl}K_y)^2} \nonumber\\ &= B(a) \sqrt{[1+\epsilon_{bl}(3\cos^2\alpha-1)]^2+9(\epsilon_{bl}\cos\alpha \sin\alpha)^2}, \end{align}
 \begin{align} \theta^{C}_{a} &=\arctan\left(\frac{\epsilon_{bl}K_y}{1+\epsilon_{bl}K_x}\right) = \arctan\left(\frac{3\epsilon_{bl}\cos\alpha \sin\alpha} {1+\epsilon_{bl}(3\cos^2\alpha-1)}\right). \end{align}
The velocity and orientation of the flow at the centre of cavity  ${{\rm C}b}$ are similarly given by exchanging the roles of ${{\rm C}a}$ and ${{\rm C}b}$.
3.3.1. Velocity at the centre of cavities positioned in tandem
The maximum velocity  ${v^{C}_{a}}_{max}$ at the centre of cavity ${{\rm C}a}$ is achieved at $\alpha =0^{\circ}$, and is given by
 \begin{equation} {v^{C}_{a}}_{max}=(1+2\epsilon_{bl}) B(a)=\left(1+2\frac{b^3}{l^3} \frac{\varDelta_1(b)}{\varDelta_0(b)}\right) \frac{\varDelta_2(a)}{\varDelta_0(a)}, \end{equation}
whereas that of the maximum velocity at the centre of cavity  ${{\rm C}b}$ is
 \begin{equation} {v^{C}_{b}}_{max}=(1+2\epsilon_{al}) B(b)=\left(1+2\frac{a^3}{l^3} \frac{\varDelta_1(a)}{\varDelta_0(a)}\right) \frac{\varDelta_2(b)}{\varDelta_0(b)}. \end{equation}
For  $\zeta _0 \gg 1$, (3.5a) and (3.5b) are approximated as
 \begin{equation} {v^{C}_{a}}_{max}= 6\left[1+2\frac{b^3}{l^3}\left(1-\frac{30}{(\zeta_0 b)^2}+\cdots \right)\right]{\cdot} \left[1- \frac{5}{2 \zeta_0 a}\left(1+ \frac{3}{\zeta_0 a}+\cdots \right)\right], \end{equation}
and
 \begin{equation} {v^{C}_{b}}_{max}= 6\left[1+2\frac{a^3}{l^3}\left(1-\frac{30}{(\zeta_0 a)^2}+\cdots \right)\right]{\cdot} \left[1- \frac{5}{2 \zeta_0 b}\left(1+ \frac{3}{\zeta_0 b}+\cdots \right)\right]. \end{equation}
Under given values of fixed  $a, l$ and larger $\zeta _0$, variation of $b$ influences ${v^{C}_{a}}_{max}$ remarkably, whereas it influences ${v^{C}_{b}}_{max}$ only slightly. For example, by putting $a=1,\ l=6, \zeta _0=100$, as shown in figure 9(a), we have ${v^{C}_{a}}_{max}\approx 5.89, 6.02, 6.27$ and $6.68$, whereas ${v^{C}_{b}}_{max} \approx 5.89, 5.95, 5.98$ and $5.99$, respectively, for $b=1, 1.5, 2$ and $2.5$.
Similarly, for  $a=1,\ b=2,\ l=6$ as shown in figure 9(b), we have ${v^{C}_{a}}_{max}\approx 6.07$ and ${v^{C}_{b}}_{max} \approx 5.89$ for $\zeta _0=50$, whereas ${v^{C}_{a}}_{max} \approx 4.39$ and ${v^{C}_{b}}_{max} \approx 5.09$ for $\zeta _0=10$, respectively, which confirm the results shown in figure 9(a,b).
3.3.2. Configuration dependence on the velocity at the centre of the cavities
We consider the magnitude of the velocity and flow direction at the centres of two cavities of equal size. In this case, the flow field has  $180^{\circ}$ rotational symmetry about the mid-point joining their centres. Figure 10(a) shows the dependence of the magnitude of the velocity $v^{C}_{a}$ at the centre of cavity ${{\rm C}a}$ on the configuration $\alpha$ and $l$ of cavity ${{\rm C}b}$ for the $\zeta _0=100$ case. Note that the latter maximum velocity amounts to 6.28, 5.94 and 5.86 at $\alpha =0$ for $l=3, 5, 10$, respectively, which agrees with our previous calculation (see Sano et al. (Reference Sano, Karmakar and Sekhar2022), figure 14). We also note that the velocity $v^{C}_{a}$ is larger than that for a single cavity $v^C_S ({\approx }5.8377\ \textrm {for}\ \zeta _0=100)$ when the angle of orientation $\alpha$ is less than approximately $\alpha _c \approx 55^{\circ}$. The magnitude $v^{C}_{a}$ decreases monotonically as $\alpha$ increases, and becomes smaller than $v^C_S$ when $\alpha$ exceeds $\alpha _c$. The range of variation, however, decreases with the increase of the distance between the two cavities. Figure 10(b) shows the flow direction $\theta ^{C}_{a}$ at the centre of cavity ${{\rm C}a}$. The dotted line shows the configuration in which $\theta ^{C}_{a}$ becomes maximum (the same positions are also shown in figure 10a). The latter is given by $\theta ^{C}_{a} \approx (3/2) \epsilon _{bl} \sin 2\alpha +\cdots$ for a given configuration $l,\ b$ with $\epsilon _{bl} \ll 1$, so that it tends to $\alpha =45 ^{\circ}$ as $\epsilon _{bl}$ goes to zero. However, the two cavities become almost independent for sufficiently large $l$, so that the velocity at respective centres looks parallel to the incident flow in the $x$ direction.

Figure 10. Dependence of the velocity  $v^{C}_{a}$ on the separation distance $l$ of two cavities of equal size ( $\zeta _0=100$): (a) magnitude and (b) flow direction.
When the sizes of the two cavities are not equal, the above-mentioned tendency is much enhanced in the smaller cavity, whereas the influence is less remarkable in the larger cavity. Figures 11(a) and 11(b) are examples of  $v^{C}_{a}, v^{C}_{b}$ and $\theta ^{C}_{a},\ \theta ^{C}_{b}$, respectively. Here, $l=5, a=1$ and $\zeta _0=100$ are fixed, and $b$ is varied. To see the tendency, data for $b$ up to 2.5 are also added. The data points for ${{\rm C}a}$ and ${{\rm C}b}$ are shown by solid curves and dotted curves, respectively, although the variation of the latter are indistinguishably small compared with those of the former. The influence of the larger cavity ${{\rm C}b}$ on the smaller cavity ${{\rm C}a}$ is remarkable. For $a=1, b=2, l=5$, for example, the velocity at the centre of cavity $v^{C}_{a}$ amounts to 6.58 whereas that for cavity $v^{C}_{b}$ is 6.02 (for $a=1, b=2.5, l=5$, they are $v^{C}_{a}=7.30$ and $v^{C}_{b}=6.03$). The maximum deflections of the flow direction at respective centres are $\theta _a^C=5.33^{\circ}$ and $\theta _b^C=0.68^{\circ}$ for the case $a=1, b=2, l=5$, whereas they are $\theta _a^C=10.1^{\circ}$ and $\theta _b^C=0.68^{\circ}$ for the $a=1, b=2.5, l=5$ case. These examples show that the smaller cavity is highly involved in the local flow created by the larger cavity, but that the larger cavity suffers less influence from the smaller one (e.g. see particularly figures 4(b,c) and 9(a,b)).

Figure 11. Comparison of the (a) magnitude of the velocity  $v^{C}_{a},\ v^{C}_{b}$ and (b) flow direction $\theta ^{C}_{a},\ \theta ^{C}_{b}$ at the centres of cavities of different sizes, where $a = 1$ and $l=5$ are fixed while $b$ is varied ( $\zeta _0=100$); ${{\rm C}a}$ (solid curves) and ${{\rm C}b}$ (dotted curves).
These results agree with those shown in the previous subsection, which will be discussed later in the collapse of two cavities of different sizes.
3.4. Volume flux into the cavities
We shall consider two spherical cavities positioned at an arbitrary configuration, and examine the effect of the interaction on the volume flux into the respective cavities. To do this, we assume that the sizes of the cavities are the same ( $a=b=1$) as a simplest case, and focus our attention on the dependence on the configuration. Figures 12(a) and 12(b) show the volume fluxes into ${{\rm C}a}$ and ${{\rm C}b}$, respectively. In each figure, the abscissa is the centre-to-centre distance $l$ between the two cavities, and the ordinate is the orientation $\alpha$ of ${{\rm C}b}$ with respect to the direction of the velocity at infinity. The value of the volume flux is normalised by the flux $Q_S$ into a single cavity of radius $a$, where $Q_S \rightarrow 3({\rm \pi} a^2)$ as $\zeta _0 \rightarrow \infty$. The contour map describing the $\alpha - l$ dependence is qualitatively the same as that obtained for two 2-D cavities (Kaneko & Sano Reference Kaneko and Sano2003; Sano & Nagata Reference Sano and Nagata2006a; Sano Reference Sano2020).

Figure 12. Volume flux into cavities of the same size  ${{\rm C}a}$ and ${{\rm C}b}$ ( $\zeta _0=100$); dependence of configuration. The inset is the close-up view around this region. (a) Upstream cavity ${{\rm C}a}$; (b) downstream cavity ${{\rm C}b}$.
We first note that, in the  $\alpha =0^{\circ}$ case, the volume flux into each cavity is larger than that which flows into a single cavity, as a result of the global effect that the combined two cavities play the role of a single larger cavity. The interaction duly decreases with the distance $l$, and tends to the same value as that for the single cavity. The two-cavity interaction described above agrees with our previous work dealing with axisymmetric case (Sano et al. Reference Sano, Karmakar and Sekhar2022). These tendencies are also recognised for smaller $\alpha$.
How about the off-axial configuration? Figures 12(a) and 12(b) show that the variation of the volume flux into respective cavities is generally recognised in  $l \lesssim 5$. The volume flux is enhanced in the region $\alpha \lesssim \alpha _1(l)$, whereas it is reduced in the region $\alpha \gtrsim \alpha _2(l)$. The numerical value of these criteria depends, of course, on the configuration. Roughly speaking, a $5\,\%$ increase of the volume flux is expected within the region bounded by the $(l, \alpha _1) \approx (3.5, 0^{\circ} ) - (3.3, 15^{\circ} ) - (3.0, 30^{\circ} ) - (2.5, 45^{\circ} )$ curve, and an increase of $10\,\%$ is expected within the $(l, \alpha _2) \approx (2.7, 0^{\circ} ) - (2.6, 15^{\circ} ) - (2.5, 25^{\circ} )$ curve. In contrast, a $5\,\%$ decrease is observed within the region bounded by the $(l, \alpha _3) \approx (2.7, 90^{\circ} ) - (2.5, 80^{\circ} )$ curve. The latter is ascribed to our observation that the two cavities exert their suction effect almost independently, so that the fluid volume in the middle region on the upstream side that overlaps their influences is divided and flows into respective cavities (see i.e. figure 3c).
It should be remarked that the dependence of the volume flux on  $l$ and $\alpha$ differs between the upstream cavity and the downstream one. Although the magnitude of the difference is not very large, a region is recognised in which the volume flux varies non-monotonically in the downstream cavity, whereas it is not the case in the upstream cavity. This apparent asymmetric $l-\alpha$ dependence between ${{\rm C}a}$ and ${{\rm C}b}$ is recognised around the configuration $l\approx 4$ and $\alpha \approx 15 \sim 45^{\circ}$, which we shall examine in more detail. Figure 13(b–d) shows the stream tubes projected on the $xy$ plane, where the flows into cavity ${{\rm C}a}$ and ${{\rm C}b}$, respectively, are drawn in blue and red curves. In figure 13(a), red closed circles show the region where the volume flux into cavity ${{\rm C}b}$ is larger than that into cavity ${{\rm C}a}$. Figure 13(b–d) corresponds to the typical configurations marked $\textrm {A}\sim \textrm {C}$ as shown in figure 13(a). A closer look at figure 12(b) reveals that the volume flux contour shows a non-monotonic behaviour around $l\approx 4$ and $\alpha \approx 20^{\circ }$. As shown in figure 13(b), where $l= 4$ and $\alpha = 45^{\circ}$, the stream tube that flows into the downstream cavity is dilated by the upstream cavity, so that the volume flux increases. In contrast, as shown in figure 13(d), where $l=4$ and $\alpha =10^{\circ}$, the stream tube that flows into the downstream cavity is constricted by the upstream cavity, so that the volume flux decreases. Figure 13(c), where $l=4$ and $\alpha =25^{\circ}$, shows a marginal case, in which the volume flux is almost independent of the upstream cavity. Although these figures give only the 2-D projections, their 3-D perspective views (e.g. as shown in figures 5(a) and 5(b) corresponding to figures 13(b) and 13(d), respectively) support the above-mentioned variation.

Figure 13. (a) Comparison of the volume flux into cavities  ${{\rm C}a}$ and ${{\rm C}b}$ of the same size. Red closed circles show the region where the volume flux into cavity ${{\rm C}b}$ is greater than that into cavity ${{\rm C}a}$. (b) Stream tubes projected on the $xy$ plane that flow into cavities ${{\rm C}a}$ (blue) and ${{\rm C}b}$ (red) for the cases (A) $l=4.0, \alpha =45^{\circ }$, (B) $l=4.0, \alpha =25^{\circ }$ and (C) $l=4.0, \alpha =10^{\circ }$. (b–d) Correspond to the configurations marked in figure 13(a). (b,d) Respectively show the dilation and constriction of the stream tube into the downstream cavity.
3.5. Stress on the boundary of cavities
The normal stress on the boundary of granular material is important in that it determines the critical condition for the collapse of a cavity. In particular, the negative normal stress i.e. the normal stress from solid region to fluid region, is of crucial importance for this criterion, because granular materials on the boundary are robust against the normal stress from fluid to solid direction (as a consequence of the well-known ‘excluded volume’ effect), whereas the normal stress of the opposite direction has very small resistance.
The stress on the boundary of cavity  ${{\rm C}a}$ is given in (2.39a), which takes maximal value on the plane $\phi =0$
 \begin{align} (\tau_{rr})^B_a &= 6 a (- A(a))[ (1+\epsilon_{bl}K_x)\cos\theta+\epsilon_{bl}K_y \sin\theta] ={-}\frac{6a A(a)}{ A(a) a^2+B(a)} (v_r)^B_a \nonumber\\ &= {\tau}^B_a\cos(\theta-\theta^{C}_{a}), \end{align}
where  $(v_r)^B_a$ is the radial velocity component at the boundary of cavity ${{\rm C}a}$
 \begin{equation} {\tau}_a^B = 6 a( - A(a))\sqrt{(1+\epsilon_{bl}K_x)^2+(\epsilon_{bl}K_y)^2} ={-}\frac{6a A(a)}{B(a)} v^{C}_{a}, \end{equation}
where  $v^{C}_{a}$ and $\theta _a^C$ are defined in (3.4a) and (3.4b), respectively. The last term of (3.8) is the expression using the magnitude of the velocity at the centre of cavity ${{\rm C}a}$ as defined in (3.4a). Similarly, the normal stress on the boundary of (downstream-side) cavity ${{\rm C}b}$ is given by exchanging the roles of cavity ${{\rm C}a}$ and cavity ${{\rm C}b}$. We first examine the interaction of two cavities of an equal size ( $a=b=1$). An example of the contour map on the $l$-
$l$- $\alpha$ plane is given in figure 14 for the $\zeta _0 = 100$ case, showing the deviation of the relative magnitude $\delta \tau ^*_{rr}$ of the normal stress component from that of the single cavity (i.e. $-6aA(a)$), defined as
 \begin{equation} \delta\tau^*_{rr}=\frac{\tau_{a}^B}{(- 6 a A(a))} - 1. \end{equation}
Along the curve  $\alpha = \alpha _c(l)$ such that $\delta \tau ^*_{rr}=0$, the magnitude of the normal stress is the same as that for a single cavity of the same size. This critical configuration $\alpha _c$ is given by
 \begin{equation} \alpha_c=\arccos\sqrt{\frac{ 2-\epsilon_{bl} }{ 3 (2+\epsilon_{bl} )}}, \end{equation}
which tends to  $\cos ^{-1} (1/\sqrt {3})=54.7356\cdots ^{\circ }$ as the centre-to-centre distance of the cavities $l$ becomes large. For the configuration $(l, \alpha )$ with $\alpha < \alpha _c(l)$, two cavities collapse more easily than they are placed independently. On the contrary, in the region $\alpha > \alpha _c(l)$, the two cavities are more robust than when they are placed independently. These tendencies are enhanced for shorter $l$ in either case. As has been remarked in our previous paper (Sano et al. Reference Sano, Karmakar and Sekhar2022), two cavities along the stream are easier to collapse and merge, which may create a long waterway along the stream if the distance between them is sufficiently small.

Figure 14. Dependence of maximum normal stress on  $l$ and $\alpha$ ( $\zeta _0=100,\ a=b=1$).
We next examine two cavities of unequal size. To see this, we remark from (3.8) that
 \begin{equation} {\tau}^B_a = \frac{18}{a} \left(1-\frac{5}{\zeta_0 a}+O\left(\frac{1}{(\zeta_0 a)^2}\right)\right) \left[1+\left(\frac{b}{l}\right)^3(3\cos^2\alpha-1)+O\left(\frac{b}{l}\right)^6\right], \end{equation}
for  $\zeta _0 a \gg 1$ and $b/l \ll 1$, which is often encountered in practical granular material. The maximum stress is inversely proportional to the radius of the cavity, which suggests that the smaller cavity collapses easier than the larger one. We shall discuss this apparently contradicting result (see Koizumi et al. Reference Koizumi, Shirahashi and Sano2009) in the next section.
4. Discussion
4.1. Criterion for the collapse of the granular surface
We shall consider the criterion for the collapse of a single spherical cavity of radius  $a^*$, which is given in dimensional form as
 \begin{align} {\tau^*}_{rr}^{3D}|_{r=a}= \frac{\mu U_c^\infty} {a^*} [{-}6 a A(a)\,]^* \cos\theta \approx \frac{18 \mu U_c^\infty} {a^*}\left(1-\frac{5\sqrt{k}}{a^*}+\cdots\right) \cos\theta\quad{\rm for}\ \zeta_0 a \gg 1, \end{align}
where  $[\cdots ]^*$ implies that the quantity is evaluated with physical dimensions. To apply the present result to the collapse of macroscopic cavities in the granular material, we shall examine the following two scenarios.(Scenario 1): from (4.1), the largest negative stress is exerted at $\theta ={\rm \pi}$ on the cavity, so that the material is destroyed at this point above a certain critical velocity at infinity $U_{c1}^\infty$
 \begin{equation} U_{c1}^\infty = \frac{f_c a^*}{18 \mu}\left(1+\frac{5\sqrt{k}}{a^*}+\cdots\right), \end{equation}
where  $f_c$ is a critical stress describing the ‘hardness’ of the material. The above scenario suggests that the larger cavity is more robust than the smaller one. (Scenario 2): if we assume that a small but finite portion of the upstream boundary $\theta _1\le \theta \le {\rm \pi}$ ( $\theta _1={\rm \pi} - \Delta \theta _c,\ \Delta \theta _c \ll 1$) is relevant for the force balance, the local suction force $F_f$ created by the viscous fluid is estimated as
 \begin{equation} F_f = \int_{\theta_1}^{\rm \pi} {\tau^*}_{rr}^{3D}|_{r=a} \cos\theta\,{\rm d} S = 18{\rm \pi} \mu a^* (\Delta\theta_c)^2 U^\infty \left(1-\frac{5\sqrt{k}}{a^*}+\cdots\right). \end{equation}
In this case, the critical velocity for collapse  $U_{c2}^\infty$ is
 \begin{equation} U_{c2}^\infty = \frac{F_c}{18{\rm \pi} \mu a^* (\Delta\theta_c)^2} \left(1+\frac{5\sqrt{k}}{a^*}+\cdots\right), \end{equation}
where  $F_c (=F_f)$ is a critical force describing the ‘hardness’ of the material. If the collapsible portion $\Delta \theta _c$ is constant, the present scenario suggests that smaller cavity is more robust than the larger one.
The apparent discrepancy on the dependence of  $U_c^\infty$ on $a^*$ is resolved by assuming the relation $\Delta S = {\rm \pi}(a^* \Delta \theta _c)^2$ and $f_c = F_c/\Delta S$, so that the two expressions are the same irrespective of $\Delta \theta _c$. Scenario 1 is rather a mathematical perspective and refers to a point on the cavity boundary, whereas scenario 2 refers to a physical perspective in which the finite size of the grains is taken into account. In the latter, a few grains around the maximum suction point will be involved in the collapse. Which scenarios are plausible? For clarifying this question, we need an independent check either in experimental or numerical studies. So far, we have no systematic experimental data on the collapse of the spherical cavities. In the quasi-2-D experiments, however, we obtained the results that the critical velocity $U_c^\infty$ is lower in the larger cavity, and that $U_c^\infty$ depends inversely on the cavity size $a^*$ (see Koizumi et al. (Reference Koizumi, Shirahashi and Sano2009), figure 5, which is reproduced in figure 15 of the present paper), although their argument developed there on the fitting function does not seem appropriate. Their experiment was performed for the void space between two parallel plates in an otherwise homogeneous granular material (refer to the original paper for the detail). After the two-dimensionality of the flow field was checked in many respects, their experimental results were well regarded as reflecting the collapse of a 2-D circular cavity. Meanwhile, the normal stress per unit length of a circular cylindrical cavity of radius $a^*$ is calculated by (Raja Sekhar & Sano Reference Raja Sekhar and Sano2000)
 \begin{align} {\tau^*}_{rr}^{2D}|_{r=a}=\frac{\mu U^\infty} {a^*} \left[-\frac{1}{2} c_1 a\right]^* \cos\theta=\frac{4\mu U^\infty} {a^*} \left(1-\frac{\sqrt{k}}{2 a^*}+\cdots\right) \cos\theta\quad{\rm for}\ \zeta_0 a \gg 1, \end{align}
since  $c_1= -8\zeta _0^2 K_1/[4\zeta _0 K_0+(\zeta _0^2+16)K_1]$, where $\zeta _0=a^*/\sqrt {k}$, and $K_0\equiv K_0(\zeta _0)$ and $K_1\equiv K_1(\zeta _0)$ are the modified Bessel functions of the first kind of order 0 and 1, respectively. Comparison of (4.1) and (4.5), where the dependence of $U_c^\infty$ on $a^*$ is qualitatively the same in 2-D and 3-D cavities, suggests that scenario 2 applies to the spherical cavity. Collapse of structures in a granular material have been extensively studied (see Duran Reference Duran1997; Liu & Nagel Reference Liu and Nagel1998; Majmudar & Behringer Reference Majmudar and Behringer2005; Behringer Reference Behringer2015; Morris Reference Morris2020), in which the solid frictional force, local arching between constituent grains and an ‘excluded volume effect’ owing to finite size of grains, among others, are decisive to maintain a quasi-equilibrium state of structure. Such a general feature of granular material also supports the involvement of at least a few grains in causing structural change. Taking the above evidence into account, we shall adopt scenario 2. Then, it follows that the 3-D larger cavities are prone to collapse as the velocity of the incident flow increases, which results in the dispersion of cavities of a similar size. Furthermore, the cavities positioned nearly along the flow direction are likely to collapse by interaction, which may create a long waterway by successive merging. These processes may be applied to the prediction of an extraordinarily fast spread of the contaminant through the soil, to the medical engineering for new blood vessel creation in an otherwise impermeable tissue (angiogenesis) and to the prediction of landslides, collapse of river banks and cliffs, etc. if many such water passages spread in a sheet-like manner.

Figure 15. Critical collapse velocity (reproduced from Koizumi et al. Reference Koizumi, Shirahashi and Sano2009).
4.2. Comparison of 3-D cavities with 2-D cavities for arbitrary configuration
We have calculated the interaction of two spherical cavities in general configurations, which, together with more accurate one focused on an axisymmetric configuration (JFM2022), enables us to compare the interaction of two spherical cavities (3-D case) and cylindrical cavities (2-D case) (Sano Reference Sano2020). Throughout our study on the interaction of macroscopic cavities in a granular material, we obtained several characteristics of their interaction. We found that the interaction in the 2-D case is rather long range, so that the volume flux into the downstream cavity is enhanced in a certain configuration (Kaneko & Sano Reference Kaneko and Sano2003; Sano & Nagata Reference Sano and Nagata2006a). For example, enhancement of the volume flux into a downstream cavity of the same radius amounts to approximately 20 % for the  $\alpha =15^{\circ}$ and $l=2.5$ case, whereas its reduction amounts to approximately20 % for the $\alpha =90^{\circ}$ and $l=2.5$ case (figure 5 of Sano Reference Sano2020). These variations are expected because some additional fluid volume that flows into the upstream cavity flows into the downstream cavity in the former case (which is observed for smaller $l$ and smaller $\alpha$, denoted here as the ‘enhancement region’), whereas the fluid volume that occupies the common influential region ahead of the cavities is shared between the two cavities in the latter case (which is observed for smaller $l$ and $\alpha \approx 90^{\circ}$, denoted here as the ‘reduction region’), which results in the reduction of volume flux into respective cavities. The variation, however, decreases gradually, like $l^\gamma$, where $\gamma \approx -1$. As a result, the collapse of the cavity can be initiated at the angular position $\theta _c$ on the cavity boundary that is different from the front end with respect to the incident flow direction, or at the position of the shortest minimum point between the two cavities. The latter is owing to a ‘global effect’ of interaction, and the granular material will be destroyed when the total stress exceeds a certain threshold value of the material stiffness (Kaneko & Sano Reference Kaneko and Sano2005; Sano & Nagata Reference Sano and Nagata2006a,Reference Sano and Nagatab; Sano Reference Sano2020). We call this type of collapse ‘branch-I’.
From the theoretical point of view, however, the collapse of a cavity can be initiated at the front end of the downstream cavity boundary, when the two cavities are arranged along the flow direction (Kaneko & Sano Reference Kaneko and Sano2005; Sano & Nagata Reference Sano and Nagata2006a,Reference Sano and Nagatab; Sano Reference Sano2020). The latter is expected because stronger stream that is focused by the upstream cavity exerts a larger stress directly on the downstream one. In particular, if the separation distance  $l$ is sufficiently small, they are effectively regarded as a single larger cavity, so that the flow field is totally enhanced to exceed the threshold value of destruction of the cavity boundary. This type of collapse occurs as a ‘local effect’ of the flow field on the limited part of the cavity boundary. We call the latter type of collapse ‘branch-II’.
Our 2-D experiments and numerical simulation (Kaneko & Sano Reference Kaneko and Sano2005; Sano & Nagata Reference Sano and Nagata2006a,Reference Sano and Nagatab) provide evidence depending on the configuration  $l$ and $\alpha$ (and $\zeta _0$) in the simplest case of two cavities of the same size. Namely, the collapse of 2-D cavities is initially observed at the front boundary of the downstream cavity if they are closely spaced with $\alpha =0$ (branch-II). On the other hand, angular position $\theta _c$ increases with $\alpha > 0$ (branch-I) provided that the two cavities lie in the enhancement region (Sano Reference Sano2020). Which branches are chosen may depend on experimentally uncontrollable factors of the material distribution and configuration of cavities that lead to asymmetry of the flow (see figure 16). In any case, collapse occurs almost independently and simultaneously if the cavities are sufficiently distant, because the difference in the upstream–downstream configuration of the cavities becomes less important.

Figure 16. Schematic picture of the collapse of two cavities.
To resolve these complexities, we need to consider another and practically important factor in the collapse of the granular boundary stemming from the structural stability against symmetric vs asymmetric disturbances. It is well known in the physics of granular materials (Duran Reference Duran1997) that, in a sealed hourglass or a hopper where granular fluid may normally flow down continuously, the flow of sand in cone- (or wedge-) shaped funnels can be blocked in the vicinity of the discharge orifice by the arch effect. The latter phenomenon depends on the size of the orifice with respect to the size of the grains, as well as the friction between them. In the 2-D case, the blockages may happen even for smooth granules in a smooth surface funnel, where normal force equilibrium is realised under the (effectively) symmetric disturbances. Such a jamming state is reported e.g. for a chain of as many as 10 grains at the boundary of granular material in a 2-D hopper of opening angle approximately  $30^{\circ}$ (Behringer Reference Behringer2015). Here, the number and configuration of grains involved in the equilibrium, and the extent of symmetry allowed to keep that state, are determined by the network of force chains among lots of relevant particles, and hence case by case, so that the flowing state may resume abruptly and unpredictably by infinitesimal disturbances.
Viewing the above-mentioned characteristics, we can expect branch-II to branch-I type bifurcation at the collapse of two 2-D cavities at a certain but non-zero  $\alpha$ (see 2-D case of figure 16). Note that the occurrence of the latter transition assumes the presence of maximum volume flux and/or the maximum velocity on the boundary (or at the centre of the cavity) at non-zero $\alpha$ positions. At this moment, the transition mentioned above contains speculation, which was partially justified by the asymptotic analysis and experiments on the interaction of two 2-D cavities (Sano Reference Sano2020), but further analysis for cavities that are close enough will be necessary.
In the 3-D case, on the other hand, a stable solid mechanical equilibrium state is not easily realised in wet granular material because quite a number of quasi-equilibrium states are possible. The latter implies that fluid mechanical stress plays a decisive role on the collapse of 3-D cavities, which requires analysis on both branch-I and branch-II possibilities, as are given in the present paper and JFM2022, respectively.
In our previous study (JFM2022), we obtained the interaction of two spherical cavities in a tandem position ( $\alpha =0$), which provides the basic information on branch-II, such as the dependence of enhanced velocity and stress on $l$, the range of influence of the effect of upstream cavity, etc. As shown in (6.5) of JFM2022, the velocity at the centre of the cavities behaves as
 \begin{equation} V_c^{2D} \sim \frac{3}{1-1/l^2} U^\infty,\quad V_c^{3D} \sim \frac{6}{1-2/l^3} U^\infty, \end{equation}
for 2-D and 3-D cases, respectively, for  $\zeta _0 \gg 1$. In addition to the difference of the magnitudes 3 and 6 respectively for 2-D and 3-D cases (which reflects the extent of flow concentration at the lowest approximation for 2-D and 3-D cases), the asymptotic behaviour of the 3-D case shows a faster decrease than that of the 2-D case. As for the volume flux into the downstream cavity in tandem arrangements, the increment amounts to as much as 20 % for $l=3$ (figure 10 of JFM2022), which is found to be much larger than the one achieved for any other configuration $\alpha \ne 0$ (as shown in the present paper). From the knowledge of the types of collapse observed in the 2-D case, transition to branch-I type needs the presence of such a maximum volume flux region of $(l, \alpha )$ that is clearly distinguished from the one immediately behind the cavity. However, the present study shows that the volume flux enhancement region is the same as the one obtained in the tandem arrangement configuration (figures 12 and 13). The latter is considered to be a result of strong localisation of flow by the upstream cavity, as well as shorter range of interaction in 3-D cavities, which implies that the only branch-II type collapse is expected in 3-Dcavities.
Throughout our study, we obtain a hypothesis that the interaction of 3-D cavities is highly localised and the region of influence is limited along a narrower region in the longitudinal direction, whereas that of 2-D cavities is rather global and the region of influence spreads more broadly in the transverse direction. Therefore, two circular cavities (2-D case) of the same size within a short distance in a tandem position will collapse as branch-II type, whereas they will collapse as branch-I type if the orientation of the two cavities is angled within the enhancement region. On the other hand, two spherical cavities (3-D case) of the same size in an enhanced region will collapse only as branch-II type. In other positions, they will collapse almost independently as is observed for a single spherical cavity.
At present, the above consideration is limited to two equal cavities of the same size, which should be substantiated by future investigation, including the extension to unequal cavities, and analyses of the flow field around closely spaced cavities. Further study will also be necessary to validate these speculations from both approaches by fluid mechanics and granular material physics.
5. Conclusions
We have calculated the interaction of two macroscopic spherical cavities of radii  $a$ and $b$ whose separation distance between their centres is $l$ and orientation angle is $\alpha$ with respect to an otherwise uniform velocity at infinity. Here, we confine $\alpha$ to a range between $0$ and $90^{\circ}$ taking account of the symmetry between the two cavities. The influence of the flow field created by one cavity on the other cavity is taken into account asymptotically. The main results we obtained are the following.
(i) A uniform flow at infinity
$U^\infty$ passing through the macroscopic cavities in an otherwise homogeneous granular material locally focuses to respective cavities, so that the velocity inside the cavities varies remarkably, whose magnitude depends on the ratio $\zeta _0 \equiv R_0 / \sqrt {k}$, where $R_0$ is the typical size of the cavity and $k$ is the permeability. It has been shown that the velocity at the centre of a single spherical cavity $v^C_S$ amounts to as large as $6 U^\infty$ for $\zeta _0 \gg 1$. In the presence of two cavities of equal size, we found that the flow inside the cavity is further enhanced if the angle $\alpha$ is less than a critical angle $\alpha _c (l)$, where $\alpha _c = \cos ^{-1}(1/\sqrt {3})= 54.7356 \cdots$ for $l \gg a$. The latter reflects the dipole characteristics of the flow field around respective cavities. The amount of increment depends, besides $\zeta _0$, on $\alpha$ and the distance $l$ between the two cavities. Generally speaking, the velocity at the centre of the cavity $v^{C}_{a}$ (or $v^{C}_{b}$) is largest at $\alpha =0^{\circ}$, and it amounts to e.g. $6.48 U^\infty$ for $l=3a$ and $\zeta _0 \gg 1$, whereas it approaches $6 U^\infty$ as $l$ increases (in agreement with our previous calculation by Sano et al. Reference Sano, Karmakar and Sekhar2022). On the other hand, if $\alpha$ is larger than $\alpha _c$, the velocity at the centre of each cavity $v^{C}_{a}$ (or $v^{C}_{b})$ decreases owing to the interfering interaction, such that the upstream-side fluid volume around them, that would otherwise flow into respective cavities, overlaps. Accordingly a reduced amount of fluid flows into the respective cavities. The latter effect is larger for smaller $l$ with $\alpha \approx 90^{\circ}$, and decreases with $l$. When the sizes of the two cavities are not equal, the above-mentioned tendency is much enhanced in the smaller cavity, whereas the influence is less remarkable in the larger cavity. For example, the velocity at the centre of the smaller cavity $v^{C}_{a}$ becomes larger than $6.5 U^\infty$, whereas that of the larger cavity $v^{C}_{b}$ remains at approximately $6 U^\infty$ for $b/a=2, l=5$ and $\alpha =0^{\circ}$. At the same time, the flow direction at the centre of the smaller cavity $\theta ^{C}_{a}$ changes more than 5 degrees for $b/a=2, l=5, \alpha \approx 50^{\circ}$, whereas that of the larger cavity $\theta ^{C}_{b}$ remains almost unchanged. These results imply the stronger involvement of the smaller cavity in the larger one.(ii) The volume fluxes into respective cavities
$Q_a$ and $Q_b$ were calculated based on our asymptotic model. In particular, the configuration dependence is elucidated for two cavities of equal size. The $l - \alpha$ contour map for the flux into upstream cavity $Q_a$ and that for the downstream cavity $Q_b$ are qualitatively the same as those of the velocity contour maps. Thus, the fluxes increase as $l$ reduces for $\alpha < \alpha _c$, whereas they decrease as $l$ reduces for $\alpha > \alpha _c$. They attain more than $10\,\%$ increase of $Q_S$ for $\alpha =0^{\circ}$ as $l$ approaches 2.5, where $Q_S$ is the volume flux into a single spherical cavity of the same radius $a$. (Note that $Q_S= 3({\rm \pi} a^2 U^\infty )$, which is the volume flux that a uniform flow $U^\infty$ passes through the single cavity for $\zeta _0 \gg 1$.) Meanwhile, a more than $5\,\%$ decrease of $Q_S$ is expected for $\alpha =90^{\circ}$ as $l$ approaches 2.5. In either case, the volume flux tends to $Q_S$ with the increase of $l$. A closer look at $Q_a$ and $Q_b$, however, reveals that they are not symmetric with the exchange of positions of the upstream and downstream cavities, in spite of the symmetry of the flow fields. The former asymmetry occurs at a certain configuration, in which the stream tube that flows into the downstream cavity is dilated, or constricted, toward the other cavity. The corresponding change is not recognisable in the upstream cavity, because of the negligibly small influence of the downstream cavity on the incoming flow into the upstream cavity.(iii) We calculated the velocity and stress fields both inside and outside of the spherical cavities based on our asymptotic model. With regard to the collapse of the cavity, the negative normal stress distribution on the cavity boundary
$-\tau _{rr}$ is important. We found that the latter is proportional to the velocity at the centre of that cavity $v^C$, as well as the normal component at the boundary of respective cavities $v_r^B$, as far as the present approximation is concerned. This means that the configuration dependence of the $\tau _{rr}^B$ distribution is qualitatively the same as that of $v^C$ or $v_r^B$. Thus, in the case of two cavities of equal size, configuration dependence is such that the magnitude of the stress is larger when they are closer to each other and positioned along the flow, whereas it is smaller when they are closer to each other and arranged spanwise. The latter tendency changes at a critical angle $\alpha _c$, but becomes indistinguishable as $l$ increases. However, the dependence of its magnitude on the size of the cavities is different. The latter can easily be understood by looking at the asymptotic behaviours
(5.1)where\begin{align} & (\tau^B_a, v^{C}_{a}, (v_r)^B_a) \nonumber\\ &\quad = \left[\frac{18}{a}\left(1-\frac{5}{\zeta_0 a}+\cdots\right), 6 \left(1-\frac{5}{2\zeta_0 a}+\cdots \right),\ 1-\frac{30}{(\zeta_0 a)^2}+\cdots\right] F(b,l,\alpha), \end{align}$F(b,l,\alpha ) =1+(b/l)^3\ (3 \cos ^2 \alpha -1) +\cdots$ for $\zeta _0 a \gg 1$. The configuration dependence of stress on cavity ${{\rm C}b}$ is similarly obtained by exchanging the roles of ${{\rm C}a}$ and ${{\rm C}b}$. Under fixed value of the cavity size and configuration, the magnitude of $\tau ^B_a$ is inversely proportional to the size of the cavity $a$, in contrast to the $O(a^0)$ dependence of the peak values in $v^{C}_{a}$ and $(v_r)^B_a$. In the presence of two cavities of radii $a$ and $b$ with separation distance $l$, the magnitude of the stress on cavity ${{\rm C}a}$ (radius $a$) depends primarily on the cavity size $a$, followed by the effect of the other cavity at the order of $O((b/l)^3)$ with amplitude proportional to the orientation $3 \cos ^2 \alpha -1$.(iv) As mentioned before (Kaneko & Sano Reference Kaneko and Sano2005; Sano & Nagata Reference Sano and Nagata2006a; Koizumi et al. Reference Koizumi, Shirahashi and Sano2009; Sano Reference Sano2020; Sano et al. Reference Sano, Karmakar and Sekhar2022), cavities will be destroyed if the fluid mechanical force
$F_f$ exceeds the force $F_g$ that keeps the structure at the boundary of the granular material. Although the detailed mechanisms of transition and flows of granular materials and/or dense suspensions are much complicated and material dependent, $F_g$ may be regarded as a certain constant once that material is given. Based on these assumptions, we seek the critical velocity above which cavities are destroyed. To do so, we calculate the force $F_f$ exerted on a small but finite area of the front boundary of the cavity by the viscous flow (in the $x$ direction), which is given by the integral of the stress $\tau _{xr}|_{r=a}$ over the area of a few grain sizes. According to our present analysis, the condition $F_f \ge F_g$ leads to the critical velocity $U_c^\infty$, which is inversely proportional to the cavity size. Then, we can expect the collapse of larger cavities for a slower stream, which breaks the cavities to a similar size, and nearby cavities along the stream collapse and merge to create a long water channel. This mechanism may be applied to civil engineering such as the prediction of landslides and the collapse of river banks, and also to medical engineering such as new blood vessel creation in an otherwise impermeable tissue (angiogenesis), etc., for which further research work is awaited.


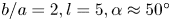


Appendix A. Note on the effective viscosity in the granular region
When we consider the flow of viscous fluid of viscosity  $\mu$ through a granular region of permeability $k$, the generalised Darcy equation is given by, corresponding to (2.1b),
 \begin{equation} \frac{\mu}{k} {\boldsymbol v}^*={-}\boldsymbol{\nabla}^* p^*+\mu_e \varDelta^* {\boldsymbol v}^*, \end{equation}
where  $\mu _e$ is the effective viscosity in the granular region. If non-dimensionalised by (2.2a–c), i.e.
 \begin{equation} {\boldsymbol x}=\frac{{\boldsymbol x}^*}{R_0},\quad {\boldsymbol v}=\frac{{\boldsymbol v}^*}{U^\infty},\quad p=\frac{{p^*}}{\mu U^\infty /R_0}, \end{equation}
(A1) becomes
 \begin{equation} (\varDelta -{\zeta_e^2}){\boldsymbol v}=\boldsymbol{\nabla} {\tilde p}, \end{equation}
where
 \begin{equation} {\zeta_e}=\sqrt{{\frac{\mu}{\mu_e}}}\zeta_0,\quad \left(\zeta_0=\frac{R_0}{\sqrt{k}}\right),\quad {\tilde p}={\frac{\mu}{\mu_e}}p. \end{equation}
Here,  ${\mu _e}/{\mu }$ is always larger than 1 in a suspension containing solid particles as has been dealt with in this paper. This implies that effective value $\zeta _e$ is reduced by a factor of $\sqrt {\mu / \mu _e}\ (\le 1)$. Pressure $p$ is also reduced by a factor of $\mu / \mu _e$ in the granular region. General solutions of (A3) with continuity equation $\boldsymbol {\nabla }\boldsymbol {\cdot } {\boldsymbol v}=0$ are of the same form as (2.4a,b), (2.5a,b) and (2.6a,b). Inside the cavity, the flow is governed by the Stokes equation
 \begin{equation} \Delta {\boldsymbol v} =\boldsymbol{\nabla} p, \end{equation}
in non-dimensional form, (which is the same as (2.3c). General solutions of (A5) with continuity equation  $\boldsymbol {\nabla }\boldsymbol {\cdot } {\boldsymbol v}=0$ are of the same form as (2.9).
Based on these equations, we shall consider the flow through a single spherical cavity. In terms of the spherical coordinate system, solutions in the granular region are given by (2.13a,b), (2.14), (2.15), (2.16a,b) with  $\zeta _0$ replaced by $\zeta _e$, while $p$ and $\tau _{ij}$ are multiplied by a factor of $\mu / \mu _e$. For example, pressure, (2.13), becomes
 \begin{equation} {\tilde p}=\frac{\mu}{\mu_e} p=\frac{\mu}{\mu_e} \zeta_0^2 \left({-}r +\frac{D(a)}{r^2}\right) \cos\theta ={\zeta_e^2} \left({-}r +\frac{D(a)}{r^2}\right) \cos\theta. \end{equation}
The above modifications apply to the coefficient  $C(a)$ and $D(a)$, as well as $\varDelta _0(a), \varDelta _1(a), \varDelta _2(a)$.
On the other hand, the flow inside the cavity is given by (2.17a,b), (2.18), (2.19) and (2.20a,b). Matching of boundary conditions is also satisfied by replacing  $\zeta _0$ with $\zeta _e$ in $A(a)$ and $B(a)$. In the latter, however, $p$ and $\tau _{ij}$ are not multiplied by a factor of $\mu _e / \mu$.
As a consequence, streamlines are the same irrespective of  $\mu / \mu _e$, except for replacing $\zeta _0$ by $\zeta _e$. (This implies that the flow field for any $\zeta _e$ is given by the one with $\sqrt {\mu / \mu _e}$ times the $\zeta _0$ in this paper.) The difference appears when we discuss the dynamical effect, such as the criteria of the collapse of cavities.
Appendix B. Renormalisation of $U^\infty$

Throughout our analysis, we consider the effect of macroscopic cavities in an otherwise uniform velocity  $U^\infty$ at infinity. In the latter, a steady flow is maintained under a given constant pressure gradient, which will be balanced by the solid friction between the contacting grains as well as the fluid mechanical resistance force due to the constituent particles. However, if we create cavities in an otherwise homogeneous material, the above-mentioned force balance changes, so that the velocity may increase under the same constant pressure gradient. Then, we need to consider the renormalisation of the velocity and/or pressure at infinity. To see this, let us consider the flow in an otherwise homogeneous granular material of length $L_{0}$ along the flow direction and cross-section $S_0$ (figure 17a), where a uniform flow $U^\infty$ is maintained by a higher pressure $\Delta p$ at the upstream end. Here, we omit the effect of the solid friction force between the contacting grains for simplicity, and consider the resistance force $f_0=\mu K U^\infty$ from each of the constituent grains, where $\mu$ is the viscosity of the fluid and $K$ is the component of the resistance tensor along the flow direction.

Figure 17. Effect of cavity region in a homogeneous granular material.
As far as the fluid mechanical resistance force is concerned, the force balance is given as
 \begin{equation} \Delta p S_0 ={-} (V_0 n) f_0 ={-}(L_0 S_0 n) \mu K U^\infty, \end{equation}
where  $n$ is the number density of the particles. From (B1), we have
 \begin{equation} U^\infty ={-} \frac{\Delta p}{(L_0 n ) \mu K}={-} \frac{k}{\mu} \frac{\Delta p}{L_0}, \end{equation}
where  $k=1/(Kn)$ is regarded as the permeability of the material. Equation (B2) is the well-known Darcy's law. We now consider a void space (macroscopic cavity) of volume $V^*$ (figure 17b), so that the pressure difference and the velocity at infinity change to $\Delta p'$ and $U'$, respectively. Then, the force balance will be
 \begin{equation} \Delta p' S_0 ={-} (L_0 S_0 - V^*) n \mu K U'. \end{equation}
 \begin{equation} \frac{\Delta p'}{\Delta p}=\left(1-\frac{V^*}{V}\right) \frac{U'}{U^\infty},\quad (V=L_0 S_0). \end{equation}
In many experiments, the pressure difference is the controllable global quantity, because the hydrostatic pressure difference between the inlet and outlet of the water channel with granular bed is easier to set up. In the latter, the pressure difference is kept constant irrespective of the presence of the cavity regions, so that we have a modified velocity at infinity
 \begin{equation} U'=U^\infty/\left(1-\frac{V^*}{V}\right). \end{equation}
As mentioned before, we assume that the undisturbed velocity far upstream  $U^\infty$ is a specified quantity in our theoretical model. This implies that we should renormalise the velocity at infinity by multiplying a factor $1-V^*/V$, or by subtracting excessive amount of velocity $V^*/V$, to adjust the flow to $U^\infty (=1)$. An accurate estimation of $V^*/V$, however, needs detailed examination taking into account the structure of the granular material, which requires further research. Instead, the velocity renormalisation shown in the text, where excessive amount of velocity is subtracted to achieve $U^\infty (=1)$, will suffice for present purposes.
Appendix C. Comparison of numerical simulation with asymptotic analysis
In order to check the accuracy of our asymptotic analysis by an independent study, we shall compare the flow field of our present work with our previous numerical simulation (Sano & Nagata Reference Sano and Nagata2006a; Sano Reference Sano2008). Because of the length limitation of the paper, only the volume flux diagram similar to figure 13(a) of the present paper was shown in the latter (Sano Reference Sano2008), where numerical simulation on the flow field and pathlines in many configurations, as well as their application to angiogenesis, were presented. The method of numerical calculation was fully given in our previous paper (Sano & Nagata Reference Sano and Nagata2006a), where the 2-D case was exemplified. As shown below, the method is applicable to both 2-D and 3-D configurations with arbitrary shapes of cavities, although it is time consuming and applies to individual situations. We considered the flow of a viscous fluid of viscosity  $\mu$ and density $\rho$ in the test section, where $N$ particles of the same size are placed randomly and densely (with average porosity about 0.4) except for the macroscopic cavity regions.
As the governing equations of the fluid, we employed the two-fluid model derived by Anderson & Jackson (Reference Anderson and Jackson1967), and calculated the locally averaged porosity  $\varepsilon$, velocity $\boldsymbol u$ and pressure $p$ in the Eulerian description
 $$\begin{gather} \frac{\partial \varepsilon}{\partial t}+ \boldsymbol{\nabla} \boldsymbol{\cdot} (\varepsilon {\boldsymbol u})=0, \end{gather}$$
 $$\begin{gather}\rho \left(\frac{\partial (\varepsilon {\boldsymbol u})}{\partial t} +\boldsymbol{\nabla} \boldsymbol{\cdot} (\varepsilon {\boldsymbol {u u}}) \right) ={-}\varepsilon \boldsymbol{\nabla} p+\mu \Delta {\boldsymbol u}-{\boldsymbol F}_d. \end{gather}$$
Typical mesh size was  $150\times 100\times 60$ in the 3-D case. We took account of the collapse of the cavity region, so that the velocity of each particle ${\boldsymbol v}_p$ was determined in the Lagrangian description
 \begin{equation} (m+m_0)\frac{{\rm d}{\boldsymbol v}_p}{{\rm d} t}={\boldsymbol F}_d+{\boldsymbol F}_l+{\boldsymbol F}_f, \end{equation}
where  $m$ is the mass of the particle, and $m_0$ is the virtual mass. From the order estimation in typical situations, the Basset term was found to be negligible. The force ${\boldsymbol F}_l$ is approximated from the lubrication theory between neighbouring particles, and ${\boldsymbol F}_f$ is the frictional force between the particles in contact (assuming a friction constant adjusted to the experimental one). Meanwhile, we adopted the drag force ${\boldsymbol F}_d$ proposed by Ergun (Reference Ergun1952)
 \begin{equation} {\boldsymbol F}_d={-}[150\mu(1-\varepsilon)+1.75 \rho d |{\boldsymbol u}-{\boldsymbol v}_p| \times \frac{1-\varepsilon}{\varepsilon^3 d^2} ({\boldsymbol u}-{\boldsymbol v}_p), \end{equation}
where  $d$ is the particle diameter. The number of particles was $N = 80\,000 \sim 100\,000$. The flow field was calculated by repeating the following procedures: (i) determine the porosity from the locations of particles, (ii) estimate the force on the fluid by taking account of the porosity and the velocity, (iii) compute the flow field and then (iv) calculate the movement of each particle using (C3), which is allowed for $|{\boldsymbol F}_d|$ larger than $|{\boldsymbol F}_f|$.
Figure 18 (white lines on blue background) is one of the examples of the streamlines around two spherical cavities with orientation  $\alpha = 60^{\circ}$ ( $a=1, l=3, \varepsilon =0.39$), which was presented at ICTAM22 (Sano Reference Sano2008). Here, positions of the particles are fixed, and the locally averaged flow field in the plane passing the centre of the two cavities is shown. The superposed blue lines on the white background are the ones calculated by the present asymptotic analysis for the same configuration with $\zeta _0=100$. In the former, the average porosity was $\varepsilon =0.39$, which implies $k=10^{-6}\sim 10^{-3}\ (\textrm {cm}^2)$ in a gravel. In the simulation, we chose $d=1\,\textrm {mm}$, and $a=30d=3\,\textrm {cm}$, so that $a/\sqrt {k}=100\sim 3000$, which is comparable to our calculation with $\zeta _0=100$. Note that the $\zeta _0$ effect saturates to the $\zeta _0=\infty$ case for $\zeta _0$ above approximately 100, as shown in our previous papers. Considering that the granular material was prepared by the random pouring of particles, the flow field will have some fluctuation. In spite of this, the flow field obtained by numerical simulation seems to agree satisfactorily with the one by our asymptotic theory.

Figure 18. Comparison of numerical simulation with asymptotic analysis: streamlines around two spherical cavities of equal size  $a = 1$ in the plane passing their centres ( $l= 3, \alpha = 60^{\circ}$). White lines on blue background denote numerical simulation and blue lines on white background denote asymptotic analysis.
Funding
This research received no specific grant from any funding agency, commercial or not-for-profit sectors.
Declaration of interests
The authors report no conflict of interest.
Author contributions
O.S. analysed the preliminary part of this problem and contributed to numerical results, analysis and the drafting of the manuscript. T.K. performed numerical results, analysis and contributed in drafting the manuscript. G.P.R.S. contributed to mathematical analysis, verifying the numerical results and completing the manuscript. All authors read and approved the manuscript.


