Introduction
If all the grounded ice of the West Antarctic ice sheet were to melt, sea level would rise by approximately 5 m (Reference ThomasThomas and others, 1979), severely affecting the densely populated coastal regions of the world. The ice sheet is primarily grounded below sea level, making it vulnerable to unstable grounding-line retreat (Thomas and others, 1979). Yet its mass balance (the net gain or loss of ice) remains poorly understood, in part because ice velocity is accurately measured for only a few areas. Velocities for the West Antarctic ice sheet are well known for some of the ice streams draining into the Ross and Ronne Ice Shelves; little is known about velocities of ice draining through the Marie Byrd Land coast into the Amundsen Sea. in this paper, we discuss our recent work mapping ice velocities forThwaitcs Glacier and several lesser outlet glaciers farther west along the Marie Byrd Land coast (Fig. 1). Velocities above the grounding line were obtained only forThwaites Glacier. All other velocities along the Marie Byrd Land coast were made on the ice shelves or tongues.
Method
Crevasses in the floating part of glaciers or ice shelves may remain visible for many years. Using sequential satellite images, average velocities (for the time interval between image acquisitions) can be calculated from the displacements of such features. Landsat and European Remote-sensing Satellite synthetic aperture radar (ERS-1 SAR) images were used in this study. The Landsat images cover mainly the central to western Marie Byrd Land coast; the ERS-1 images are restricted mainly to Thwaites Glacier. Older (1970s) Landsat multispectral scanner (MSS) images have a resolution of about 80 m per pixel; more recent Thematic Mapper (TM) images have a resolution of about 30 m per pixel and more stable internal geometry than MSS images. ERS-1 images have 25 m resolution (12.5 m per pixel, because of the artificial resampling of pixels) and enable identification of small crevasses above or at the grounding

Fig. 1. Map of Marie Byrd Land showing physiographic features mentioned in text. Arrows point to locations of velocity measurements.
Table 1. ERS-1 and Landsat images used for measurements
line. The inclusion of low-resolution MSS images, the only images available for the earlier time period, restricts measurements west of Thwaites Glacier to ice tongues or shelves where crevasses are large.
The European Space Agency (ESA) supplied ERS-1 images in geocoded format (images placed in Universal Polar Stereographic map projection using the World Geodetic System 1984 ellipsoid). The German facility of the Deutsche Forschungsanstalt für Luft und Raum (DLR) corrected the ERS-1 images, using a reference mean elevation assigned to each frame. The DLR used similar reference elevations for repeat images that have similar orbit and frame locations (Table 1). Thus, major range-displacement errors were eliminated. (Range displacements within frames are approximately 2.3 times the elevation difference between the actual elevation of a point and the reference elevation; Reference Roth, Hugel, Kosman, Matschke and SchreierRoth and others, 1993). For co-registered frames with the same reference elevations and coincidental orbits and frames, the range displacements are the same. in addition, layover problems on ice streams and ice shelves are minor because slopes are low; thus the elevation difference between displaced measured points located near each other is minimal. Compressing the images to 25 m per pixel by averaging squares of four pixels reduced speckle. Several of the images were processed to remove noisy data by using adaptive box filters described in Reference Eliason and McEwenEliason and McEwen (1990).
Image pairs of the same geographic area were co-rcgis-tered by selecting a minimum of three well-dispersed fixed points located on both images (Landsat), or by using the supplied latitude and longitude coordinates (ERS-1). This latter method is limited to ERS-1 images because of their excellent internal geometry and location accuracy to within 50 m or better (Roth and others, 1993). Measuring the offset of features involved cither placing the image pairs into different color channels and matching crevasses (Landsat images) or applying an automated cross-correlation method (a pattern recognition program that calculates displacements of features) developed by Reference Bindschadler and ScambosBindschadler and Scambos (1991) and Reference Scambos, Dutkiewicz, Wilson and BindschadlerScambos and others (1992) to the radar images. For cither method, vectors of the offset distances were superimposed on an image of the glacier, to obta in the distribu-tion of velocities over the length of the glacier, the distance from the midpoint of each vector to the approximate position of the grounding line was measured and portrayed on graphs (see Fig. 6). Dividing wide glaciers into separate parallel paths served to record velocity variations in a cross-flow direction and facilitated the velocity analysis among the several image pairs.
Previous investigations (Lucchitta and others, 1993) have shown that errors in average velocity using Landsat images may be as little as 0.02 km a−1 if (1) the time interval is longer than 10 years, (2) the average velocity is higher than 0.5 km a−1, (3) co-registration points are well dispersed and surround the ice flows to be measured, and (4) the image pair includes a Landsat 4 or 5 image. Even though conditions 1, 3 and 4 apply in most of the current measurements, the slow velocities of shelf ice reduce the accuracy. An investigation into residual errors on co-registered Landsat images of the Dotson Ice Shelf (Lucchitta and others, 1994) yielded errors in location of fixed points of no more than 15 m, but the lack of geodetic ground control makes it difficult to evaluate errors caused by incorrect scales of the images. An investigation into errors in scale between aTM image and a map of part of Victoria Land, where geodetic control is good, yielded errors of less than 1 % between map and image distances (Lucchitta and others, 1993). For ERS-1 images, the errors are better defined. Previous investigations (Lucchitta and others, 1995) showed that images co-registered using nunataks are essentially without residual errors when other fixed points are compared, whereas images co-registered by the furnished coordinates have a maximum ground location error of 50 m (Roth and others, 1993). A hypothetical 50 m error in nominal location of two images would result in a +5% error in measured displacement of a tracked point that moved a distance of 1 km.
Results
Thwaites Glacier
Thwaites Glacier (Fig. 1) is the fastest-moving ice stream in West Antarctica. It drains a 121000km2 area (Mclntyre, 1984), about 7% of the West Antarctic ice sheet, with an overall surface slope of about 0.004 above the grounding line (Drewry, 1983). The subglaciol floor of the drainage area reaches the Byrd Subglaciol Basin, more than 2000 m below sea level (Drewry, 1983). Thwaites Glacier has been previously investigated, beginning in the early 1980s, based on analysis of satellite images (Reference HughesHughes, 1981; Reference Williams, Ferrigno, Kent and SchoonmakerWilliams and others, 1982; Reference Lindstrom and HughesLindstrom and Hughes, 1984; Lindstrom and Tyler, 1984). Fluctuations of the front of Thwaites Glacier ice tongue have been noted by Ferrigno and Gould (1987), Reference Williams, Ferrigno, Swithinbank, Lucchitta and SeekinsWilliams and others (1995), Reference Swithinbank, Williams, Ferrigno, Seekins, Lucchitta and RosauovaSwithinbank and others (1997) and Ferrigno and others (1998).

Fig. 2. Portion of Thwaites Glacier, showing grounded part on lower tight, floating tongue on upper left. Black lines trending north-south separate paths (P1, P2, etc.); black line trending east-west indicates approximate position of grounding line. Small white lines are displacement vectors for time interval 8 September 1993-19 March 1994. ERS-1 image 11234-5211,8September 1993.
Thwaites Glacier lacks a buttressing ice shell, but some buttressing may have been provided by Thwaites Iceberg tongue, which had cak ed fromThwailes Glacier ice tongue by 1967. It remained in front of the glacier until 1986, probably pinned on shoals. This huge tabular iceberg (150 km long by 35-65 km wide) had moved out of Pine Island Bay by 1990.
ERS-1 images for this area were co-registered by using the coordinates provided, since only one outcrop was exposed on the images. When matching the images by this outcrop and the rolling topography of the grounded ice sheet, residual errors were within 2 pixels of the compressed image, or the equivalent of 50 m on the ground. However, the pixel offset is small relative to the measured icc-fcaturc displacements, and therefore the velocity error is small.
Velocities on both the grounded and floating sections of Thwaites Glacier were measured. Figure 2 shows displacement vectors for the grounded part and a small section of the floating tongue, for the time interval September 1993 March 199 1 images 3 and 5 in Table 1). (The grounding line was placed where the rolling topography of the ice sheet gives way to the crevassed ice of the tongue.) Velocities for this time interval for both the grounded section and the adjacent major portion of the glacier tongue [images 2 and 4 in Table 1) are shown in Figure 3.The figure demonstrates an apparent rapid increase in velocity of approximately

Fig. 3. Thwaites Glacier. Average velocity per paths vs dii -lance from grounding line. Negative values in grounded part of glacier, positive values in floating part. Compilation of velocities for all measurements of 1993-94 time interval (images 2-5 in Table 1). Note rapid increase in velocity across grounding line.
1 km a−1 as the central part of the glacier moves across the grounding line into the glacier tongue. Similar accelerations across the grounding line were observed on Pine Island Glacier (Lucchitta and Rosanova, in press). in addition, measurements were made, for Thwaites Glacier ice tongue only, for the earlier time interval March 1992-September 1993 (images 1 and 3 in Table 1); they give similar velocities to those for the 1993-94 time interval, showing that recent velocities have not changed.
Average v elocities for the fastest-moving, central parts of the glacier (path 2 in figs 2 and 3) range from about

2.2 km a−1 just above the grounding line to 3.4 km a− at the limit of the measurements in these images. The eastern and western parts of the main glacier (paths 1 and 3 in figs 2 and 3) moved at a slower rate of about 1.5 km a−1 above the grounding line, but accelerated to the same velocity in the glacier tongue. West of the main glacier (paths 4 and 5 in figs 2 and 3) the ice moved at an even slower 0.2-0.6 km a above the grounding line, accelerating gradually to about 3 km a−1 in the glacier tongue.
Previous velocity measurements were made on the glacier tongue only (the section that remained after the 1967 calving event). in 1977, R. J. Allen (in Ferrigno and others, 1993) estimated an average velocity of 2.0-2.9 km a−1 based on aerial photographs and Landsat images. Lindstrom and Tyler (1984) measured an average velocity of 3.6 km a−1 from 1972 to 1983 on Landsat images co-registered by icebergs trapped in fast ice, a method that makes their numbers questionable. Ferrigno and others (1993) measured an average velocity of 2.6 km a−1 on Landsat images from 1972 to 1984, and 2-7-2.8 km a−1 on Landsat images from 1984 to 1990. They noted an apparent inrrea.se in the velocities, which is confirmed by the results of this
Fig. 5. Dotson Ice Shelf. Comparison of average velocities from Landsat (Lucchitta and others, 1994) and ERS-1 images. Mite that velocities are similar.

Fig. 6. Eastern Getz Ice Shelf. Small white lines are displacement vectors for time interval 23 November 1973-25 December 1986. Getz (Wright Island) located to east of Wright Island, Getz (Carney) located to east of Carney Island. Mosaic of Landsat images MSS 1488-15160 and 1488-15163,23 November 1973.
study. The average velocity of Thwaites Glacier ice tongue of more than 3 km a−1, derived from ERS-1 SAR images, is an increase of more than 0.4 km a from velocities presented previously (Fig. 4).
Fig. 7. Eastern and western Getz Ice Shelf. Average velocity vs distance from grounding line.

Fig. 8. Western Geiz Ice Shelf. Small while lines are displacement vectors for time interval 11 January 1973-25 February 1988. Getz (Siple) located to west of Siple Island; Getz (Dean) located some distance west of Dean Island, next to DeVicq Glacier. Mosaic of Landsat images MSS 1172-16035 and 1172-16042, 11 January 1973.
Dotson Ice Shelf
The Dotson Ice Shelf (Lucchitta and others, 1994, figs 1 and 3) is partly fed from ice diverted from Smith Glacier. Average velocities of 0.3-0.5 km a−1 based on Landsat images from 1973 to 1988 correspond to those derived from ERS-1 images from 1992 to 1994 (Fig. 5; images 6 and 7 in'lable 1). There is no apparent increase in velocities derived from ERS-1 images compared to those from Landsat images.
Getz Ice Shelf
The Getz Ice Shelf occupies a fiOO km long stretch of coastline along Marie Byrd Land (Fig. 1). It drains an approximately 200 km wide swath of ice from points east of the Executive Committee Range to Mount Kauflman and the Flood Range. The ice shelf is anchored by islands, peninsulas and ice rises. Average velocities of five sections of the ice

Fig. 9. Land Glacier. Heavy white lines trending north—south outline paths (P1, P2. P3); heavy while line trending east-west indicates approximate position of grounding line. Thin white lines are displacement vectors for time interval 5 December 1975-19 December 1988. Landsat MSS image 2317-16195.
shelf were measured on Landsat MSS and I'M images covering 13 and 15 year intervals ranging between 1973 and 1988 (figs 6 and 7; images 10-13 in Table 1; figs 7 and 8; images 8, 9, 14 and 15 in Table 1). The velocities range from 0.2 to 0.8 km a−1.
The ice shelf west of Siple Island (Fig. 8) is the outlet for much of the ice trapped in an ice shelf behind Carney Island. DeVicq Glacier, also west of Siple Island, traverses the Getz Ice Shelf (Fig. 8). Velocities of the western ice shelf, including DeVicq Glacier, range from 0.7 to 1.1 km a . Landsat images of DeVicq Glacier also show vague morphologic outlines of an old subglaciol trough extending inland by as much as 80 km; the trough may have served to locate the present ice stream.
Land Glacier
Land Glacier (Fig. 1) drains an area extending approximately 100 km inland and lacks a buttressing ice shelf. Flowlines visible on Landsat images indicate that additional ice comes from the region behind the Flood Range (Fig. 1), significantly increasing the catchment area of the glacier. The glacier drains a subglaciol trough between the Ford and Flood Ranges, having door elevations less than 500 m a.s.l. (Drewry, 1983). A 20km long subglaciol trough, marked by a steep drop in the ice that is reflected in surface contours, may exist at the mouth of the glacier. Average velocities of Land Glacier were derived from an MSS image of 1975 and aTM image of 1988 (images 16 and 17 in Table 1). Its tongue, where measured, flows rapidly at 1.7-1.9 km a−1 (figs 9 and 10).
Fig. 10. Land Glacier. Average velocity va distance from grounding line.
Sulzberger Ice Shelf
The Sulzberger lee Shelf is separated into several segments by islands (Fig. 11). Measurements were performed on Landsat MSS (1972 and 1976; images 18-20 in Table 1) andTM images (1986; image 21 in Table 1). Segment Sulzberger A, not shown (images 19 and 21 in Table 1), flows slowly at well below 0.1 km a−1 (Fig. 12), apparently inhibited by numerous ice rises which locally ground the ice shelf. Average
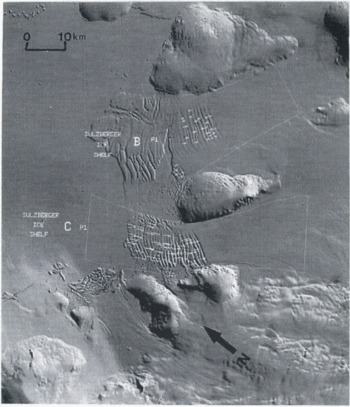
Fig. 11. Sulzberger Ice Shelf] segments Β and C. Small white lines are displacement vectors for time interval 28 December 1972-11 December 1986. Landsat MSS image 1158-16284, 28 December 1972.
Fig. 12. Sulzberger Ice Shelf. Average velocity vs distance from grounding line. Note that two time intervals are plotted for segments Β and C.
velocities for segment Sulzberger Β (Fig. 11; images 23, 25 and 26 in Table 1) are close to 0.1 km a−1 for both time intervals measured (Fig. 12). Average velocities for segment Sulzberger C, also shown in Figure 11, are near 0.2 km a−1 (Fig. 12), again for both time intervals. The small differences in velocities between time intervals within segments are with in the error limits of Landsat MSS images. Segment Sulzberger C is the least restricted by islands and shows the highest velocities of the ice shelf.
Discussion and Conclusions
Thwaites Glacier is faster than most Antarctic ice streams, which, with the exception of Shirase Glacier (Swithinbank, 1988) and Pine Island Glacier (Lucchitta and others, 1995), generally have velocities less than 1.5 km a−1. A velocity increase on Thwaites Glacier ice tongue of 0.1-0.2 km a−1 from the period 1984-90 (compared to the period 1972-84) was first noted by Ferrigno and others (1993). This increase may be the initial response to the loss of Thwaites Iceberg tongue in 1986, which probably had been pinned on shoals, hindering flow. According to the data presented here, Thwaites Glacier ice tongue accelerated a further 0.4 km a−1 between these earlier measurements and those of 1993. The removal of the iceberg tongue may have relieved some of the back-pressure exerted on the ice at the grounding line, enabling the glacier tongue to flow unrestricted (Thomas, 1979) and speed up. Thwaites Glacier ice tongue could also be experiencing high basal melt rates, similar to Pine Island Glacier (Reference Jenkins, Vaughan, Jacobs, Hellmer and KeysJenkins and others, 1997), causing it to thin and become detached from the subglaciol shoals, thus permitting more rapid flow. BothThwaites Glacier and Pine Island Glacier (Lucchitta and others, 1995) increase in velocity by about 1 km a−1 as the ice crosses the grounding line. This rapid change may be unique to fast-moving glaciers lacking ice shelves.
The western Gctz Ice Shelf displays more rapid velocities than the eastern shelf (Fig. 7). These higher velocities, including those of DeVicq Glacier (figs 7 and 8), which flows through the Gctz Ice Shelf, may be due to steeper catchment slopes in this area (close to 0.02) resulting in increased driving stresses. The relatively high velocity of Land Glacier cannot be explained solely by high precipitation in the region (surface accumulations of 300-400 mm a−1; Reference Giovinetto and BentleyGiovinetto and Bentley, 1985; Reference Budd, Reid and MintyBudd and others, 1995) or by higher surface gradients, since both are similar to those of nearby segments of the Marie Byrd Land coast where the ice does not flow as fast. The low subglaciol floor beneath Land Glacier provides one possible explanation. Little is known about the nature of materials on the sub-Glaciol floor, but Reference WadeWade (1969) suggests that large morainic deposits could be expected in this region. Such deposits of possibly deforming till could have enhanced the capability to slide (Reference Alley, Blankenship, Bentley and RooneyAlley and others, 1986; Reference Blankenship, Bentley, Rooney and AlleyBlankenship and others, 1986). Land Glacier also lacks a buttressing ice shelf, enabling the glacier to flow unimpeded.
Glaciers feeding Sulzberger Bay are very slow. The most likely reasons for the relatively low velocities on this ice shelf are the moderate gradients above the ice shelf leading to nearby ice divides delimited by low mountains surrounding the bay, and the impediments in the glacier's path in the form of numerous islands and ice rises.
Overall, velocities of glaciers and ice shelves are relatively high along the Marie Byrd Land coast compared to other regions of Antarctica (Swithinbank, 1988). These are consistent with the high precipitation rates on the West Antarctic ice sheet, particularly along the coastal areas. Other variables that could expla in the rapid velocities are the relatively steep surface slopes resulting in high driving stresses, and the local lack of buttressing ice shelves.
Acknowledgements
We are grateful to R. Bindschadler and T. Scambos, who made the automated cross-correlation program available to us. D. J. Chadwick performed the measurements for Land Glacier. R. Williams, Jr, B. Raup and T. Scambos provided helpful reviews. All ERS-1 images were made available by the ESA free of charge. The research was funded by the Global Change and Climate History Program of the U.S. Geological Survey.