


The use of carbohydrates as digestible energy sources in fish diets bears economic significance in aquaculture industry( Reference Wilson 1 ). Diets that contain digestible carbohydrates can promote rapid growth and provide metabolic intermediates for the synthesis of other biologically important compounds( Reference Kim and Kaushik 2 , Reference Grisdale-Helland and Helland 3 ). When carbohydrates are not provided in feedstuffs, more proteins are catabolised for energy and for the synthesis of glucose, which impairs protein retention and increases N excretion into the environment( Reference Wilson 1 , Reference Cowey, Walton and Halver 4 ). Therefore, it is important to provide an appropriate amount of carbohydrates in fish diets. However, the mechanisms of carbohydrate digestion, absorption and metabolism are different among different fish species; that is, omnivorous or herbivorous fish can utilise higher amounts of dietary carbohydrates and exhibit a greater degree of protein sparing( Reference Krogdahl, HEMRE and Mommsen 5 – Reference Deng, Refstie and Hemre 7 ), whereas carnivorous fish species have a relatively low ability to utilise carbohydrates( Reference Palmer and Ryman 8 ).
The liver plays an important role in the coordination of whole-body metabolic functions in response to nutritional status. Specifically, in conjunction with the gastrointestinal tract, the liver plays a major role in glucose metabolism including gluconeogenesis and glycolysis. Most of the knowledge on these metabolic processes comes from studies in mammals. However, in fish, glucose does not appear to have the same effects on metabolism( Reference Hemre, Mommsen and Krogdahl 9 ). Correspondingly, the dietary regulation of gluconeogenic and glycolytic gene expression and activity in relation to carbohydrate utilisation in fish appears to be influenced by the potential variation in carbohydrate supply. For example, induction of both gene expression and enzyme activity of glucokinase (GK) by high dietary carbohydrates (>20 % digestible starch) has been observed in the liver of rainbow trout (Oncorhynchus mykiss), gilthead seabream (Sparus aurata) and common carp (Cyprinus carpio)( Reference Panserat, Médale and Blin 10 ). Pyruvate kinase (PK) is a key glycolytic enzyme that catalyses the last step in glycolysis( Reference Enes, Panserat and Kaushik 11 ). The activity and gene expression of PK in the liver have been reported to decrease during starvation or diabetes and increase as a result of high-carbohydrate feeding or insulin administration( Reference Pilkis and Granner 12 ). Dietary carbohydrates have been shown to have no significant effects on the expression and activity of phosphoenolpyruvate carboxykinase (PEPCK) and glucose-6-phosphatase (G6Pase) in the liver of rainbow trout( Reference Kirchner, Panserat and Lim 13 ).
Gut is also an important organ involved in digestion and absorption. Different nutrients can affect the regulation of gastrointestinal tract gene expression and enzyme activity. Na-dependent glucose co-transporter 1 (SGLT-1) plays an important role in glucose absorption and homeostasis. Short-term feeding with a high-starch diet has been shown to improve intestinal glucose absorption and SGLT-1 activity and protein density in mice( Reference Ferraris and Diamond 14 ). High-carbohydrate diets, compared with carbohydrate-free diets, have been reported to increase the expression of SGLT-1 gene in the intestine of trout( Reference Kirchner, Panserat and Lim 13 ). Increased dietary starch content has been shown to enhance the activity of amylase but not affect its mRNA levels in sea bass larvae( Reference Péres, Zambonino Infante and Cahu 15 ). The expression of maltase gene has been reported to be higher in juvenile rainbow trout that experienced a hyperglucidic stimulus in the larval stages than in the control fish in the glucose loading test( Reference Geurden, Aramendi and Zambonino-Infante 16 ).
Evidence for nutritional programming has been established in animals, in which brief pre- or postnatal nutritional manipulations may programme adult size, metabolism, blood lipids, blood pressure, obesity, atherosclerosis, learning, behaviour and lifespan( Reference Lucas 17 ). However, there is limited information about the effects of early nutritional programming in fish. Recently, zebrafish has been proposed as a possible model for nutrition and growth studies and nutritional genomics in fish( Reference Ulloa, Iturra and Neira 18 – Reference Dahm and Geisler 20 ). Therefore, in the present study, we used zebrafish as a model to determine potential long-term persistent metabolic changes in carbohydrate utilisation in adult zebrafish through early nutritional programming (feeding high-carbohydrate diets) during an early sensitive period. As early high-carbohydrate programming phases, four ontogenetic stages, from the first-feeding stage to the end of the yolk-sac larval stage (FF-3), from the first-feeding stage to 2 d after yolk-sac exhaustion (FF-5), and after yolk-sac exhaustion for 3 or 5 d (YE-3 or YE-5), were chosen. Fish were fed high-carbohydrate diets during these stages. We assessed growth, blood glucose levels, and hepatic and intestinal gene expression and activities of enzymes in an attempt to obtain insights into the pattern of carbohydrate digestion, transport and metabolism through early nutritional programming.
Materials and methods
Preparation of experimental diets and feeding scheme
In the present study, two laboratory-prepared diets and one commercially available diet were used. The experimental diets were prepared in the College of Fisheries at Huazhong Agricultural University, Wuhan, China. Maltodextrin (MD) obtained from the Gao Long Dietary Company (Wuhan, China) was used as the carbohydrate source. The ingredients were ground into a fine powder through a 320 μm mesh. All the ingredients were thoroughly mixed with fish oil, and water was added to obtain stiff dough. The dough was then pelleted and dried for about 12 h in a ventilated oven at 60°C. After drying, the pellets were broken up, sieved into a proper size and stored at − 20°C until use. The commercial zebrafish diet was purchased from Beijing New Rainbow Feed Industries Company Limited, Beijing, China. The ingredient formulation and proximate chemical composition of the experimental diets and commercial diet are given in Table 1.
Table 1 Ingredient formulation and proximate chemical composition of the experimental diets and commercial diet
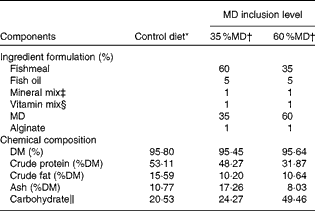
MD, maltodextrin.
* A commercial zebrafish diet (Beijing New Rainbow Feed Industries Company Limited).
† 35 %MD: diet containing 35 %MD; 60 %MD: diet containing 60 %MD; MD was obtained from the Gao Long Dietary Company.
‡ Mineral premix (mg/kg diet): NaCl, 0·80; MgSO4.7H2O, 12; NaH2PO4.2H2O, 20; KH2PO4, 25·6; Ca(H2PO4)2.H2O, 16; FeSO4.5H2O, 2; (CH2CHCOO)2Ca.5H2O, 2·8; ZnSO4.7H2O, 0·028; MnSO4.4H2O, 0·013; CuSO4.5H2O, 0·0025; CoCl2.6H2O, 0·0008; KIO3, 0·0024; cellulose, 0·36 (Gao Long Dietary Company).
§ Vitamin premix (mg/kg diet): vitamin A, 1·83; vitamin D, 0·5; vitamin E, 10; vitamin K, 10; niacin, 100; riboflavin, 20; pyridoxine, 20; thiamin, 20; d-calcium pantothenate, 50; biotin, 1·0; folic acid, 5; vitamin B12, 2; ascorbic acid, 100; inositol, 100 (Gao Long Dietary Company).
∥ Carbohydrate = 1 − (crude protein+crude fat+ash).
The zebrafish were fed a 60 %MD diet at four ontogenetic stages: the first-feeding 3 d period (FF-3, from the first-feeding stage to the end of the yolk-sac larval stage); the first-feeding 5 d period (FF-5, from the first-feeding stage to 2 d after yolk-sac exhaustion); after yolk-sac exhaustion for 3 or 5 d (YE-3 or YE-5) as early high-carbohydrate programming phases. A 35 %MD diet was fed to adult fish for 1 week as the final challenge test to determine the effect of early nutritional programming. Before and after being fed the 60 %MD diet, the fish were fed the commercial zebrafish diet until the adult stage. The control group was fed the commercial diet from the beginning of the first-feeding stage to the final challenge test. During the high-carbohydrate dietary programming period, feed was manually distributed six times daily to visual satiety from 08.00 to 18.00 hours and thereafter two times daily at 09.00 and 16.00 hours for the rest of the experimental period. The feeding regimen is summarised in Table 2.
Table 2 Feeding regimen followed in the experiment
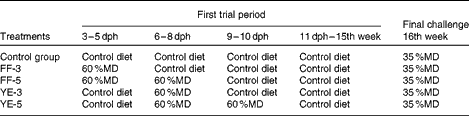
dph, days post-hatching; MD, maltodextrin; FF-3, fish fed the 60 %MD diet from the first-feeding stage to the end of the yolk-sac larval stage; FF-5, fish fed the 60 %MD diet from the first-feeding stage to 2 d after yolk-sac exhaustion; YE-3, fish fed the 60 %MD diet after yolk-sac exhaustion for 3 d; YE-5, fish fed the 60 %MD diet after yolk-sac exhaustion for 5 d.
Fish-rearing conditions and sampling
Zebrafish (ripe fish) were obtained from the Institute of Hydrobiology, Chinese Academy of Sciences (Wuhan, China), and reared with artemia before fertilisation. Fish larvae were transferred to an indoor filtered recirculating culture system (Shanghai Haisheng Aquarium Facility Manufactory) 6 d after hatching( Reference Hensley and Leung 21 , Reference Ng, de Jong-Curtain and Mawdsley 22 ), where only respiratory gases and heat were allowed to exchange freely via 150-lam screen mesh filters. The capacity of each tank was 10·3 litres (25L × 20 W × 18H cm), with each tank having 200 larvae. The five experimental groups were randomly assigned to the tanks with three replicate (n 200 fish per tank) per dietary treatment for 16 weeks. Initial stocking density was 200 fish per tank (twenty fish per litre). When the total length of the fish reached 10 mm, some were removed to decrease the density to 100 fish per tank (10/litre). The flow rate with sufficient aeration was 1·33–1·50 l/min. Photoperiod was set at 14 h light–10 h dark by microcomputer timer switch. Temperature was maintained at 28 ± 0·5°C and pH at 7·53–7·70. The concentrations of NH3, NO2 − and NO3 − were < 0·1 mg/l.
At the end of the early high-carbohydrate programming period, fifteen fish were randomly sampled from each tank to measure body weight (collectively weighed to calculate their average body weight) and length (using an Olympus LG-SP2 stereoscopic microscope, SZX2-FOF 9J01021). The whole bodies of larvae were quickly frozen in liquid N2 and stored at − 80°C until molecular analyses. At the end of the feeding experiment, the adult zebrafish were large enough for collecting samples of individual tissues. The fish were sampled 3 h after being fed the last meal. The fish were anaesthetised with tricaine methanesulfonate (Sigma) and body length and weight were measured. Then, the fish were patted dry with filter paper and placed on a glass surface. Blood was sampled at the caudal vein to measure plasma glucose levels using a blood glucose monitor (Accu-Chek Performa, Roche). For each group, three readings were taken. The liver and intestinal tissue samples were quickly frozen in liquid N2 and stored at − 80°C until analyses. The animal experimental procedures were in compliance with Huazhong Agricultural University Ethics Committee's Code of Practice for the Care and Use of Animals for Scientific Purposes. In the present experiment, there were no aspects that caused aggravation or unnecessary harm or stress to the fish.
Assessment of enzyme activities
For assaying the activities of enzymes involved in protein metabolism, crude extracts of liver were obtained by homogenisation of frozen tissue in ice-cold 0·7 % saltwater. Following centrifugation (3200 g for 20 min at 4°C), the activities of enzymes were determined using a microplate reader (SPECTRAFluor; Tecan) and microplates. The activities of GK (EC 2.7.1.2), G6Pase (EC 3.1.3.9) and PK (EC 2.7.1.40) were estimated as described previously( Reference Polakof and Soengas 23 ). The activities of PEPCK (EC 4.1.1.32) and α-amylase (AMY, EC 3.2.1.1) were determined as described previously( Reference Gaxiola, Cuzon and García 24 , Reference Kirchner, Seixas and Kaushik 25 ).
Gene expression analysis by real-time quantitative RT-PCR
Total RNA was extracted using the TRIzol reagent (Invitrogen), treated with RQI RNase-free DNase (Takara) to remove DNA contaminants and then spectrophotometrically quantified using a UV–vis spectrophotometer (Nanodrop ND-1000, Thermo Fisher Scientific). Optical density (OD) A260:A280 ratios were 1·8–2·0 and OD 260:230 ratios were >1·8. For each RT reaction, 2 μg of RNA were subjected to complementary DNA synthesis using the SuperScript™ II Reverse Transcriptase (Takara) according to the manufacturer's instructions. The primers of the selected genes used in the real-time PCR are listed in Table 3. Relative quantification of the target gene transcripts was done using β-actin gene as the reference(
Reference Pang and Ge
26
), which was stably expressed in the present experiment. After the final PCR cycle, melting curves were systematically monitored (55°C temperature gradient at 0·5°C/s from 55 to 94°C) to ensure that only one fragment was amplified. Real-time PCR was carried out using a quantitative thermal cycler (Bio-Rad CFX96, Bio-Rad) with the SYBR Green Real Time PCR Master Mix (Takara) according to the manufacturer's recommendations. The PCR parameters were forty cycles at 95°C for 15 s, 60°C for 15 s and 72°C for 45 s, with an additional initial 1 min denaturation step at 95°C. Pooled complementary DNA samples of the respective tissues were used to generate the calibration curves. The amplification efficiencies of the control and target genes were approximately equal and ranged from 95·4 to 101·1 %. The expression of the genes was quantified relative to that of β-actin using the optimised comparative C
t (
 $$2^{ - \Delta \Delta C _{t}} $$
) value method(
Reference Livak and Schmittgen
27
). All amplifications were carried out in triplicate for each RNA sample.
$$2^{ - \Delta \Delta C _{t}} $$
) value method(
Reference Livak and Schmittgen
27
). All amplifications were carried out in triplicate for each RNA sample.
Table 3 List of primers used in the quantitative real-time PCR
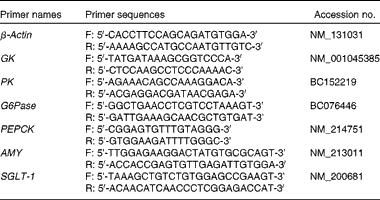
GK, glucokinase; PK, pyruvate kinase; G6Pase, glucose-6-phosphatase; PEPCK, phosphoenolpyruvate carboxykinase; AMY, α-amylase; SGLT-1, sodium-dependent glucose co-transporter 1.
Statistical analyses
All the statistical analyses were carried out using the SPSS 17.0 program for Windows (SPSS Inc.). Data are presented as means with their standard errors. The means within each treatment group and among the treatment groups were subjected to one-way ANOVA followed by Duncan's multiple range tests. The normality of data was assessed with the Shapiro–Wilk test using the SPSS software, and all the data were normally distributed. The data were also tested for homogeneity using SPSS, and P values were greater than the α-level in the homogeneity of variance test( Reference Morgan, Leech and Gloeckner 28 ) .
Results
Short- and long-term effects of early dietary carbohydrate manipulation on growth performance
Significant effects of early dietary carbohydrate manipulation were observed on the body weight and length of the fish, as indicated by the mean weight and individual length data given in Table 4. In the FF-3 period, significant differences in growth were observed between the four groups. At the end of the FF-3 and FF-5 periods, the larvae (1·50 (se 0·02) and 0·90 (se 0·04) mg) were significantly heavier than those of the control group (0·66 (se 0·05) and 0·70 (se 0·05) mg). However, at the end of the YE-3 and YE-5 periods, the inverse was observed: the FF-3 and FF-5 larvae (0·69 (se 0·05) and 0·53 (se 0·05) mg) had a lower body weight than those of the control group (0·93 (se 0·04) and 1·55 (se 0·02) mg). Compared with the corresponding developmental stages of the control group, the experimental groups were shorter in body length. As expected, the body weight and length of the control group increased gradually with the progression of the experiment. The final body weight of the four experimental groups was not different from that of the control group. Although not significant, the body length of the first-feeding groups was shorter than that of the control group. Condition index was significantly increased in the FF-5 group (Table 5).
Table 4 Growth performance of zebrafish during the early stages (Mean values with their standard errors)
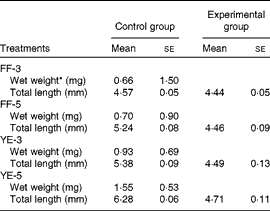
FF-3, fish fed the 60 % maltodextrin (60 %MD) diet from the first-feeding stage to the end of the yolk-sac larval stage; FF-5, fish fed the 60 %MD diet from the first-feeding stage to 2 d after yolk-sac exhaustion; YE-3, fish fed the 60 %MD diet after yolk-sac exhaustion for 3 d; YE-5, fish fed the 60 %MD diet after yolk-sac exhaustion for 5 d.
* Due to small size, the mean weight was used.
Table 5 Growth performance and plasma glucose levels (mm) of adult zebrafish (Mean values with their standard errors)
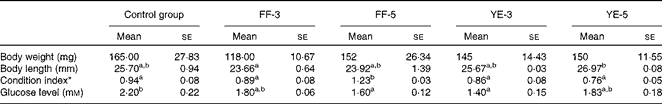
Control group, fish fed the commercial diet; FF-3, fish fed the 60 % maltodextrin diet from the first-feeding stage to the end of the yolk-sac larval stage; FF-5, fish fed the 60 % maltodextrin diet from the first-feeding stage to 2 d after yolk-sac exhaustion; YE-3, fish fed the 60 % maltodextrin diet after yolk-sac exhaustion for 3 d; YE-5, fish fed the 60 % maltodextrin diet after yolk-sac exhaustion for 5 d.
a,bMean values within a row with unlike superscript letters were significantly different (P< 0·05; one-way ANOVA and Duncan's multiple range tests).
* Condition index = body weight (mg)/length (mm)3× 100.
Gene expression in the larval stages
The effects of short-term dietary carbohydrate manipulation on the expression of six genes, including GK, PK, PEPCK, G6Pase, AMY and SGLT-1, in the larval stages are shown in Fig. 1. The expression of all the genes, except PK gene, in the larvae of the FF-3 group was up-regulated compared with that in the larvae of the control group fed the commercial diet (Fig. 1(A)). In the FF-5 group, the expression of only GK gene was significantly increased. The expression of PK, PEPCK, G6Pase and SGLT-1 genes was significantly down-regulated, while the mRNA levels of AMY did not change significantly (Fig. 1(B)). After yolk-sac exhaustion, the expression of SGLT-1 gene was significantly higher in the larvae of the YE-3 group than in those of the control group; the expression of other genes was significantly down-regulated, except that of GK (Fig. 1(C)). The expression of GK gene in the FE-5 group was up to 14-fold greater than that in the control group and that of AMY gene was also up-regulated. The expression of PEPCK and SGLT-1 genes remained unaltered. The mRNA levels of PK and G6Pase in the YE-5 group were lower than those in the control group (Fig. 1(D)).

Fig. 1 Expression of six key genes in zebrafish larvae fed high-carbohydrate diets at different stages. GK, glucokinase; PK, pyruvate kinase; G6Pase, glucose-6-phosphatase; PEPCK, phosphoenolpyruvate carboxykinase; AMY, α-amylase; SGLT-1, sodium-dependent glucose co-transporter 1. Control (■): fish fed the commercial diet; (A) FF-3 (![]() ): fish fed the 60 % maltodextrin diet from the first-feeding stage to the end of the yolk-sac larval stage; (B) FF-5 (
): fish fed the 60 % maltodextrin diet from the first-feeding stage to the end of the yolk-sac larval stage; (B) FF-5 (![]() ): fish fed the 60 % maltodextrin diet from the first-feeding stage to 2 d after yolk-sac exhaustion; (C) YE-3 (
): fish fed the 60 % maltodextrin diet from the first-feeding stage to 2 d after yolk-sac exhaustion; (C) YE-3 (![]() ): fish fed the 60 % maltodextrin diet after yolk-sac exhaustion for 3 d; (D) YE-5 (
): fish fed the 60 % maltodextrin diet after yolk-sac exhaustion for 3 d; (D) YE-5 (![]() ): fish fed the 60 % maltodextrin diet after yolk-sac exhaustion for 5 d. Expression results were normalised to β-actin expression, which did not change with treatment. Values are means (n 6), with their standard errors represented by vertical bars. a,bMean values of the carbohydrate dietary treatment fish with unlike letters were significantly different from those of the control fish (P< 0·05; one-way ANOVA and Duncan's multiple range tests).
): fish fed the 60 % maltodextrin diet after yolk-sac exhaustion for 5 d. Expression results were normalised to β-actin expression, which did not change with treatment. Values are means (n 6), with their standard errors represented by vertical bars. a,bMean values of the carbohydrate dietary treatment fish with unlike letters were significantly different from those of the control fish (P< 0·05; one-way ANOVA and Duncan's multiple range tests).
Plasma glucose levels, hepatic and intestinal enzyme activities and metabolite levels in adult zebrafish
The plasma glucose levels of the adult zebrafish are summarised in Table 5. Compared with those of the control group (2·2 mm), the plasma glucose levels of the four treatment groups exhibited various degrees of decline, ranging from 1·4 to 2·2 mm, with the levels of the FF-5 and YE-3 groups being significantly lower than those of the control group.
Gene expression and enzyme activities in the liver and intestine of adult zebrafish subjected to the final challenge test with the 35 %MD diet are shown in Figs. 2 and 3, respectively. After the final challenge test, the transcript levels of the six key genes involved in carbohydrate digestion, transport and metabolism were determined in the adult fish (Fig. 2). The hepatic mRNA levels of GK in the FF-3 group were increased. The hepatic mRNA levels of PK in the FF-5 group were higher than those in the control group. The hepatic mRNA levels of G6Pase in the four treatment groups were not significantly different from those in the control group; however, all the four treatment groups had significantly lower mRNA levels of PEPCK than the control group. The expression of AMY gene in the adult fish of the FF-3 group was higher than that in the adult fish of the other four groups. The expression of SGLT-1 gene in the FF-3 and FF-5 groups was higher and that in the YE-3 and YE-5 groups was lower than that in the control group.
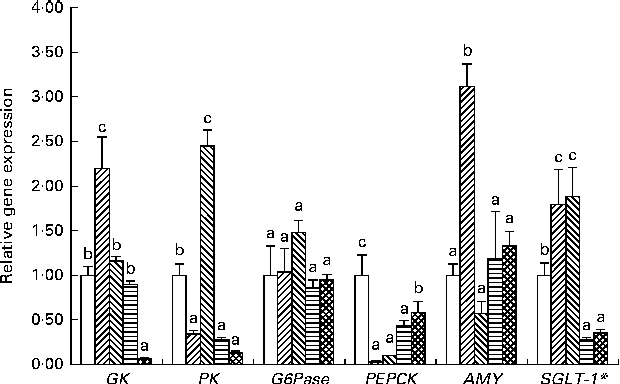
Fig. 2 Long-term effect of early high-carbohydrate stimuli on hepatic and intestinal gene expression in adult zebrafish (16-week feeding experiments). Control (□): fish fed the commercial diet; FF-3 (![]() ): fish fed the 60 % maltodextrin diet from the first-feeding stage to the end of the yolk-sac larval stage; FF-5 (
): fish fed the 60 % maltodextrin diet from the first-feeding stage to the end of the yolk-sac larval stage; FF-5 (![]() ): fish fed the 60 % maltodextrin diet from the first-feeding stage to 2 d after yolk-sac exhaustion; YE-3 (
): fish fed the 60 % maltodextrin diet from the first-feeding stage to 2 d after yolk-sac exhaustion; YE-3 (![]() ): fish fed the 60 % maltodextrin diet after yolk-sac exhaustion for 3 d; YE-5 (
): fish fed the 60 % maltodextrin diet after yolk-sac exhaustion for 3 d; YE-5 (![]() ): fish fed the 60 % maltodextrin diet after yolk-sac exhaustion for 5 d. Transcript levels of target genes were normalised to those of β-actin. Except the expression analysis of SGLT-1* gene carried out on total RNA extracted from intestinal tissue samples, expression analyses of other genes were carried out on total RNA extracted from liver tissue samples. Values are means (n 6), with their standard errors represented by vertical bars. Statistical differences in gene expression between the samples were evaluated as means with their standard errors. a,b,cMean values with unlike letters were significantly different among the groups (P< 0·05; one-way ANOVA and Duncan's multiple range tests). GK, glucokinase; PK, pyruvate kinase; G6Pase, glucose-6-phosphatase; PEPCK, phosphoenolpyruvate carboxykinase; AMY, α-amylase; SGLT-1, sodium-dependent glucose co-transporter 1.
): fish fed the 60 % maltodextrin diet after yolk-sac exhaustion for 5 d. Transcript levels of target genes were normalised to those of β-actin. Except the expression analysis of SGLT-1* gene carried out on total RNA extracted from intestinal tissue samples, expression analyses of other genes were carried out on total RNA extracted from liver tissue samples. Values are means (n 6), with their standard errors represented by vertical bars. Statistical differences in gene expression between the samples were evaluated as means with their standard errors. a,b,cMean values with unlike letters were significantly different among the groups (P< 0·05; one-way ANOVA and Duncan's multiple range tests). GK, glucokinase; PK, pyruvate kinase; G6Pase, glucose-6-phosphatase; PEPCK, phosphoenolpyruvate carboxykinase; AMY, α-amylase; SGLT-1, sodium-dependent glucose co-transporter 1.

Fig. 3 Activities of five key enzymes in adult zebrafish 3 h after the last feeding. (A) Glucokinase (GK); (B) pyruvate kinase (PK); (C) phosphoenolpyruvate carboxykinase (PEPCK); (D) glucose-6-phosphatase (G6Pase); (E) α-amylase activities. The activities of these enzymes were determined using liver tissue samples. ND means no data. Values are means (n 6 fish per treatment and time), with their standard errors represented by vertical bars. a,b,c,dMean values with unlike letters were significantly different among the groups (P< 0·05; one-way ANOVA and Duncan's multiple range tests). Control group, fish fed the commercial diet; FF-3, fish fed the 60 % maltodextrin diet from the first-feeding stage to the end of the yolk-sac larval stage; FF-5, fish fed the 60 % maltodextrin diet from the first-feeding stage to 2 d after yolk-sac exhaustion; YE-3, fish fed the 60 % maltodextrin diet after yolk-sac exhaustion for 3 d; YE-5, fish fed the 60 % maltodextrin diet after yolk-sac exhaustion for 5 d.
The activities of GK and PK (Fig. 3(A) and (B)) were significantly altered by early high-carbohydrate feeding. Compared with those in the control group, the adult zebrafish in all the four treatment groups exhibited significant increases in the activity of GK. The activity of PK was also significantly enhanced, except for that in the FF-3 group. The activity of G6Pase (Fig. 3(C)) was significantly decreased in only the FF-5 group. A significant decrease in the activity of PEPCK was observed in the FF-5 and YE-5 groups (Fig. 3(D)). The activity of intestinal AMY (Fig. 3(E)) was significantly enhanced in the FF-3 group than in the control group.
Discussion
In humans, nutritional and metabolic exposure during critical periods of early development can have a long-term programming effect in adulthood( Reference Demmelmair, von Rosen and Koletzko 29 ). The same conclusions have been reached for rats( Reference Hall 30 ). Based on this concept, we carried out a study on potential nutritional programming in zebrafish. The goals of the study were to determine the effects of early short-term nutritional programming on growth, blood glucose levels, and hepatic and intestinal gene expression and activities of enzymes in zebrafish during a sensitive period and to determine potential long-term persistent metabolic changes in carbohydrate utilisation in adult zebrafish.
Effects of early-stage high-carbohydrate feeding on growth and gene expression
A significant increase in the weight of the larvae of the FF-3 group than in that of the larvae of the control group was observed, which might be due to differences in the ability to digest and metabolise dietary carbohydrates. In these early stages, the pancreatic enzymes (proteases, lipases and glucosidases) along with enterocyte cytosolic proteases are responsible for the digestive capacity( Reference Zambonino Infante and Cahu 31 ). Some scholars believe that there is a close relationship between carbohydrates and feeding habit than between proteins and feeding habit during the early larval stages( Reference Hidalgo, Urea and Sanz 32 – Reference Fan, Klein and Flanagan-Steet 34 ). Panserat et al. ( Reference Panserat, Fontagnéa and Bergota 35 ) also found that carp larvae are capable of utilising dietary carbohydrates efficiently during the first-feeding stage. The body weight and length of the larvae of the control group increased gradually after hatching as did the growth rate (from 6 to 66 %). These results are in agreement with those of a study that used a novel method for rearing first-feeding zebrafish larvae( Reference Best, Adatto and Cockington 36 ) and imply that the transition to the external feeding stage is accompanied by a drastic change in digestive and metabolic capacities to ensure efficient utilisation of exogenous feed( Reference Hoehne-Reitan and Kjorsvik 37 ). When yolk nutrients are no longer sufficient to support the metabolic demand of the larvae, they must initiate exogenous feeding. However, zebrafish larvae exhibited an adverse trend in body weight and length when fed the high-carbohydrate diets.
We observed changes in the expression of AMY gene in the FF-3 and FF-5 groups, with the high-carbohydrate diets inducing 4-fold and about 2-fold increases compared with the control diet. These increases were induced due to the MD content of the carbohydrate diets. This was consistent with the results of a study carried out in rainbow trout( Reference Aleström, Holter and Nourizadeh-Lillabadi 19 ). However, the expression of AMY gene exhibited a significant decrease in the YE-3 group and subsequently an increase in the YE-5 group. Similar results were obtained by other authors for Asian sea bass (Dicentrarchus labrax), winter flounder (Pseudopleuronectes americanus) and mudskipper (Boleophthalmus pectinirostris)( Reference Cahu and Infante 38 – Reference Douglas, Mandla and Gallant 40 ). Douglas et al. ( Reference Douglas, Mandla and Gallant 40 ) showed that AMY transcript levels increased at approximately day 20 and then decreased during metamorphosis in the winter flounder. Moreover, this decrease in AMY transcript levels is observed irrespective of the dietary carbohydrate concentration( Reference Peres, Cahu and Zambonino Infante 41 ), suggesting that the decrease in AMY activity during larval development is genetically programmed. A study carried out in the mudskipper( Reference Wu, Hong and Zhang 39 ) has also reported that AMY activity is higher in the larval stage, decreases drastically in the juvenile stage, and increases rapidly in the early young stage. This particular change in AMY activity may reflect different nutrient requirements at different stages in life.
Dietary glucose is transported into the lumen of the small intestine across the brush border membrane by SGLT-1 and then across the basolateral membrane into the blood by GLUT2( Reference Ferraris 42 ). Both SGLT-1 and GLUT2 are up-regulated by high-carbohydrate diets than by non-carbohydrate diets in the intestine of rainbow trout( Reference Panserat, Plagnes-Juan and Kaushik 43 , Reference Sugiura, McDaniel and Ferraris 44 ). The high expression levels of SGLT-1 gene in the FF-3 and YE-3 groups were in line with observations in the omnivorous black bullhead (Ictalurus melas)( Reference Soengas and Moon 45 ), in which an increase in both apical and basolateral membrane glucose transport with high-carbohydrate diets has been reported. However, the dietary up-regulation of the expression of SGLT-1 gene observed from the first-feeding to the external feeding stage (FF-5) was not amplified by the early nutritional stimulus. The transcription of SGLT-1 in zebrafish larvae in the early stages was not fully expected, because dietary adaptation of intestinal glucose transport normally appears to be determined by the potential variation in carbohydrate supply of the natural diet of the organism( Reference Péres, Zambonino Infante and Cahu 15 , Reference Geurden, Aramendi and Zambonino-Infante 16 ).
The enhanced transcription of GK, the first enzyme of glycolysis, in the larvae of the four treatment groups indicates that zebrafish adapt rapidly to the utilisation of exogenous glucose in the early stages. These results are clearly in agreement with those of previous studies carried out in rainbow trout and carp (C. carpio) larvae( Reference Aleström, Holter and Nourizadeh-Lillabadi 19 , Reference Panserat, Capilla and Gutierrez 46 ). These findings in fish larvae indicate that the appearance of the GK enzyme is not developmentally determined but is controlled by the presence of a nutritional stimulus. In contrast, low PK transcript levels were found in the four treatment groups. PK is another key glycolytic enzyme that catalyses the last step in glycolysis( Reference Enes, Panserat and Kaushik 11 ). Cowey et al. ( Reference Cowey, Knox and Walton 47 ) reported that an intraperitoneal injection of insulin has no effect on the activity of hepatic PK in rainbow trout fed a high-carbohydrate diet. More recently, Plagnes-Juan et al. ( Reference Plagnes-Juan, Lansard and Seiliez 48 ) have also reported that insulin administration has no effect on the expression of PK gene in rainbow trout. Another possible reason is linked to post-transcriptional regulation( Reference Panserat, Plagnes-Juan and Kaushik 43 ). There is less information on the molecular regulation of PK during early development in fish. Therefore, further studies are needed to address the expression of PK gene in fish larvae.
One of the principal parameters affecting endogenous glucose output is the availability of gluconeogenic substrates( Reference Barthel and Schmoll 49 ). In the present study, high expression levels of G6Pase and PEPCK genes were found before the initiation of exogenous feeding. Data obtained for the FF-3 group suggest that this induction is mainly due to the catabolism of the vitelline reserves. After this stage, the expression of these two genes was markedly inhibited by the high-carbohydrate diets. These results are in agreement with the failure of dietary carbohydrates to suppress glucose output in rainbow trout observed at the later stage of first-feeding development( Reference Aleström, Holter and Nourizadeh-Lillabadi 19 ). The inhibition of the expression of G6Pase and PEPCK genes induced after the start of exogenous feeding shows the capacity of the fish larvae to carry out glycaemic regulation and to act on the presence of exogenous glucose.
Long-term effects of early high-carbohydrate feeding in adult zebrafish
In mammals, metabolic programming is an ‘adaptive process’ that occurs in response to a nutritional stimulus during an early sensitive period of life( Reference Patel and Srinivasan 50 ). In the present study, high-carbohydrate diet feeding during the larval stages was used to metabolically programme the fish. We determined whether the short-term physiological plasticity towards dietary carbohydrates observed at the early feeding stage in the fish would persist in the adult stage. There was no negative effect of the early acute nutritional stimuli on the growth or survival of the adult zebrafish. After the 16-week experiment, the difference in body weight and length disappeared in the adult zebrafish, despite a significant difference in initial weight and length during the larval stages, in line with the results of previous studies carried out in rainbow trout( Reference Aleström, Holter and Nourizadeh-Lillabadi 19 ). These findings suggest that early dietary interventions do not influence the health status of the fish. On the other hand, a high-condition factor was observed in the FF-5 group, which experienced transition from the polyculture to the external feeding stage, suggesting that the physiological conditions of adult fish can be improved during this particular ontogenetic phase( Reference Bolger and Connolly 51 ).
It is well known that if carbohydrates are given in excess, glucose intolerance and metabolic burden may result in teleost fish( Reference Hemre, Mommsen and Krogdahl 9 ). In fact, several studies have shown that high levels of dextrin in diets lead to constantly high blood sugar levels( Reference Hemre, Sandnes and Waagbø 52 ). In the present study, however, plasma glucose levels of the treatment groups tended to decrease compared with those of the control group. This indicates that glucose uptake into tissues and glucose phosphorylation levels of the treatment groups might be improved. However, plasma glucose levels of rainbow trout have been shown to be unaffected by a history of early carbohydrate feeding( Reference Aleström, Holter and Nourizadeh-Lillabadi 19 ), suggesting that omnivorous fish may have glucose homeostasis mechanisms that allow then to metabolically adapt to dietary glucose. The reason for this may probably be the differences in dietary glucose loading and feeding habits. Since fish represent the most diverse and primitive group of vertebrates( Reference Wang and Ge 53 ), this finding may serve as a useful reference point for comparative studies in other vertebrates.
The present results indicate that although dietary glucose is a partial inducer of the expression of the GK gene, the activity of the GK enzyme increases during rapid adaptation in this species as in mammals( Reference Printz, Magnuson and Granner 54 ). Although the expression levels of GK gene were low, except in the FF-3 group, the activity of GK enzyme was highly induced. This induction may result from a simple translocation from a regulatory protein. It is worth noting that glycaemia was rapidly suppressed when the levels of GK enzyme increased, suggesting that GK protein is important for glucose homeostasis control in fish. No changes in the expression of PK gene were observed in the adult zebrafish as in the larvae. The stability of PK gene is a crucial factor in regulation at the translational level in mammals( Reference Yamada and Noguchi 55 ). The present results suggest that PK transcripts might remain relatively steady due to the characteristics of the inherent molecules. However, the hepatic mRNA levels and activity of PK increased in lockstep in the FF-5 group. The reason for this could be the effective adaptation to the carbohydrate diets from the polyculture to the external feeding stage.
Several studies carried out in fish have indicated that the expression and enzyme activity of G6Pase are not suppressed by dietary carbohydrates, suggesting a low flexibility of gluconeogenesis in various teleosts( Reference Aleström, Holter and Nourizadeh-Lillabadi 19 , Reference Panserat, Capilla and Gutierrez 46 , Reference Panserat, Médale and Breque 56 – Reference Panserat, Plagnes-Juan and Breque 58 ). However, the activity of G6Pase enzyme was decreased in the FF-5 group by the carbohydrate diets. This finding suggests that the transition period from the polyculture to the external feeding stage is very important for the adaptation of this enzyme. It has been shown that both gene expression and activity of this important gluconeogenic enzyme are independent of carbohydrate-rich diet intake( Reference Panserat, Plagnes-Juan and Kaushik 43 , Reference Printz, Magnuson and Granner 54 , Reference Panserat, Médale and Breque 56 ). The expression of PEPCK gene was significantly decreased with high-carbohydrate feeding, and the activity of PEPCK enzyme was also decreased to a greater extent, significantly in the FF-5 and YE-5 groups. These results suggest that early carbohydrate-rich dietary intervention could significantly affect the transcription levels of PEPCK gene in adult zebrafish, which can effectively inhibit gluconeogenesis. Taken together, these data suggest that the gluconeogenic pathway is tightly controlled by dietary carbohydrates with early nutritional programming from the polyculture to the external feeding stage.
Rainbow trout exposed to early short-term high-carbohydrate stimuli have been shown to exhibit high expression of AMY gene in the adult stage( Reference Aleström, Holter and Nourizadeh-Lillabadi 19 ). Interestingly, the data obtained for zebrafish in the first-feeding stage in the present study were similar to those obtained for the carnivorous rainbow trout. This demonstrates that the transcription levels of this gene are significantly affected by early high-carbohydrate interventions in these two fish species. The expression levels of SGLT-1 gene can also be affected by the treatment during the early first-feeding period. This will play a very large role in glucose transport( Reference Krogdahl, HEMRE and Mommsen 5 ) in the adult stage when fish are fed high-carbohydrate diets. Further studies are needed to assess the protein content and intestinal tissue morphology to further validate the changes. Accordingly, these data support the idea of an efficient adaptation in dietary carbohydrate digestion and absorption in zebrafish when conditioned by nutritional stimuli during critical periods( Reference Patel and Srinivasan 50 ).
Conclusions
In conclusion, the present study demonstrates that dietary nutritional programming during early sensitive periods induces efficient adaptation and potential capacity to utilise high-carbohydrate diets in adult zebrafish. In the larval stages, high-carbohydrate diets could promote growth from the first-feeding stage to the end of the yolk-sac larval stage. The expression of genes involved in carbohydrate digestion, transport and metabolism was differentially regulated by the early dietary intervention. In the adult stage, growth performance was not affected in any of the groups. As expected, plasma glucose levels exhibited greater degrees of decline when adult fish were fed high-carbohydrate diets. Furthermore, our findings do confirm that the period ranging from the polyculture to the external feeding stage is important for early programming of the high-carbohydrate nutritional adaptation to persist into the adult stage. This newly emerging field of early nutritional programming offers a novel route to improve research and management in areas of applied science, such as aquaculture, fisheries and environmental assessment, with regard to glucose excretion.
Acknowledgements
The authors are grateful to Bin Li, Jiao Li, Yan Xu and Wenjing Zhang for their technical assistance. They also cordially thank Dr Liang Cao for his help in editing the references.
The present study was financially supported by the National Natural Science Foundation of China (31172420 and 31072219), the National Basic Research Program of China (2009CB118702 and 2014CB138601), the Special Fund for Agro-Scientific Research in the Public Interest of China (201003020) and the Fundamental Research Funds for the Central Universities (2010PY010 and 2011PY030) (to X.-F. L). The funders contributed to the design of the study, interpretation of the findings and preparation of the manuscript.
The authors' contributions were as follows: X.-F. L., L. F. and Y. H. designed the study and interpreted the findings; L. F., Y. Z. and X.-Z. G. carried out the laboratory analyses; L.-W. L. and X.-C. Y were responsible for the rearing of fish; T.-L. Y. prepared the feeds; L. F. and Y. Z. analysed the data; L. F., X.-F. L. and Y.-X. T. wrote the manuscript; X.-F. L. and Y. H. were the project leaders.
None of the authors has any conflicts of interest.


