


Introduction
Ice in cold glaciers behaves somewhat differently from ice in temperate glaciers. This is partly because the constant A in Glen's flow law for polycrystalline ice (![]() = (σ|A)n, where
= (σ|A)n, where ![]() is the strain-rate, σ the applied stress, and A and n are constants (Reference Nye,Nye, 1957)) depends upon temperature in such a way that the strain-rate produced by a given stress decreases rapidly below o°C. The rate and total amount of deformation should therefore, in general, be less in cold glaciers than in temperate ones of a similar size, rate of movement, and state of stress, and one would perhaps expect this difference to be reflected in the degree of development of such structures as foliation and crevasses.
is the strain-rate, σ the applied stress, and A and n are constants (Reference Nye,Nye, 1957)) depends upon temperature in such a way that the strain-rate produced by a given stress decreases rapidly below o°C. The rate and total amount of deformation should therefore, in general, be less in cold glaciers than in temperate ones of a similar size, rate of movement, and state of stress, and one would perhaps expect this difference to be reflected in the degree of development of such structures as foliation and crevasses.
Surprisingly few structural studies of cold glaciers have been made; the only detailed work known to the authors was carried out at the margins of the ice cap in the Thule area of north-west Greenland (Reference Merrill,Merrill, 1960; Reference Nobles,Nobles, 1960; Reference Hooke,Hooke, 1970) and the Barnes Ice Cap, Baffin Island (Reference Hooke,Hooke, 1973[a], Reference Hooke,1973[b]; Reference Hudleston,Hudleston, 1976). Complete structural analyses of valley glaciers, such as those carried out for temperate glaciers (e.g. Reference Meier,Meier, 1960; Reference Allen,, Allen,, Kamb,, Meier, and Sharp,Allen and others, 1960), seem to be absent. In an attempt to bridge this gap, detailed structural observations were made on the White Glacier and other glaciers on Axel Heiberg Island in the Canadian Arctic Arehipelago during the summer of 1975, although a good deal of preliminary work had already been done in the years following the initiation of the McGill University Axel Heiberg Island Expedition in 1959 (Reference Muller, and Muller,Muller and others, 1963).
The present work is an attempt to summarize these data and to provide some information concerning deformational processes and the development of structures in cold glaciers. The observations were mainly carried out on the White Glacier, which was already well known from the points of view of thickness (Reference Redpath.Redpath, 1965), mass balance (Reference Adams,Adams, 1966), internal drainage and velocity fluctuations (Reference Maag,Maag, 1969; Reference Muller, and Iken,Muller and Iken, 1973; Reference Iken,Iken, 1974), and englacial temperatures (Reference Muller,Muller, 1976). Large-scale maps of the White Glacier (1 : 10 000 and 1 : 5 000;Reference Muller, and Muller, Muller and others, 1963) were specially prepared for glaciological purposes, as discussed by Haumann (1963), Reference Muller,Muller (1963) and Reference Blachut, and Muller,Blachut and Muller (1966). The maps provide an excellent basis for an analysis of the structures of the glacier, since surface features such as melt-water streams, supraglacial lakes, moraines, and ice structures were accurately plotted. Such detailed maps are especially helpful and almost essential in areas such as Axel Heiberg Island where, owing to the proximity of the Magnetic North Pole, accurate compass readings of the orientation of the structures are difficult to obtain. Some of the stake location measurements made between 1961 and 1970 are suitable for strain analyses, and these are supplemented by measurements made specifically for strain determinations in 1975 and 1976. Most of the detailed structural mapping was carried out during the summer of 1975. In that year, except in isolated areas, no structural measurements were possible in the upper half of the normal ablation area because of exceptionally snowy conditions and a low equilibrium line.
This paper attempts to answer the following questions:
-
(i) How do the main deformational structures: foliations, crevasses, clear-ice layers related to crevasses ("crevasse traces"), debris-rich layers, and folds evolve during flow, and to what extent do they obliterate primary structures (e.g. stratification) and each other?
-
(ii) What characteristics of crystal structure, bubble content, and bubble distribution define the deformational structures?
-
(iii) How do these structures relate to the magnitude and orientation of the principal strain-rates ?
-
(iv) What are the effects of progressive deformation on the final orientation of the structures ?
-
(v) In what way are the structures within cold glaciers similar to, and different from, the structures within temperate glaciers?
General Characteristics of the White Glacier
The White Glacier is a 15 km long, self-contained valley glacier, descending in a number of gentle steps from 1750 m to 80 m above sea level (Figs 1 and 2). Detailed studies were first begun in 1959 by the McGill University Axel Heiberg Island Expedition and have continued to the present day. The accumulation area is complex, but the tongue is fairly straight and narrow, with a number of side glaciers entering it. The mean equilibrium line lies at around 880 m, 8.5 km from the slowly retreating snout. The width of the tongue is fairly constant at 0.8 km to 1.0 km. The lower part of the glacier is deflected by the advancing Thompson Glacier as it enters the main Expedition River valley. Seismic and gravity depth soundings were made near the equilibrium line ("Moraine profile", Fig. 1), in the middle of the ablation area ("Anniversary profile"), and elsewhere (Reference Redpath.Redpath, 1965). Agreement between the two methods, however, was poor; for example, at Moraine profile the maximum depths were 290 m and 370 m respectively, while at Anniversary profile the maximum depths were 280 m and 200 m, respectively.
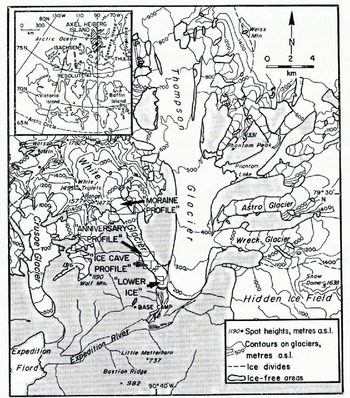
Fig. 1. Location map of the White Glacier. The areas of strain analysis are indicated by the small rectangles.

Fig. 2. View of the middle and upper parts of the White Glacier, 20 August 1975. In the foreground is the crevassed region around Ice Cave profile. Beyond, indicated by AA, is Anniversary profile, and higher (MM) is Moraine profile. Longitudinal foliation can be fantly seen beneath the thin snow cover.
10 m englacial temperatures in the tongue are of the order of — I7°C to — 10°C but, according to deep temperature measurements, probably increase to almost o°C at the bed (Reference Muller,Muller, 1976), indicating, as do velocity fluctuations in relation to melt and rain water (Reference Muller, and Iken,Muller and Iken, 1973; Reference Iken,Iken, 1974), that the glacier slides on its bed. The surface velocity of the glacier has been calculated for some points on a longitudinal profile, and on a number of transverse profiles. For example, at Moraine profile the maximum velocity is of the order of 45 m a-1, and at Anniversary profile 38 m a-1 while at "Lower Ice", 1.2 km from the snout near the middle of the glacier, the velocity is about 12 m a-1.
Structures of the White Glacier
Range of structures
In normal years, stratification is visible only in firn in the areas of accumulation of the main glacier and its tributaries; it is indistinguishable in the true glacier ice of the main tongue, mainly because foliation and fractures develop as a result of the strong deformation occurring where the large, irregular accumulation area feeds the narrow tongue. The main secondary structures (crevasses, crevasse traces, foliations, and folds) are well-developed throughout most of the tongue (Fig. 3). Thin, low-angle layers of debris-rich ice are developed at the snout and, to a lesser degree, at the base of the glacier along the margins.

Fig. 3. Structural map of the White Glacier. The general trend of the structures was taken from large-scale maps based on the 1960 survey, with further detail added from large-scale vertical air photographs taken in 1960 (upper part ) and 1967(lower), while the orientations of the structures date from 1975.The upper diagram illustrates the crevasses and crevasse traces (shear planes near the snout) ; the lower longitudinal foliation. Orientation data of the main set of crevasse traces and of the longitudinal foliation on transverse profile are shown in the upper Schmidt equal-area projections. Below, these structures are contoured separately using the procedure described by Reference Phillips,Phillips (1971).
Crevasses
The tongue of the White Glacier displays numerous sets of transverse, chevron, and splaying crevasses (cf. Reference Meier,Meier, 1960, p. 56-57) which are best developed in the steeper parts of the glacier (Fig. 3). In a few areas the ice surface resembles a gently graded ice fall. Near the margins, chevron crevasses, which initially are formed at angles of about 40-60° to the sides, are rotated by differential movement to make angles of nearly 90°, and become closed. New sets of crevasses then develop, and these make angles of anything between 300 and 900 with the traces of the earlier crevasses. In some parts of the middle of the glacier, longitudinal crevasses intersect earlier transverse crevasses (e.g. near profile A, Fig. 3), but the latter are better developed as the glacier spreads out after emerging from its narrow valley onto the Expedition River plain.
Crevasse traces
Numerous coarse, clear-ice layers, which are closely related to crevasses, are extensively developed throughout the tongue of the While Glacier (Fig. 3) and also seem to be one of the most common structures in sub-polar glaciers. When viewed from above, they appear as fairly continuous traces across the glacier surface. Initially they are parallel to open crevasses but become increasingly areuate down-glacier. They can frequently be followed throughout the length of a glacier, their curvature increasing as a result of flow. Those clear-ice layers which crop out at the glacier surface as thin bands, and which are clearly related to crevasses, are for convenience referred to as "crevasse traces". They can be followed for several tens of metres across the glacier surface and are normally only a few centimetres thick. Exceptionally, crevasse traces may be a metre thick. Individual crevasse traces form between crevasses, or they can extend directly into the "V" of a crevasse.
Thin sections taken through typical crevasse traces reveal that the boundary between the coarse clear and coarse bubbly ice is defined solely by a concentration of air bubbles, either on a planar surface (Fig. 4(a)) or in a zone several millimetres wide (Fig. 4(b)), parallel to the crevasse trace. In all cases, the crystals within the clear layer are either contiguous to those in the bubbly layer, or possess an identical orientation. In the wider crevasse traces it is common to find bubble planes or lineations in the centre of the layer (Fig. 4(b)).

Fig. 4. Crystal structure and bubble distribution as observed in thin sections between crossed polaroids (drawn from photographs) : (a) horizontal section through a crevasse trace and foliation defined by elongation of crystals, 300 m from the north-east margin near profile c; (b) vertical section through crevasse trace in mid-glacier near profile F; (C) horizontal section through foliation, defined by strong elongation of crystals and concentration of bubbles,50 m from the north-east margin near profile c.
Numerous sets of crevasse traces are visible at the surface of the White Glacier (Fig. 3 , upper map) but, although the pattern becomes extremely complex, age relationships are fairly easily determined in the field (Fig. 5). In the upper part of the ablation area of the main flow unit, two prominent sets of crevasse traces are clearly visible in aerial photographs, both of which become strongly areuate as a result of differential flow. (These remained snow covered during 1975 and were not studied.) A particularly prominent set of crevasse traces develops in a region of transverse crevassing where the glacier surface begins to steepen after a long, gently graded section. These were examined in more detail and are illustrated by the heavier dashed lines in Figure 3 , beginning a little above profile A. The orientations of the crevasse traces were measured on several transverse profiles to determine the effect of flow on their originally vertical transverse orientation. The poles to the layers are plotted on lower hemisphere, equal-area projections, and contoured point diagrams are given to facilitate interpretation (Fig. 3). Ideally, each contoured diagram should contain many more points to be statistically reliable; nevertheless, they do give a general impression of the true nature of the structure as they stand. Initially (profile A), the poles to the crevasse traces plot as a single strong maximum, indicating that they lie normal to the direction of movement. Differential flow causes them to be deformed into an areuate structure which becomes more accentuated down-glacier; this is reflected in the increasing dispersion of poles in the equal-area diagrams from the single strong maximum into a more diffuse girdle distribution (profiles B to G). In this part of the glacier the crevasse traces remain vertical, but as they approach the snout they tend to develop a steep up-glacier dip near the apices of the ares. In the lower 0.5 km of the glacier the upward dip decreases rapidly, although regularly (profile H). Towards the snout a clear parallelism exists with low-angle debris-rich layers, especially in the last 0.3 km (profile 1) and around the base of the glacier at the snout. The final orientation of the layers is a sub-horizontal one, that is, parallel to the bed. It is clear that the surface traces of these layers lengthen considerably down-glacier (Fig. 3 , upper map). If we consider that the longitudinal foliation is parallel to flow lines through the glacier (see Discussion, p. 58), we can gain a rough idea of the increase in length of different segments of crevasse traces. Thus, from their point of origin to profile E, a segment in the middle of the glacier increases in length by about 60%, while at the north-east margin the increase is of the order of 500%. Thereafter, the increase is even greater because of lateral spreading of ice onto the Expedition River valley floor. In order to compensate for the increase in length, the layers must become thinner and/or their vertical extents must decrease, depending on the sign of the vertical strain. The former is reflected both in the absence of very thick layers at the snout as compared with their presence higher up-glacier, and in the difficulty of distinguishing excessively thinned layers near the margins.

Fig. 5. Structural relations near the right margin of the White Glacier between profiles C and D. Striped veins represent longitudinal foliation, not very pronounced here; the dotted veins represent crevasse traces of several different sets. Note the small displacements offsetting the main set of crevasse traces. The black areas are cryoconite holes containing debris.
Sometimes, crevasse traces provide evidence of strike-slip faulting. Normally, the displacements are less than a metre, but large displacements, accompanied by local bending of earlier structures, occur in the steep tributary glaciers entering the White Glacier from the north-north-east, and also where the ice begins to spread out near the snout.
Debris-rich layers
Debris-rich layers occur in the terminal and marginal areas of glaciers and, apparently, are better developed in cold glaciers than in temperate ones (Reference Boulton,Boulton, 1970). Often the debris is thinly scattered throughout a clear-ice layer, but occasionally there may be a high concentration of debris with only interstitial ice between. However, a surface of discontinuity commonly separates the dirty ice from the clean ice; such discrete surfaces have long been regarded as shear or thrust planes along which debris from the bed is entrained (e.g. Reference Bishop,Bishop, 1957; Reference Swinzow,Swinzow, 1962;Reference Souchez,Souchez, 1967). However, some authors have criticized the shear hypothesis, believing it to be unsound on mechanical grounds (e.g. Reference Weertman,Weertman, 1961; Reference Hooke,Hooke, 1968), thus at this stage a non-genetic term is preferable until the exact mechanism has been established (personal communication from R. L. Hooke, 1976).
In the White Glacier, debris-rich layers are almost invariably parallel to older structures, such as crevasse traces and foliation. They are particularly well developed at the snout of the glacier where, usually, they are separated from the adjacent clean ice by discrete planar surfaces. These features first appear about 200 m from the snout, where the up-glacier dip of the crevasse traces has decreased to 30-40°. Ice-cored moraines, often containing a considerable amount of coarse material, are formed where the layers are exposed at the surface (Fig. 6). From the place where the layers appear to the snout, the dip of the layers decreases regularly until, at the base of the glacier, they are approximately parallel to the glacier bed (profile 1, Fig. 3). The amount of englacial debris increases considerably in this last part of the glacier. The planar surfaces sometimes have an important influence on the internal drainage; on one occasion a vigorous muddy discharge of water occurred at the glacier surface, possibly having its origin at the bed (Reference Muller, and Iken,Muller and Iken, 1973). Along the margins, in the bottom, few metres of the glacier, debris-rich layers have developed parallel to longitudinal foliation where the latter has a low to medium dip towards the centre, but only rarely is the material involved larger than gravel size.

Fig. 6. View along strike of debris-rich layers, formed parallel to crevasse traces, and an ice-cored moraine, near the snout of the White Glacier.
There is not always a sharp dividing line between debris-rich layers and other structures. One often finds that fine, scattered material first appears in coarse, clear-ice layers, gradually increasing in amount and size towards the bed or towards the snout.
A few examples of low-angle (10-15°) planar surfaces, resembling so-called shear planes related to other structures, were observed about 0.5 km from the snout. Also, similar features are visible in the aerial photographs of one of the western tributary glaciers. Neither, however, were apparently associated with debris.
Foliation
Foliation in glacier ice is a structure of discontinuous, intercalated layers produced by flow or deformation. Individual layers are up to 0.1 m thick and are normally only a few metres long, although exceptionally they can be followed for up to about 100 m (Fig. 7). Foliation consists of three types of ice classified according to texture, namely, coarse bubbly, coarse clear, and fine ice (Reference Allen,, Allen,, Kamb,, Meier, and Sharp,Allen and others, 1960).

Fig. 7. Typical longitudinal foliation in the White Glacier. View down-glacier from near the middle of profile B.
A near-vertical longitudinal foliation is developed throughout most of the tongue of the White Glacier (Fig. 3 , lower map). It is defined by elongation of ice crystals and variations in bubble content, rather than by discrete planar discontinuities (Fig. 4c). In the White Glacier, fine-grained ice was rarely observed. Coarse bubbly ice (irregularly-shaped crystals up to 50 mm long) is the most abundant type, this being intercalated with thin layers of similarly-shaped crystals of coarse clear ice (Fig. 5). However, concentrations of bubbles arranged in zones parallel to the foliation are not controlled by the crystal boundaries. The foliation is remarkable for its intensity and regularity of development (Fig. 7), and it survives without serious disruption a passage through numerous crevasse fields. It is as well developed in the centre of the glacier as at the margins, except that crystal elongation is not quite so pronounced in the centre (cf. Figs 4a and 4c), but the structure fades away towards the snout. Near the north-west margin, it is folded about a vertical axial plane while, in the steep eastern tributaries, it is locally folded about an axial plane parallel to the surface in association with shear displacements that have occurred during crevassing. In some marginal cliff areas the dip of the foliation decreases rapidly towards the margin, occasionally to 15° towards the centre, producing a fan-shaped structure when seen in cross-section.
The orientation of longitudinal foliation was measured on several transverse profiles in the glacier tongue. Poles to the foliation are plotted on the upper equal-area projections of Figure 3 and are contoured on the lower ones. These clearly illustrate the constant orientation and near-vertical dip of the foliation and its alignment parallel to the margins. On only one profile (F) is the orientation irregular, and this is a result of local displacements and folding connected with the main set of crevasse traces where the glacier spreads out into the l'expédition River valley. The fact that this is a phenomenon which occurs only near to the surface is illustrated once more by the regularity of the foliation in the succeeding profile (G). Through-out most of the tongue below profile A, the foliation is cut by crevasse traces and thus originates above this position.
Folds
Large-scale folding of moraines does not take place in the White Glacier, although it may be observed in many neighbouring glaciers. However, folds ranging in amplitude from 0. 1 to 100 m are present. The larger ones are best observed in the flow units derived from the tributary glaciers after they have entered the main valley (Fig. 8). Their fold axes generally plunge steeply up-glacier, and so they probably represent the deformation of near-vertical transverse crevasse traces as a result of differential flow. Some isolated folds in the longitudinal foliation, observed in aerial photographs (plotted in Fig. 3), may have a different origin; R. L, Hooke has suggested (personal communication, 1976) that the bowl-shaped geometry of the main accumulation basin, together with the higher expected flow rates in the centre of the basin and the rapid narrowing down-glacier may result in isoclinal folding of the primary stratification. Unfortunately, it was not possible to trace these folded layers to their source because of the snow cover, so, many aspects of large-scale folding in the White Glacier have not been elucidated. Large-scale folding of foliation also occurs near the snout where the glacier leaves the confines of the narrow valley and strong longitudinal compression is expected (Fig. 3 , lower map). An interesting area of folding in the snout occurs in the ice cliff adjacent to Thomson Glacier. This is a fine example of an interference pattern developing as a result of two successive phases of folding (see, for example, Reference Ramsay,Ramsay, 1967, p. 520-37). The later folding seems to have resulted from strong up-warping of gently dipping crevasse traces and debris-rich layers in ice subjected to intense compression in the region where the two glaciers are in contact. In a curious zone in the core of the fold, the layers are more discontinuous and more intensely folded on a small scale and are associated with an incipient axial-plane foliation.

Fig. 8. Down-glacier view of large-scale folding of foliation in the south-western marginal area near profile E. The fold axis plunges steeply up-glacier.
Isolated isoclinal and similar minor folds with axial planes parallel to the penetrative foliation were observed in the lower part of the glacier. Minor parasitic folds were also observed in some large folds. There was evidence of more complex minor folding in stream channels in the area above profile A, but this could not be studied in detail in 1975.
Relation of Strain and Movement to Structures
Selection of study areas
Many of the strain determinations described here were made using data not specifically obtained for the purpose. Although a large amount of velocity data is available for the period 1960-70, determination of the principal strain-rates was possible only for a few years in restricted areas. The most complete results come from the Anniversary profile area (Fig. 1) where strain-rates on a complete cross-profile are known and can be compared with longitudinal foliation, crevasse traces, and a few crevasses. Some of these results have been discussed briefly elsewhere (Reference Hambrey,Hambrey, 1977). Data are also available from Ice Cave profile, a marginal area of complex crevassing, and from Lower Ice where some longitudinal crevasses are generated. In 1975 strain determinations were made specifically for comparison with the evolution of foliation along a single flow line, beginning at the point where a tributary glacier enters the main flow unit (discussed briefly in Reference Hambrey,Hambrey, 1977). Between 1975 and 1976, strain-rates were determined on a complete transverse profile near the equilibrium line (Moraine profile).
Determination of principal strain-rates
There are two methods commonly used for determining principal strain-rates in glaciers: the velocity-gradient method for large-scale measurements (e.g. Reference Meier,Meier, 1960; Reference Meier,, Meier,, Kamb,, Allen, and Sharp,Meier and others, 1974), and a method involving the use of an array of five stakes for relatively small-scale measurements (Reference Nye,Nye, 1959). In the present study, the deformation of triangular arrays of stakes was considered, a method which is less subjective than Meier's and a little less time-consuming than Nye's. As in other studies, the assumption of homogeneous strain within the strain nets has to be made. Deformation can be expressed in several different ways, here, we consider quadratic elongation rates λ and logarithmic strain-rates €, as defined by the following equations:
and
where Δt is the time interval, and li and lo are the final and initial lengths respectively (Table I).
Table I. Surface-Parallel Principal Quadratic Elongation Rates, Logarithmic Strain-Rates, Shear Strain-Rates and Percentage Change in Surface Area of Strain Triangles, White Glacier

Two methods of measurement were used on the White Glacier. For the larger triangles, the stakes were surveyed with theodolites from fixed points on bedrock, and their co-ordinate positions with respect to a local grid system were determined. To obtain deformation rates the quadratic elongation rates and angular shear strain-rates (in a-1) of the triangle sides were calculated. The principal elongation rates (λ1 and λ2) and their orientations relative to the sides of the deformed triangles in a plane parallel to the ice surface were computed by means of the Mohr circle construction (here solved mathematically). Azimuths of the triangle sides, and therefore of the principal axes, were easily obtained from the stake co-ordinates. Although it is necessary to consider only two of the sides, the third was also used in the calculations for the purpose of cross-checking. The method is described in detail by Reference Ramsay,Ramsay ( 1967,p.80-81) .Principal logarithmic strain-rates (![]() 1and
1and ![]() 2) were calculated according to the formula
2) were calculated according to the formula
obtained from relations given by Reference Ramsay,Ramsay (p. 52-53) because, with the small amounts of deformation in one year compared with geological strains over longer periods, they give a clearer indication of deformation when plotted diagrammatically. Surveying errors give rise to some inaccuracies, but at their worst they are no greater than ![]() = o.oo2 a-1. Also obtained from the principal quadratic elongation rates are the rates of deformation expressed as percentage change in surface area per year, i.e. (λ1·λ2)1/2-1 Reference Ramsay,(Ramsay, 1967, p. 65, equation 3-27). In glaciological literature frequent reference has been made to "extending" and "compressive" flow (Reference Nye,Nye, 1952), but this relates only to changes in a longitudinal direction. A more complete picture of deformation is given by considering areal change. Areal increase is indicated by positive values which, assuming that ice is incompressible, indicate glacier thinning, conversely, negative values indicate thickening.
= o.oo2 a-1. Also obtained from the principal quadratic elongation rates are the rates of deformation expressed as percentage change in surface area per year, i.e. (λ1·λ2)1/2-1 Reference Ramsay,(Ramsay, 1967, p. 65, equation 3-27). In glaciological literature frequent reference has been made to "extending" and "compressive" flow (Reference Nye,Nye, 1952), but this relates only to changes in a longitudinal direction. A more complete picture of deformation is given by considering areal change. Areal increase is indicated by positive values which, assuming that ice is incompressible, indicate glacier thinning, conversely, negative values indicate thickening.
For the small triangles (150-57) the lengths of the sides (15-20 m) were measured before and after deformation using a 200 ft (61 m) cloth tape. As the time interval was short (of the order of 30 d), each inter-stake distance was measured three times in perfectly windless conditions, or more often if readings deviated by more than about 0.25 in (7 mm). As a suitable balance was unavailable, arbitrary positions on the tape were used and the distances were calculated afterwards to avoid bias. Reproducible readings could be obtained because the stakes froze rapidly and rigidly into the cold ice. Principal quadratic elongations and logarithmic strains for the time interval involved were obtained using the same procedure as that described above. Deformation rates were obtained by adjusting these values to one year. If the strains are rotational (Reference Ramsay,Ramsay, 1967, p. 60), as is likely in the present case, the true orientation of the principal strain-rates after one year's deformation may be different from that obtained for the 30 d period. The difference, however, is not likely to be greater than several degrees. This difficulty does not apply to the surveyed triangles; extrapolation of the corners to one year along flow lines takes rotation into account.
Deformation on transverse profiles
Two transverse profiles across the White Glacier were studied, using theodolites to fix the positions of the stakes, the deformation period for the triangles (Figs 9a and 10a) being of the order of one year except in the case of triangle 200 (dates given in Table I).

Fig. 9. Relation between structures and principal logarithmic strain-rates in the Moraine profile region, (a) Key to strain triangles (data in Table I), (b) velocity vectors and percentage change in surface area per year, (c) structures and principal strain-rates in a-1.

Fig. 10. Relation between structures and principal logarithmic strain-rates at Anniversary profile. (a) Key to strain triangles, (b) velocity vectors and percentage change in surface area per year, (c) foliation, crevasses, the main set of crevasses and principal strain-rates in a-1.
The upper profile ("Moraine", Fig. 9) is located a short distance below the region where the ice from the accumulation area enters the narrow valley. Crevasses are extensively developed in the WSW half of the profile while longitudinal foliation is in evidence only in the marginal zones. The strain distribution is fairly complex. On the ENE part of the profile the strain-rate tensors are somewhat inconsistent in orientation and magnitude (Fig. 9). The maximum strain-rates (![]() 1= 0.126a-1,
1= 0.126a-1, ![]() 2=-o.o6oa-1) occur, as expected, nearest the margin with €1forming an angle of about 30° with the foliation. Towards the centre the strain-rates decrease irregularly as far as a major stream channel in triangle 105. This channel appears to mark approximately the boundary between a flow unit originating in a well-defined basin in the south-east part of the accumulation area and the much larger flow unit coming from the remainder of the accumulation area. The remaining two-thirds of the profile illustrates strain-rate tensor orientations typical of a complete section across a valley glacier (cf. Reference Meier,Meier, 1960; Reference Meier,, Meier,, Kamb,, Allen, and Sharp,Meier and others, 1974), with
2=-o.o6oa-1) occur, as expected, nearest the margin with €1forming an angle of about 30° with the foliation. Towards the centre the strain-rates decrease irregularly as far as a major stream channel in triangle 105. This channel appears to mark approximately the boundary between a flow unit originating in a well-defined basin in the south-east part of the accumulation area and the much larger flow unit coming from the remainder of the accumulation area. The remaining two-thirds of the profile illustrates strain-rate tensor orientations typical of a complete section across a valley glacier (cf. Reference Meier,Meier, 1960; Reference Meier,, Meier,, Kamb,, Allen, and Sharp,Meier and others, 1974), with ![]() 1forming an angle of 20-300 with the centre line at the ENE margin of the glacier, finally becoming orientated at an angle of about 250 with the WSW margin. The magnitudes of
1forming an angle of 20-300 with the centre line at the ENE margin of the glacier, finally becoming orientated at an angle of about 250 with the WSW margin. The magnitudes of ![]() 1 however, are relatively high even in the centre of this flow unit, and this is reflected in the degree of crevasse development. One interesting aspect of the relationship between the strain-tensor orientations and the crevasses is that, although near the WSW margin
1 however, are relatively high even in the centre of this flow unit, and this is reflected in the degree of crevasse development. One interesting aspect of the relationship between the strain-tensor orientations and the crevasses is that, although near the WSW margin ![]() 1is normal to the crevasses (which is to be expected), towards the centre of the glacier this is increasingly not the case.
1is normal to the crevasses (which is to be expected), towards the centre of the glacier this is increasingly not the case.
The velocity distribution on the Moraine profile is asymmetrical, increasing more rapidly to the centre from the ENE margin than from the WSW margin (Fig. 9b). On the other hand, the vectors have a consistent orientation except in the centre where they diverge to some extent as the ice approaches a steepening slope. Near the margins the vectors are parallel to the longitudinal foliation.
The distribution of the rates of change in surface area is, like the distribution of strain-rates, rather complex (Fig. 9b). Strong increase in area (positive) occurs in mid-glacier, both in the crevassed area and also near the ENE margin where there are no crevasses (Table I). In between these zones of increasing area, crevasses are absent (triangles 105 and 106); this is the area of maximum area decrease.
The lower transverse profile ("Anniversary", Fig. 10) is situated below a gentle step in the middle of the ablation area (Fig. 2). The orientation of principal strain-rates here resembles that in other glaciers (Reference Meier,Meier, 1960; Reference Meier,, Meier,, Kamb,, Allen, and Sharp,Meier and others, 1974). In the marginal zones, the principal strain-rate axes make angles of about 450 with the sides (Fig. 10c) and with the longitudinal foliation. Thus, the foliation is approximately parallel to a line of maximum shear strain-rate.The axes of maximum extension gradually swing around to become transverse to the flow in the centre of the glacier, and thus have no constant relationship with the foliation. However, the foliation is everywhere approximately parallel to the velocity vectors (Fig. 10b). There seems to be a general relationship between strain and the main set of crevasse traces. However, the fact that these structures are sub-parallel to the line of maximum extension for much of the width of the glacier is probably fortuitous and simply the result of rotation during flow. The few new crevasses in this area are approximately normal to the maximum extension but other crevasses, presumably rotated, are not so related.
The rates of change of surface area on Anniversary profile are small (Table I). All values except one show a reduction in surface area, as would be expected from the concave shape of the ice surface.
Deformation on a single flow line
Four small, approximately equilateral, strain triangles with side lengths 15-20 m were established astride the medial moraine between a tributary glacier and the main flow unit (triangles 150-58, below Moraine camp, Fig. 9). This area was selected because, as a result of the combination of two flow units, it was the most likely place for a vertical longitudinal foliation to be produced.The possibility that this foliation formed higher up the glacier is discounted because it has a distinctive appearance as compared with marginal foliation upstream, and also because it is confined to a narrow zone, only a few metres wide, at the exact boundary of the two flow units as defined by a medial moraine. It was established that, at first (triangles 150 and 151), foliation was developing at an angle of 25-35° to ![]() 1. Small extensions in all surface directions were apparent further down the moraine (triangle 152). In the lowest position (triangle 153) foliation was orientated at approximately 45° to the principal strain-rate axes, that is, sub-parallel to a line of maximum shearing strain-rate. A study of the principal strain-rates for the adjacent triangles revealed that the values across the moraine were twice those on either side, although their orientations were similar (Fig. 11), indicating a zone of more intense shear of the order of 5 m wide. The only crevasses occurring in areas studied along this flow line are associated with the first triangle where they are small and form normal to the maximum extension.
1. Small extensions in all surface directions were apparent further down the moraine (triangle 152). In the lowest position (triangle 153) foliation was orientated at approximately 45° to the principal strain-rate axes, that is, sub-parallel to a line of maximum shearing strain-rate. A study of the principal strain-rates for the adjacent triangles revealed that the values across the moraine were twice those on either side, although their orientations were similar (Fig. 11), indicating a zone of more intense shear of the order of 5 m wide. The only crevasses occurring in areas studied along this flow line are associated with the first triangle where they are small and form normal to the maximum extension.
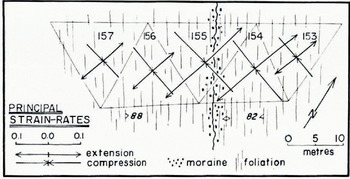
Fig. 11. Logarithmic strain-rates in a-1 across and on either side of a medial moraine (for location see triangle 155 in Figure 9) in relation to longitudinal foliation.
The magnitude of the principal strain-rates ![]() 1 and
1 and ![]() 2 at these relatively small scales and time intervals are much higher than those recorded elsewhere on the White Glacier (Table I). A maximum compressive strain-rate ё2 of —0.42 a-1 and a maximum extending strain-rate
2 at these relatively small scales and time intervals are much higher than those recorded elsewhere on the White Glacier (Table I). A maximum compressive strain-rate ё2 of —0.42 a-1 and a maximum extending strain-rate ![]() 1 of 0.14 a-1, associated with the early contact of the steep tributary glacier and the main flow unit, are high even when compared with the results from temperate glaciers. However, if the lowest triangles (Fig. 11) are representative, this high strain occurs in a relatively narrow zone. The areal changes (Table I) indicate that the glacier must be thickening rapidly as the two flow units combine.
1 of 0.14 a-1, associated with the early contact of the steep tributary glacier and the main flow unit, are high even when compared with the results from temperate glaciers. However, if the lowest triangles (Fig. 11) are representative, this high strain occurs in a relatively narrow zone. The areal changes (Table I) indicate that the glacier must be thickening rapidly as the two flow units combine.
Deformation in a heavily crevassed marginal region
Detailed velocity measurements were carried out in a small, heavily crevassed region at the top of a small ice fall at the right-hand margin of the glacier where the bedrock topography is rather irregular. This area is known as "Ice Cave profile" (Fig. 12). The distribution of stakes was not ideal for a strain analysis, as can be seen from the shape of the triangles (Fig. 12a), and the assumption of homogeneous strain may not hold for some triangles. The widely varying orientations of the principal strain-rate axes are noticeable, and are reflected in the irregular shape and distribution of the crevasses. Many crevasses are not standing normal to the principal extension, probably because they have rotated and because strain measurements at this relatively large scale cannot be related to individual crevasses. The magnitudes of these strain-rates are approximately of the same order as those recorded near the margins of the glacier at Anniversary and Moraine profiles (Table I), with a maximum extension of 0.12 a-1 and a maximum compression of 0.16 a1. The fairly small strain-rates recorded in some areas may be due to local stress reductions following fracture. This region is undergoing large surface areal changes (Fig. 12b), reaching a maximum positive value in the more heavily crevassed part about 150 m from the margin. A large decrease in surface area occurs in a marginal zone, hence the lack of crevasses here. The velocity vectors are also irregularly orientated (Fig. 12b), but they show a strong tendency to form a high angle to the valley side near the margin compared with an orientation approximately parallel to the valley side nearer the centre of the glacier. This atypical behaviour is probably due to irregularities in the underlying bedrock. Neither the principal strain-rate axes nor the velocity vectors show any clear relationship to other structures.

Fig. 12. Relation between structures and principal logarithmic strain-rates at Ice Cave profile. (a) Key to strain triangles. (b) velocity vectors and percentage change in surface area per year, (c) foliation, crevasses, the main set of crevasse traces and principal strain-rates in a-1.
Deformation in an area of longitudinal crevasses
Strain-rate determinations were possible for an area of longitudinal, slightly splaying crevasses, developed at Lower Ice, 1.2 km from the snout in mid-glacier (Fig. 13). The maximum extensions here are approximately normal to the crevasses, but the magnitudes of both maximum compression and extension are small, being comparable with the central part of Anniversary profile. There is no relationship between the strain-rate axes and other structures. Surface areal changes naturally are very small (Table I).

Fig. 13. Relation between structures and principal logarithmic strain-rates at Lower Ice. (a) Key to strain triangles, (b) velocity vectors and percentage change in surface area per year, (c) crevasses, foliation, the main set of crevasse traces and principal strain-rates in a-1.
Discussion
Effect of flow on primary structures
Stratification, which is the most important primary structure, is generally well-developed in temperate corrie glaciers (Reference Grove, and formerly Clark,Grove, 1960; Reference Hambrey,Hambrey, 1975), and sometimes also in temperate valley glaciers which are little crevassed (Reference Meier,Meier, 1960). However, in many valley glaciers, particularly if they are heavily crevassed, stratification is almost completely destroyed and may not be recognizable at all in the tongue. No recognizable stratification was observed in the tongue of the White Glacier although, as mentioned previously (p. 49), the longitudinal foliation may have resulted from the isoclinal folding of this primary structure. By comparison, stratification can be seen clearly in aerial photographs of the neighbouring Thompson Glacier where it probably has a low dip, although in the field the structure is too diffuse to be distinguished. Stratification is most clearly visible in sub-polar ice caps and glaciers of low activity (Reference Post, and LaChapelle,Post and LaChapelle, 1971, Fig. 7). Thus, whether a glacier is "cold" or not is unimportant in the question of the survival of stratification: it is the degree of deformation which is the deciding factor.
Fracture of ice and the development of crevasse traces
Many crevasses in the White Glacier form perpendicular to the direction of maximum extending strain-rate. Some crevasses, however, stand at an angle to the direction of maximum extension as a result of rotation or because of inhomogeneous strain within the strain triangles. In earlier studies the "critical regional (tensile) strain-rate" required for fracture has been estimated. For example, in temperate glaciers, ![]() 1 values of 0.03 a-1 (Blue Glacier, Washington; Reference Meier,, Meier,, Kamb,, Allen, and Sharp,Meier and others, 1974) and 0.01 a-1 (Kaskawulsh Glacier, Yukon; Reference Holdsworth,Holdsworth, 1969) have been obtained, compared with 0.01 a-1(Blue Ice Valley, Greenland; Reference Meier,, Meier,, Conel,, Hoerni,, Melbourne,, Pings, and Walker,Meier and others, 1957) and O.002 a-1 (Meserve Glacier, Antarctica; Reference Holdsworth,Holdsworth, 1969) in cold glaciers. The smallest regional extending strain-rates associated with new crevasses in the White Glacier are 0.004 a-1 (cf. Table I for values of
1 values of 0.03 a-1 (Blue Glacier, Washington; Reference Meier,, Meier,, Kamb,, Allen, and Sharp,Meier and others, 1974) and 0.01 a-1 (Kaskawulsh Glacier, Yukon; Reference Holdsworth,Holdsworth, 1969) have been obtained, compared with 0.01 a-1(Blue Ice Valley, Greenland; Reference Meier,, Meier,, Conel,, Hoerni,, Melbourne,, Pings, and Walker,Meier and others, 1957) and O.002 a-1 (Meserve Glacier, Antarctica; Reference Holdsworth,Holdsworth, 1969) in cold glaciers. The smallest regional extending strain-rates associated with new crevasses in the White Glacier are 0.004 a-1 (cf. Table I for values of ![]() 1, associated with crevasse formation), which are of the same order of magnitude as the Meserve Glacier results. On the other hand, there are some parts of the White Glacier where
1, associated with crevasse formation), which are of the same order of magnitude as the Meserve Glacier results. On the other hand, there are some parts of the White Glacier where ![]() 1, is as high as 0.16 a-1 and crevasses are completely absent. Clearly, no simple relationship exists between
1, is as high as 0.16 a-1 and crevasses are completely absent. Clearly, no simple relationship exists between ![]() 1, and fracture. For example, the other principal strain-rate (
1, and fracture. For example, the other principal strain-rate (![]() ) may also be important. Reference Kehle,Kehle (1964) has published some results concerning crevasse formation in the Ross Ice Shelf, Antarctica which have some bearing on this problem. Assuming that the stresses were proportional to the measured strain-rates, he plotted graphically the principal horizontal stresses for crevassing and non-crevassing areas. Various stress states were associated with fracture, but the results showed that fracture could be defined according to a two-dimensional yield ellipse (see also Reference Ramsay,Ramsay, 1967, p. 318-19). A similar exercise was performed for the White Glacier, but no relationship whatsoever was apparent. The measurements on the Ross Ice Shelf were presumably not influenced to any extent by valley sides as would be the case in the White Glacier, which may introduce other variables which are impossible to quantify. Temperature changes may also lead to the initiation of fractures (e.g. Reference Holdsworth,Holdsworth, 1969), while structural inhomogeneides in the ice may also affect the strain-rates involved in crevasse formation.
) may also be important. Reference Kehle,Kehle (1964) has published some results concerning crevasse formation in the Ross Ice Shelf, Antarctica which have some bearing on this problem. Assuming that the stresses were proportional to the measured strain-rates, he plotted graphically the principal horizontal stresses for crevassing and non-crevassing areas. Various stress states were associated with fracture, but the results showed that fracture could be defined according to a two-dimensional yield ellipse (see also Reference Ramsay,Ramsay, 1967, p. 318-19). A similar exercise was performed for the White Glacier, but no relationship whatsoever was apparent. The measurements on the Ross Ice Shelf were presumably not influenced to any extent by valley sides as would be the case in the White Glacier, which may introduce other variables which are impossible to quantify. Temperature changes may also lead to the initiation of fractures (e.g. Reference Holdsworth,Holdsworth, 1969), while structural inhomogeneides in the ice may also affect the strain-rates involved in crevasse formation.
The problem of fracture depth in glaciers has still not been satisfactorily explained. In temperate glaciers, measured depths of crevasses do not exceed 30 m or so (Reference Holdsworth,Holdsworth, 1969, P· 117), unless they are filled with water (Reference Weertman,Weertman, 1973; Reference Smith,Smith, 1976), but the persistence of crevasse traces below crevassed areas implies that fracture may occur to much greater depths, although without necessarily producing an open crack (Reference Hambrey,Hambrey, 1976[b]). In cold ice it is known that crevasses can be much deeper than 30 m. The extent to which crevasse traces persist in the White Glacier indicates that fracture may well occur down to the bedrock. For instance, we can follow the main set of crevasse traces continuously from their source area to the base of the glacier at the snout (Fig. 3), therefore this snout ice should have originated high in the accumulation area and remained close to the bottom of the glacier, assuming that the flow-line theory in glaciers is correct. The close association of clear-ice layers with open crevasses leaves little doubt that these features result from fracture in some way. It is quite likely that they can form between crevasses as Reference Holdsworth,Holdsworth (1969), for example, found that crevasse formation does not always prevent continued extension in the inter-crevasse blocks. However, the mechanics of formation of these clear-ice layers are not known. Two possible mechanisms are suggested, but until more is known about ice and fracture and the accompanying crystallographic changes in detail, it is not possible to say which one is the more likely.
It is physically possible for water-filled crevasses to reach bedrock (Reference Weertman,Weertman, 1973; Reference Smith,Smith, 1976), while freezing of the water in these cracks would lead to the formation of clear-ice layers. However, few freshly-formed crevasses in the White Glacier were seen to be filled with water in 1975, and it is doubtful whether they are so filled for any length of time. On the other hand, once a fracture has formed and captured a supraglacial stream (of which there are many on the White Glacier), the crevasse may fill up rapidly and simultaneously propagate downwards. Evidence in support of this is the fact that moulins, often extending to bedrock, form within a few days and are quickly abandoned as a new crevasse forms up-glacier (personal communication from A. Iken, 1977). As the stream is abandoned the water in the crevasse will quickly freeze, leaving a thin layer of clear ice. However, the crystal structure of the clear-ice layers (Figs 4a and 4b) is not what one would expect if freezing of water had occurred, although it may be that recrystallization has taken place subsequently and obliterated the earlier crystal structure.
The second mechanism is based on ideas concerning the development of "tectonic veins" in deformed rocks (Reference Durney, and Ramsay,Durney and Ramsay, 1973). A remarkable similarity exists between the crystal shapes, orientation and inclusions found in crevasse traces and those of quartz veins observed, for example, in old red sandstone from Pembrokeshire in Wales (personal communication from J. G. Reference Ramsay,Ramsay, 1977). If we extend the mechanism postulated by Ramsay, then clear-ice layers may develop throughout the depth of a glacier. Reference Gallagher,, Gallagher,, Friedman,, Handin and Sowers,Gallagher and others (1974) have shown that tensional microfractures often occur in crystalline aggregates within the individual grains, and that sometimes fractures in adjacent crystals tend to join together in chains. One can perhaps envisage these chains extending downwards from the ice surface, one crystal to another, forming a continuous fracture. Under "tension" the walls of the fracture may separate, whilst, at the same rate, water may migrate into this zone and crystallize as clear ice with the same orientation as the fractured crystals (Figs 4a and 4b). The fracture is represented by a plane containing air bubbles, and corresponds to planar concentrations of inclusions in the sandstone. Continued stretching normal to the newly-formed layer may result in the development of another fracture, which again is delimited by air bubbles. The fact that the clear-ice layers sometimes contain two or more bubble planes indicates that fracture can occur repeatedly (Figs 4a and 4b). The source of the water necessary to form the clear ice may be explained if one considers the stress field. As the crack forms normal to the principal tensile stress, so the principal compressive stress will act parallel to the crack. The latter may enable pressure melting to occur at appropriately orientated crystal boundaries. Water then may migrate through veins at 3-grain intersections in the manner suggested by Reference Shreve,Shreve (1972) and Reference Nye, and Frank,Nye and Frank (1973) for ice at the melting point. The crucial question with regard to the White Glacier is whether local stress concentrations are great enough to cause pressure inehing in cold ice and to enable water to circulate between the grains. The process does, however, seem feasible in temperate glacier ice, where similar clear-ice layers are often present.Another problem to consider is whether ice can be under tension at depth. The conditions under which tectonic veins form in rocks do not necessarily involve positive tensile stresses normal to the fracture; rather, fracture is orientated normal to the principal stress which has the least negative value. Presumably, the stress conditions at depth in a glacier would be analogous.
Development of debris-rich layers
Debris-rich layers, which dip up-glacier at various angles and produce ice-cored moraines at the surface, are common features at the snouts of both temperate and cold glaciers. As their origin has been subject to some dispute it seems that a review of the problems involved is necessary. For many years it was generally accepted that these features represent shear or thrust planes along which debris is dragged towards the surface, and some authors still hold to this view (e.g. Reference Bishop,Bishop, 1957; Reference Swinzow,Swinzow, 1962; Reference Souchez,Souchez, 1967). However, Reference Weertman,Weertman (1961) has argued that the hypothesis of entrainment of debris by shear is mechanically unsound, and in this he is strongly supported by Reference Hooke,Hooke (1970, Reference Hooke,1973[a]). The alternative explanation offered by Weertman is that the debris is incorporated by the freezing of water and loose debris to the bottom of an ice mass in the zone near the snout where the glacier ceases to slide and becomes frozen to the bed. This basal ice is then transported upwards along flow lines. Reference Hooke,Hooke (1968) suggested that the upward movement of ice at the edge of the Greenland ice sheet near Thule was caused by the movement of glacier ice against stagnant wind-drift ice wedges, and believed that the boundary was marked by a rapid, but not discontinuous, decrease in shear strain downwards. Like Weertman, he did not think that fault-type shear displacements could occur. Measurements of deformation at the margin of the Barnes Ice Gap (Reference Hooke,Hooke, 1973[a]) confirmed this hypothesis, while further supporting evidence was provided by the parallelism of the debris-rich layers and foliation parallel to the bedrock at the bottom of the ice sheet. Additional support for the hypothesis of debris incorporation by basal freezing was presented by Reference Boulton,Boulton (1970), as a result of work on glaciers in Svalbard. He noted that the process tended to take place on the down-glacier flanks of bedrock obstructions, again with the debris layers taking the same orientation as the basal foliation.
However, there is a certain amount of evidence that discrete shear, not necessarily involving debris, can take place in glaciers. Reference Nye,Nye (1952) has considered the mechanics of shearing in a glacier undergoing longitudinal compression. One set of slip-lines, which show the directions in which ice has the greatest tendency to fracture by shear, are initially parallel to the bed and curve upwards, emerging at the surface at 45° with their convex surfaces facing down-glacier. If ice already has lines of weakness, then the closer the debris-rich layers are to the slip-line directions the more liable they are to give shear faulting. Direct observations of shearing on discrete planes are rare, but Reference Ward,Ward (1952), referring to debris-rich layers at the edge of the Barnes Ice Cap, noted that "the shearing is rather irregular in time and position, and the largest abrupt displacement seen during the summer was about 45 cm at one place where the exposed dip was about 350 inwards". Reference Boulton,Boulton (1970) noted, on the glaciers of Svalbard, that as well as the debris forming layers parallel to the foliation at the bed, a series of planes dipping at 20-85° up-glacier, often with debris entrained along them, cut across and drag-folded the foliation in the clean ice above the debris-rich basal zone. These he regarded as evidence for thrusting and overfolding. He pointed out, however, that such a mechanism was a means of transporting debris from one place to another— it did not imply that the debris was incorporated into the ice by this mechanism. He concluded that basal freezing of debris certainly does occur, and very likely thrusting docs too; the main problem seems to be one of relative importance.
With regard to the White Glacier, it is necessary to mention certain differences from the glaciers discussed above. One of these is the parallelism between the crevasse traces and the debris-rich layers near the snout, whereas foliation parallel to the bed, as discussed by Reference Hooke,Hooke (1970, Reference Hooke,1973[a]) and Reference Boulton,Boulton (1970), seems to be absent. Also absent is a wind-drift ice wedge or a mass of stagnant moraine-covered ice at the snout, which would cause strong upward displacement of the flow lines. To explain the debris-rich layers and ice-cored moraines at the snout of the White Glacier, we believe that both basal freezing of debris and upward thrusting of debris-laden ice over clean ice occur, although we have no direct measurements of deformation to confirm our hypothesis. In more detail, the mechanism we envisage is as follows: As the crevasse traces move down-glacier their up-glacier dip declines rapidly, thus attaining a form similar to the slip-lines postulated by Reference Nye,Nye (1952) (Fig. 14).

Fig. 14. Schematic diagram illustrating the transition from crevasse traces to shear planes in the central portion of a sub-polar valley glacier.
In the oscillating zone where the glacier ceases to slide on its bed and becomes frozen to it, loose debris becomes incorporated with the basal ice in the manner suggested by Reference Weertman,Weertman (1961) and Reference Hooke,Hooke (1973[a]). Because the snout is frozen to the bed, and in effect acting as a barrier to the sliding ice behind, there will be strong longitudinal compression generated. Since one set of slip lines here has a similar orientation to the clear-ice layers, the ice will probably fracture by shear along planes of weakness represented by the bubble planes within the clear-ice layers. By this means, ice, including debris-rich basal ice, will over-ride ice immediately down-glacier (Fig. 14). Actual rolling or dragging of debris along the thrust plane is therefore unnecessary.
At the surface, ice above the "thrust" overhangs that below by up to 0.5 m, but whether this is partly the result of discrete shear or can be explained entirely by differential ablation is not known. The amount of debris involved is small, the long, high ridges possibly being the result of considerable ablation over many years. The increasing frequency of debris-rich layers is not difficult to explain : the total strain which ice has undergone can be many hundreds of per cent, and one would expect this to be reflected in the spacing of the layers. Clear structural evidence of thrusting as observed by Reference Boulton,Boulton (1970) is absent from the White Glacier, but in neighbouring glaciers both thrusting and over-folding are exceptionally well displayed. In fact, the frequency of debris-rich layers in some glaciers is the result of strong basal folding (cf. Reference Hudleston,Hudleston, 1976), whereby a single layer may crop out several times in the snout region. Elsewhere in the While Glacier, debris in small amounts is found in planes parallel to the longitudinal foliation in marginal areas (cf. Reference Hambrey,Hambrey, 1976[a]). However, as the foliation is discordant to the valley sides, it is difficult to envisage how the regelation mechanism can explain the incorporation of debris in such a situation.
Development of foliation
Longitudinal foliation of equal intensity throughout the width of a glacier does not appear to have been studied in detail previously, although it is sometimes visible in Alpine glaciers (e.g. Vadrec del Forno and Glacier de Saleina, Switzerland) which resemble the White Glacier in that each has a wide accumulation area feeding a long, straight, and narrow tongue. More common, perhaps, is an arcuate foliation (e.g. Reference Schwarzacher, and Untersteiner,Schwarzacher and Untersteiner, 1953; Reference Allen,, Allen,, Kamb,, Meier, and Sharp,Allen and others, 1960; Reference Rutter,Rutter, 1965; Reference Ragan,Ragan, 1969; Reference Hambrey, and Milnes,Hambrey and Milnes, 1975), or a weakly developed longitudinal foliation in the middle (e.g.Reference Meier, Meier, 1960), with strong longitudinal foliation at the margins in both cases. The most likely place for the White Glacier foliation to develop is in the early stages of flow in the narrow valley, although no direct observations were possible to confirm this. Transportation of an earlier layering frequently accompanies the development of foliation (Reference Turner, and Weiss,Turner and Weiss, 1963, p.92-94; Reference Hambrey,Hambrey, 1977). In this case, the early layering may be stratification which becomes isoclinally folded about a vertical longitudinal plane with an axial-plane foliation developing simultaneously and the shearing being concentrated on the limbs of the folds. Little evidence of a possible primary layering remains in the tongue, except for isolated intrafolial folds observed in aerial photographs (plotted in Fig. 3). Although there are apparently no recent studies of isoclinal folding of stratification together with the development of an axial plane foliation in this way, the process was well illustrated by Reference Crammer,Crammer (1909) and discussed by Reference Ogilvie,Ogilvie (1912) with reference to the Obersulzbachgletscher, Austria. This glacier, though much smaller than the White Glacier, had a wide accumulation area feeding a narrow tongue and thus flow mechanisms are probably similar.
In the White Glacier, foliation continues to evolve, particularly at the margins, although in the central part of the lower half of the tongue it appears to have been carried down passively, there being no evidence that it cuts across crevasse traces. In the marginal flow units it seems to have developed parallel to the axial plane of folded transverse traces.
Longitudinal foliation generally is believed to be the result of "shear" (e.g. Reference Sharp,Sharp, 1954; Reference Allen,, Allen,, Kamb,, Meier, and Sharp,Allen and others, 1960; Reference Meier,Meier, 1960; Reference Anderton,Anderton, 1973), but few attempts have been made to compare developing foliation with the orientations of the principal strain-rate axes. Strain determinations on the Kaskawulsh Glacier (Reference Anderton,Anderton, 1973) indicated that the foliation does not necessarily lie parallel to a line of maximum shear strain-rate, but, in this case, rotation of the foliation may already have taken place, and the measured strain-rates were perhaps no longer indicative of the conditions under which the structure originally formed. The White Glacier results, however, suggest that foliation may develop at a variety of angles to the principal strain-rate axes, but at the margins it develops very approximately parallel to a line of maximum shear strain-rate. An interesting aspect of the While Glacier foliation is that it seems to be as strongly developed in the centre of the glacier, where the strain-rates are small and the principal extension sometimes lies normal to the structure, as at the margins. This implies that foliation cannot be related to a unique orientation and magnitude of strain-rate. From the velocity measurements at Moraine and Anniversary profiles, one finds that the surface trace of the longitudinal foliation is essentially parallel to the flow lines; thus it appears that the structure is purely a flow phenomenon and not a function of strain. If we consider the total cumulative (or finite) strain we can conclude that foliation at the margins will become approximately parallel to the long axis of the strain ellipse after prolonged deformation; it is not clear what would happen in the centre without further data.
From the geological point of view, these results have important implications. In rocks, one sees only the end-product of deformation, whereas in ice we can examine the strain at different stages of progressive deformation. In recent years there has been much discussion on the relationship between foliation and the strain ellipse (or ellipsoid) in deformed rocks (cf. Reference Williams,Williams, 1976), and many writers believe that cleavage and schistosity remain normal to the direction of maximum compression throughout its development history. The White Glacier results contradict this idea, as discussed more fully elsewhere (Reference Hambrey,Hambrey, 1977).
Deformation Rates of Cold Glaciers Compared with those of Temperate Glaciers
In the Introduction it was mentioned that, on the basis of the flow law, one would expect deformation rates in cold glaciers to be less than those in temperate glaciers of comparable size, rate of movement, and stress. However, the values of maximum compressive, maximum extending, and shearing strain-rates are similar, as far as comparisons are possible, to those obtained in temperate glaciers (Table II). Thus, one can say that because there are no significant differences between the two types of glacier from the point of view of deformation rates, the stresses in the White Glacier must be greater.
Table II. Comparison of Maximum Principal and Shear Strain-Rates Obtained from Different Gtlaiers

Comparison of cold glacier structures with those of temperate glaciers
It is possible to make a number of generalizations concerning the relative abundance of the different structures in the two types of glacier having examined the structures in several sub-polar and many temperate glaciers. Foliation develops to a similar degree in both, but in sub-polar glaciers the mean crystal size of the coarse clear and coarse bubbly ice is considerably smaller, while individual layers can generally be traced for much greater distances at the surface of the glacier. Crevasse traces tend to be more widely developed in sub-polar glaciers, possibly because the mean fracture depth is greater and thus they survive for greater distances down-glacier. Numerous closely-spaced debris-rich layers are typical features of cold glaciers, especially in the snout areas, and are often associated with ice-cored moraines at the surface, whereas in temperate glaciers they occur much less frequently and are normally confined to the margins or to basal ice near the snout. Folding on all scales occurs in both sub-polar and temperate glaciers, but if we exclude surging glaciers, large-scale folding is more spectacularly developed in the former.
Acknowledgements
Financial support for the Axel Heiberg Expedition was provided by the National Research Council of Canada and awarded to F. Muller at McGill University. Logistical support was provided by the Polar Continental Shelf Project of the Department of Energy, Mines and Resources, Ottawa. The Geographical and Geological Institutes of the Eidgenossische Technische Hochschule, Zurich provided facilities for the preparation of this paper. Financial support was also received from the Zentenarfonds of the Eidgenossische Technische Hochschule Zurich (Project No. 189). We are grateful to the numerous members of the Expedition for assistance in the field, particularly to all those who helped with the collection of the large amount of stake-surveying data used in the strain-rate calculations for the period 1961-76. Our special thanks are due to Miss Phyllis Kelsey who has loyally and efficiently served the Expedition as administrator, organizer, and secretary almost since its initiation. Finally, for critically reading various drafts of this paper and for many useful discussions wc are indebted to R. L. Hookc, P. J. Hudleston, A. Iken, A. G. Milnes, A. Ohmura, J. G. Ramsay, H, Rothlisberger, and W. H. Theakstone.


