


INTRODUCTION
As the incidence of measles declines globally and countries begin to eliminate endemic measles, the importance of understanding measles importation risk and at risk populations increases if countries are to remain measles free [Reference Perry1, Reference Lopez2]. Our study aims to understand both these important issues in the highly immunized nation of New Zealand (NZ). As a member of the World Health Organization (WHO) Western Pacific Region, NZ is committed to measles elimination, defined as the interruption of endemic measles virus transmission, as achieved in the Americas in 2002 by the Pan-American Health Organization [3]. The Western Pacific Region is expected to be the second WHO region to achieve measles elimination, and it was announced in March 2014 that Australia, Macao, Mongolia, and the Republic of Korea have been verified as having achieved endemic measles elimination. They were followed in 2015 by Brunei Darussalam, Cambodia, and Japan [4].
The last widespread measles epidemics in NZ occurred in 1997, with 2169 confirmed cases and 314 hospitalizations [Reference Mansoor5]. Since then, smaller but significant outbreaks have occurred in 2009 (mainly in Canterbury), in 2011–2012 and in 2013–2014 (mainly in the Auckland and Waikato regions) (Fig. 1) [6]. An outbreak in May 2011 lasted for about 13 months. Further significant outbreaks started at the end of December 2013, and ended in September 2014. According to the measles elimination verification definition, and as advised by the Western Pacific Regional Verification Commission for Measles Elimination, NZ was eligible to request verification of non-endemic status 3 years after the last case of the 2011–2012 outbreak in June 2012, provided any subsequent outbreak did not result in endemic measles (<12-month circulation) and NZ complied with other elimination verification criteria [4]. Given NZ aims to obtain the verified status of having achieved endemic measles elimination, it is important that population risk factors and measles importation risk are understood in order to minimize outbreak size and duration following measles introduction.
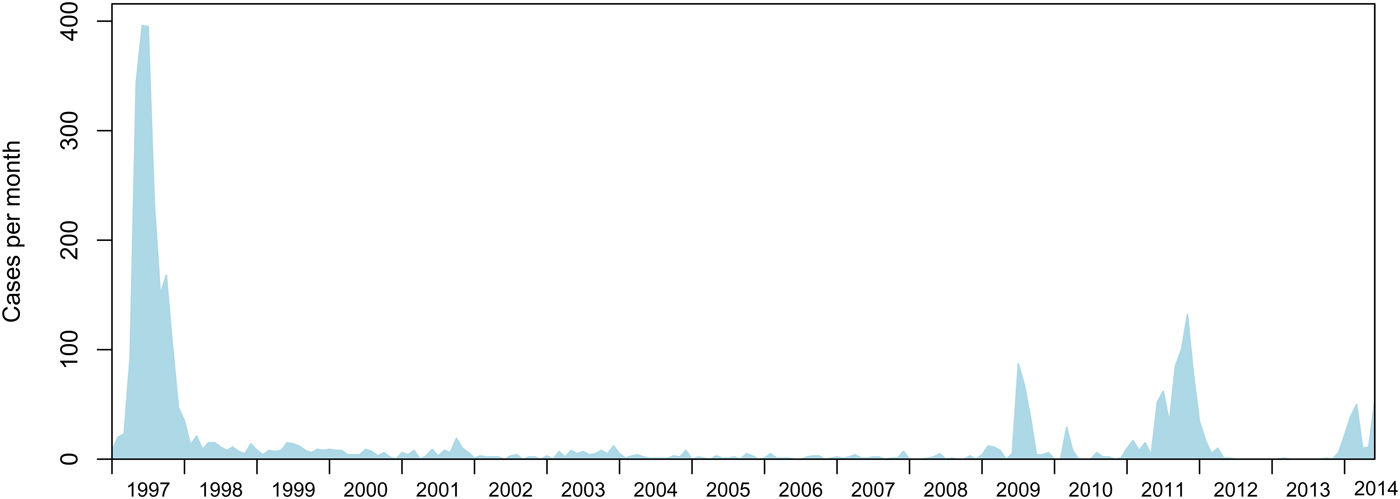
Fig. 1. Measles notifications (confirmed and probable cases) in NZ from 1997 to 2014.
The WHO estimates that the interruption of measles virus transmission can be achieved by herd immunity when approximately 95% of the population is homogeneously immune to measles [7]. The vaccination strategy in NZ of two doses of measles, mumps, and rubella vaccine (MMR), with one (MMR1) at 15 months and the second (MMR2) at 4 years of age, was assessed using a mathematical model and the results showed that achieving coverage of >90% at both vaccination opportunities was necessary to prevent endemic measles [Reference Roberts and Tobias8–Reference Tobias and Roberts10]. Existing policies in eight European countries were analyzed and researchers estimated the coverage rates required to reduce the average number of secondary infections in a partially immunized population, Rv, below one and eliminate endemic measles [Reference Wallinga11]. They found that results depended on the age at delivery, but no strategy succeeded if coverage rates were below approximately 87%. Thus, while NZ immunization programs have led to endemic measles elimination with outbreaks becoming less frequent and involving a decreasing number of cases, outbreaks still occur as described above. Previous estimates suggest that approximately 85–90% of the NZ population is immune to measles, thus the reasons for the larger outbreaks persisting are likely due to overall population immunity being <95% and there being pockets of susceptible, non-immune population remaining [12]. Since 2009 all the measles outbreaks in NZ have been linked to infections acquired (imported) from overseas (non-autochthonous), and recent work suggests these outbreaks still largely affect school-aged children, young adults and children under 2 years of age [Reference Reynolds13]. Those under 2-years old are thought to be consistently among the most affected age groups as MMR1 is routinely not due until 15 months.
In this study we use regression analyses to identify risk factors for 1137 measles cases in NZ from 2007 to 2014, in conjunction with descriptions of the NZ population in terms of vaccination coverage and immunity. To help understand the risk of measles importation, in light of the apparent increasing trend in measles incidence in the last few years (Fig. 1), we estimate the risk of measles importation from travel.
METHODS
Population risk analyses methods
We performed an observational study using measles case notification data provided by the NZ Ministry of Health (MoH). The population at risk was the population of NZ from 1 January 2007 to 27 June 2014.
In NZ measles is a notifiable disease. Measles cases are notified by clinicians through ‘EpiSurv’ [14], a national public surveillance system run by the Institute of Environmental Science and Research Ltd (ESR, NZ) on behalf of MoH. The measles case data were retrieved on 27 June 2014.
For our population risk analyses (see below) we used multivariate modeling to estimate risk factors for measles while adjusting for confounding. The risk factors we considered were age, wealth, and ethnicity, which are data collected relating to the measles cases and provided on EpiSurv.
Relative wealth in NZ is classified by the NZ Socioeconomic Deprivation Index (NZDep) from 1 (highest wealth) to 10 (lowest wealth/most deprived) [15].
The ethnicity of cases was defined by the NZ level 1 ethnic codes, herein ‘prioritized ethnicity’, and are: Māori, Pacific Peoples, Asian, Middle Eastern/Latin American/African (MELAA), and European. These five categories cover over 98% of cases, with only 1·9% (22/1137) of cases having no prioritized ethnicity and therefore not used in our risk analysis.
To determine risk and to test for interactions and confounding we required national demographic denominator data with the same attributes; specific age, prioritized ethnicities, and NZDep groups, to allow better characterization of the demographic determinants of measles infection risk. Denominator data stratified by age, prioritized ethnicity and NZDep were provided on 3 July 2014 by the University of Otago [15]. However, the age/ethnicity/NZDep denominator age data were not available by birth year, but categorized into five age groups: 0–5, 6–17, 18–24, 25–64, and 65+ years. The ethnicity denominator data were the 26 more detailed level 2 ethnic group code (e.g. Indian, Chinese), thus we combined these to appropriate level 1, prioritized ethnicity codes (e.g. Asian). The 10 NZDep groups, five prioritized ethnicities, and five age groups above, resulted in a total of 250 categories.
The incidence of measles appears to be disproportionately high in the very young (Fig. 2), but the Otago denominator data only contained a 0–5 year age group. To address this issue, we divided the 0–5 age group data into three age groups: 0–1, 2–4, and 5 years old, for each of the NZDep/ethnicity denominator groups. We assumed that equal (pro rata) numbers of young were born into each year group over the last 5 years, an assumption which is supported by data from NZ statistics [16]. To reduce the number of groups and because 5-year-olds start school on their fifth birthday, 5-year-olds were added to the 6–17-year-old group to make a 5–17-year-old group representing school aged children. No subdivision of the 5–17-year-old group was performed as constant birth rates for the period could not be assumed.

Fig. 2. (a) Numbers and age of 1137 measles cases in years in NZ for two periods, 1997 to June 2014 and 2007 to June 2014 (note these data are not stacked). (b) Age and vaccination status of measles cases, 2007 to June 2014 (these data are stacked).
This large number of categories, some with small population sizes, led to both over-dispersion and zero-inflation, as there are many categories with zero cases, particularly in the adult age groups. Furthermore, initial preliminary multi- and univariate analyses (not shown) suggested little effect of individual NZDep classifications and several higher order interactions. Therefore, we reduced the number of socioeconomic deprivation categories from 10 to 3: NZDep 1–3 (least deprived), NZDep 4–7, and NZDep 8–10 (most deprived). We also incorporated the 65+ age groups into the 25–64 age group, to make a 25+ age group. Together these reductions decreased the zero-inflation present in the data.
The numbers of cases per category and population sizes for the complete dataset from 2007 to 2014 can be seen in Table S1 and Fig. 3. Subsequent regression analyses (not shown) also suggested that the MELAA group was over- or under-represented in per capita rates given the very small population sizes for this classification (Table S1), leading to very large standard errors in regression analyses. Thus, we removed this grouping for our subsequent analyses and are left with Asian, European, Māori, and Pacific, as prioritized ethnicities. This left us with 1102/1115 (99%) of the measles cases with prioritized ethnicity recorded since 2007, and 1102/1137 (97%) of all measles cases recorded since 2007 (Table S1). The final breakdown of cases and measles rates can be seen in Fig. 3.

Fig. 3. (a) 1137 measles cases from 2007 to 2014 (Table S1). (b) Per capita measles values from 2007 to 2014 (Table S1). The x-axis shows NZDep:Age Range:Prioritized ethnicity, e.g. 1–3 0–1 Asian is NZDep (deprivation index) 1–3 (where 1 is least deprived on a scale of 1–10), 0–1-year-old Asian children.
For all our statistical analyses (including those not shown) we used a glm (generalized linear model, [17]) with a Poisson error structure and the rate adjusted for population size (population size was included as an offset variable). A quasi-Poisson model was used to adjust for overdispersion. We used a model simplification approach by beginning our analyses with all terms and all interactions, and then simplifying the models through removal of non-significant higher order interaction terms using analysis of variance (ANOVA) [Reference Crawley18]. Thus, the final model that remained with all significant interaction terms had the following linear predictor:
 $$y\; \sim\; {\rm Poisson}(\lambda n)$$
 $$\log (\lambda ) = \alpha + \beta _a (x_a ) + \beta _e (x_e ) + \beta _s (x_s ) + \beta _{ae} (x_a \cdot x_e )$$
where y is the number of cases, λ is cases per capita, n is population size, α is the intercept, β the regression coefficient, x is the variable, subscript a signifies age, e signifies prioritized ethnicity and s signifies NZDep.
Vaccination history of measles infection and population immunity estimation methods
We described estimated population immunity levels at the national level in NZ. To do this we used the NZ census data from NZ statistics [19]. Immunization and immunological data were taken from the National Immunisation Register (NIR) for 2006–2012 birth cohorts, and from previous reports to WHO for 2001–2005. This was because the NIR was progressively implemented nationwide in 2005. Vaccine effectiveness was assumed to be 90% (lower) to 96% (upper) for one dose of MMR and 95% (lower) to 99% (upper) for two doses. Serosurvey data published in 2009 of ⩽2000 birth cohorts [Reference Weir20] were provided by MoH (Tables 2 and S2). The serosurvey data comprised 2254 anonymous serological test results provided by MoH from blood samples collected from 2005 to 2007. In the serosurvey, equivocal serological results were considered non-immune (lower) and immune (upper), and 95% confidence intervals (95% CI) are given for each estimate based on the sample size. Note that 28% of those <1-year old were assumed immune due to passive maternal immunity [Reference Waaijenborg21].
Measles importation risk methods
For our measles importation risk analyses we used available travel data to measure human movement to and from NZ and global measles incidence data. We present data from 2012 and 2013 as these were the most recent years with relatively complete WHO measles data of our analysis.
The travel data comprised non-New Zealander port arrival and New Zealander travel destination data by country and year from NZ immigration for 2012 and 2013 [22]. The non-New Zealander traveler data include the number of arrivals by country of residence for all non-NZ passport holders. The immigration data document all travel by foreign nationals, coming for whatever purpose, and include non-New Zealanders resident in NZ, but not yet holders of NZ passports. We collated country population size and measles case data from the WHO for 2012 and 2013 [23]. We used the WHO data to determine per capita measles cases for 2012 and 2013 together with the number of journeys from/to NZ to try to determine the likely source for measles importation. We used simple per capita rates for measles and the number of travelers to and from each country to estimate the risk of measles importation. We used 0–19-year-old data for the non-New Zealander travel data rather than all age groups, assuming that the majority of >19-year-old's (young adults) are immune to measles globally through infection or immunization. Young adults have been increasingly infected in some outbreaks and 0–19-year-olds seem most at risk according to WHO [24]. These age group data (0–19-year-old travelers) were not available for NZ travelers, so we used data on all travelers for these.
RESULTS
Measles case data
Measles case numbers by age and per capita rates by age, ethnicity and NZDep are shown in Figures 2 and 3. The majority of measles cases were in the very young over all the years since 1997. However, since 2007 there has been a change in the age distribution of cases. While the very young are the majority of cases there have been a greater number of cases in the teenaged children/young adult ages (compare the age distributions in Fig. 2). The majority of cases were among people of European ethnicity, and in particular in wealthier (NZDep 1–7) European 5–17-year-olds. Per capita rates are highest in all under one categories, followed by the 2–4 and 5–17 groups in Europeans and Māori (Fig. 3).
Regression analyses results
Measles risk was significantly associated with age (F = 204, P < 0·0001), ethnicity (F = 4, P = 0·014) and social deprivation (F = 5·2, P = 0·01), and there was a significant multiplicative interaction between age and ethnicity (F = 4·1, P = 0·0004, Table 1). A summary of results from the regression model (equations 1 and 2) with the individual effects and the statistical support for the estimated relative risk (RR) with 95% CI is presented in Table 1. The predicted results from the regression model on the log scale with the partial residuals are visualized in Fig. 4.
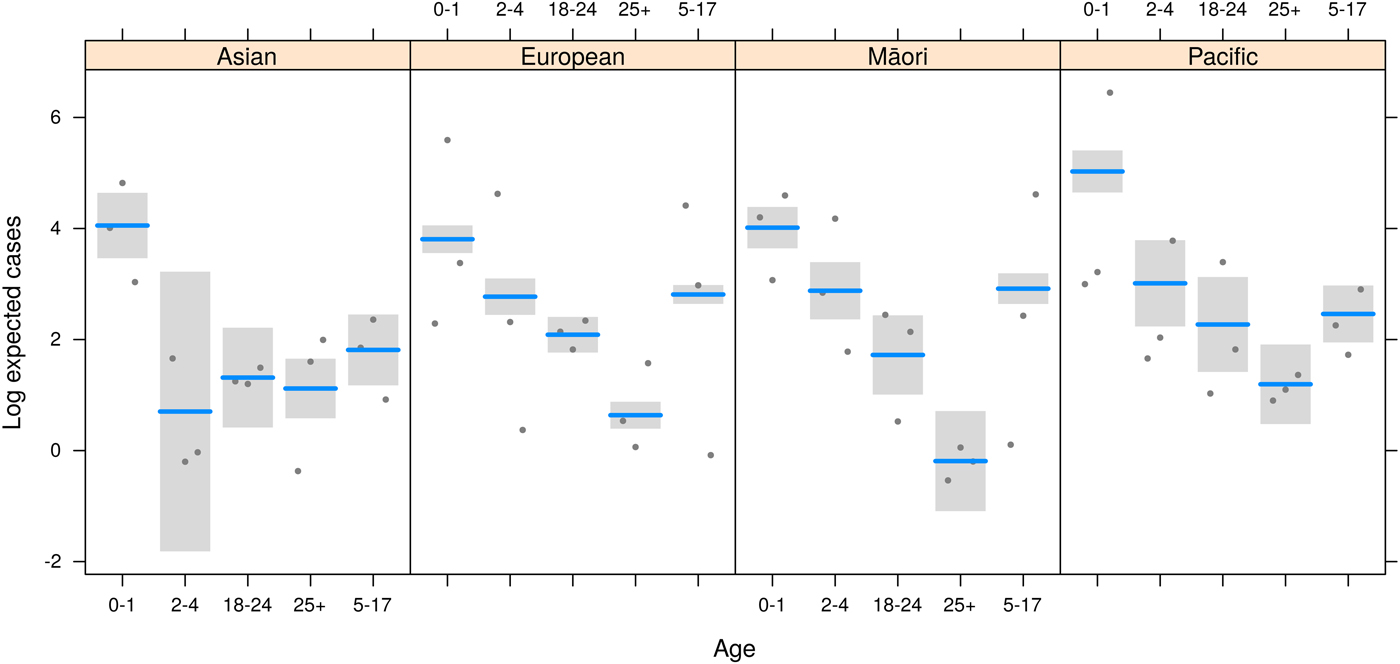
Fig. 4. Modeled log expected cases (lines) and 95% CI (bands) for each age group within ethnicity. Points represent data locations relative to the model fit for each NZDep category (partial residuals).
Table 1. Summary of the regression model results

Equations 1 and 2 and a quasi-Poisson error structure were used for measles risk factors for cases from 2007 to 12 June 2014. RR: values <1 indicate rates are lower for this group compared with the base categories (0–1-year-old Europeans of NZDep 1–3) and the different component parts of that, and values >1 indicate the rates are greater than the baseline rate, with the exclusion of 1 in the 95% CI indicating significance at the 0·05 level. Significance of different predictor variables using ANOVA is shown in the Pr(>F) column and the p-value is given.
People of Pacific origin were at an increased risk of measles compared with Europeans (RR = 3·39, 95% CI 2·24–5·11; Table 1). However, generally those people in the more deprived NZDep levels 4–10 were at lower risk of measles compared with those in the NZDep 1–3 group (NZDep 4–7 RR = 0·77, 95% CI 0·65–0·92; NZDep 8–10 RR 0·74, 95% CI 0·61–0·90; Table 1). In European and Māori ethnicities there was a trend opposite to that in Pacific people, with a higher risk of measles in wealthier Europeans and Māori compared with less wealthy deprivation categories (Fig. 3), but this was not found to be significant (Table 1).
The regression results suggest the risk of measles in the 5–17-year-old age group was greater for Europeans and Māori. The risk was significantly lower for Asian (RR = 0·29, 95% CI 0·01–0·71) and Pacific (RR = 0·21, 95% CI 0·11–0·4) people in this age group compared with Europeans of this age group (Fig. 4, Table 1).
Vaccination history and measles infection results
The majority of measles cases (82·8%, 955/1154) from 2007 to June 2014 were in unvaccinated people (Fig. 2). However, that means one-fifth (17%, 199/1154) of all cases had been vaccinated at least once and 12·6% cases (145, i.e. 73% of 199 vaccinated) had received their first dose of vaccine and 4·7% of cases (54, i.e. 27% of 199 vaccinated) had received their second (Fig. 5). A further breakdown of those data shows that some cases received their first MMR dose around the first year of age, which is younger than the 15-month age recommended, with 23% of those cases (46/199), vaccinated with MMR1 were under 15 months (Figs 2 and 5).

Fig. 5. (a) Age of vaccination of vaccinated measles cases, 2007 to 12 June 2014. Recommended vaccination age in months is shown for the measles, mumps, and rubella (MMR) dose 1 (15 months) and MMR dose 2 (4 years). (b) The year of birth of measles cases, 2007 to 12 June 2014, for vaccinated measles cases.
Population immunity and vaccination coverage results
The NIR data at the national level and at the city level for the three major cities, Auckland, Wellington and Christchurch, show that there is heterogeneity in MMR coverage, including within the larger urban areas (e.g. Fig. S1). Recent vaccination levels (after the NIR was introduced) are consistently high for MMR1 (Table S2), as also shown in the population immunity estimates (Table 2). For example, MMR1 rates across 2020 area units in NZ varied little from 2006 to 2012, the years all children should be vaccinated by when the data was collected. The mean MMR1 vaccine coverage was between 95% and 96%, and 75% area units achieved a minimum of 92–94% vaccine coverage. For the years 2006–2009 the mean MMR2 coverage was 88–90% and 75% area units achieved 83–86% over the same period (Table S2).
Table 2. Indicative estimates of immunity by year of birth
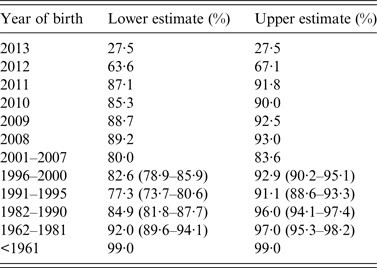
National immunization and immunological data were used to estimate immunity. For cohorts ⩾2001 vaccine effectiveness was considered to be 90% (lower) to 96% (upper) for one dose of MMR and 95% (lower) to 99% (upper) for two doses. For ⩽2000 serosurvey data are used and equivocal serological results were considered non-immune (lower) and immune (upper), and 95% CI are given for each estimate based on the sample size. For those <1 28% were assumed immune due to passive maternal immunity [Reference Waaijenborg21]. Data were correct on 1 January 2014.
Measles importation risk results
Globally, analyses of 2012 and 2013 data suggest measles incidence is typically highest in less-developed nations (e.g. 2013, Table S3). Travel to NZ of 0–19-year-old non-New Zealanders (whether for work, pleasure, etc.) is dominated by people from Australia, followed by China, UK, Japan, and the USA (e.g. 2013, Table S4). As well, Australia is the most common travel destination for New Zealanders (e.g. 2013, Table S4). Together, these mean that the greatest travel numbers are between NZ and Australia (1 148 243 in 2013). However, many South Pacific nations also appear in the most visited country list by New Zealanders. Although the precise interactions between measles incidence and travel is unknown, the simplest, a product of measles incidence and total traveler numbers, suggests that those countries with greatest travel between them and NZ pose the greatest risk to NZ for measles importation (Table 3). For example, in 2013 Australia had a measles incidence of just 7 per million, but 1 148 243 NZ and 0–19-year-old Australian travelers lead to our estimate of a measles risk per million travelers of 7·87. The UK had a higher incidence of 31 cases per million, but fewer travelers (121 835), so an overall risk of 3·72, Thailand 40 cases per million, 47 293 travelers and an estimated importation risk of 1·87 cases per million travelers, and China 19 cases per million, 99 720 travelers and an estimated importation risk of 1·93 cases per million travelers (Table 1). Although the global incidence of measles is declining (Fig. S2), in recent years that decline has slowed [25] and immigration and non-NZ national travel rates to NZ have been increasing (Fig. S3). This suggests that the risk of measles importation could stay at similar levels or increase. Of note, however, is the clear seasonality in immigration and travel (Fig. S3). This seasonality suggests that there may be a period of increased risk of measles importation. Of interest is the asynchrony, or lack of phase, between peak non-New Zealander immigration and travel and New Zealanders traveling. The summer holiday period is an exception to this, with to a sharp peak in travel rates in December (Fig. S3).
Table 3. Countries listed by highest measles importation risk

Incidence, measles incidence per million [25]; Travelers, total traveler numbers by country for all ages of NZ nationals and 0–19-year-old non-NZ nationals; Risk, risk of measles importation in cases per million travelers per year to NZ, estimated by traveler numbers multiplied by measles incidence in the source location. Data for both 2012 and 2013 and an overall risk from both years is shown.
DISCUSSION
Our regression analyses suggest that age remains a particularly strong risk factor for measles in NZ. While this comes as no surprise to epidemiologists or health care providers, our analyses also highlight other groups that are at greater RR of measles. Following the improvement in vaccination coverage rates after the NIR implementation in 2005, Figure 2 confirms the shift in age groups affected by measles and the reduction of the disease burden in the birth cohorts included in the NIR. This age shift may be confounded by non-random mixing and contact structures as well as reduced numbers of at-risk children in the younger age cohorts through improved vaccination in the young. There are particular age groups of younger people that appear more at risk, such as 12–17-year-olds (Fig. 2), for which we were unable to test the risk through statistical methods due to a lack of appropriate denominator data. However, our analyses were able to determine that European 5–17-year-old children are at greater risk, as are the less-deprived (NZDep 1–3) and Pacific island people. However, people of Pacific origin of all deprivation categories from 2- to 24-years old were less likely on a per capita basis to be cases than Europeans or Māori. Interpretation of these results must still be viewed with some caution, however, because any spatial effects are not accounted for in these analyses. For example, increased numbers of more wealthy Europeans were measles cases, as was true for Māori, even on a per capita basis. However, the alternative situation was clear for Pacific people, especially of 0–1-year-olds (Figs 3 and 4), in which the most poor were at greatest risk, as seen in other communities [Reference Hungerford26]. Results such as these may simply be due to the spatial location of the communities in which the outbreaks were occurring in, rather than an independent effect of wealth or vaccine refusal following the now retracted study linking MMR to autism [27], though each of these may also be spatially dependent variables. Similarly, wealth might be hypothesized to increase the likelihood of reporting or presentation at health clinics. However, NZ public health units investigate possible measles cases and perform contact tracing, so we believe the majority of cases in NZ are included in the dataset.
The spatial drivers may be related to community and age contact rates or immunity rates, which can vary spatially [Reference Reynolds13]. The spatially explicit NIR vaccination data suggest that there is heterogeneity in vaccination coverage at the area unit level for both MMR1 and MMR2 (e.g. Fig. S1) [Reference Reynolds13, Reference Rumball-Smith and Kenealy28]. The level of immunity within the population more broadly is also heterogeneous; however, in our dataset this reflects age structure within District Health Boards (DHB) as much as varying immunity levels, because national-level immunity levels were applied to each DHB population and underlying smaller spatial units (e.g. Fig. S1). However, there may be additional heterogeneity due to other reasons, including vaccine refusal. In NZ vaccine refusal is typically <5%, ranging from ~3·5% to ~5% [29], but may be high in some clinics (up to 10%) [Reference Rumball-Smith and Kenealy28].
The age frequency distribution of measles cases (Fig. 2) appears to reflect the age distribution of naïve individuals in the population (Table 2). In particular, children in the first and second years of life had the greatest number of cases. However, there is some discrepancy between the numbers of cases and the proportions of naïve by year of birth, which may reflect other processes such as spatial effects in contact rates and therefore measles transmission (e.g. in day care or school environments). Despite the majority of cases being unvaccinated, nearly one-fifth of cases had been vaccinated at least once. Most of these vaccine failures were children vaccinated when young, and in particular 23% (46/199) received MMR1 under 15 months (Figs 2 and 5). Fifteen months is the recommended age by which all children are required to have received MMR1. This age is chosen to achieve a balance between the risk of maternally acquired antibodies neutralizing the vaccine; because by ⩾12-month-old children have the greatest immune response to MMR1 [30]; the need to protect the very young during an epidemic; and the ease of giving the MMR1 vaccination alongside the booster dose for diphtheria, tetanus, pertussis, and Haemophilus influenzae type b. Of those 54 measles cases vaccinated twice, five (9%) were vaccinated under 15 months. These ‘vaccine failures’ in the young may be for a number of reasons, including that infection occurred close to vaccination during an outbreak. In Canadian and British studies failure rates of 3–12% of children ⩽18 months have been inferred through vaccinated children becoming seronegative after 4–6 years post-vaccination [Reference Miller31, Reference Boulianne32] and during one of the outbreaks included in our study the rate of vaccination failure was 14% [Reference Reynolds13].
Based on NIR data, recent vaccination coverage by annual birth cohort shows consistently high vaccination coverage by MMR1 (often exceeding 95%), lower coverage for MMR2 (approaching 90%, Table S2), with variations among DHBs. Recent outbreaks suggest that catch-up vaccination of older age groups, not systematically included on the NIR, may be necessary to prevent large measles outbreaks in NZ. For these populations not on the NIR, national immunity estimates can be useful at DHB level, assuming no other more accurate information source is locally available.
Our study suffers a number of weaknesses due to the study's observational nature [Reference Vandenbroucke33]. We were limited because the overall number of cases was low compared with the population size and the denominator data available were not at the same resolution as the case data. We were also unable to obtain serological and immunization data for the denominator data, or the denominator data at an appropriate spatial resolution, preventing us from performing more refined spatial risk analyses to understand the local transmission dynamics. The NIR data suggest vaccination uptake is heterogeneous [Reference Rumball-Smith and Kenealy28] and recent MoH data suggest MMR1 and MMR2 vaccine efficacy may vary from 90% to 96% and 95% to 99%, respectively. However, uptake of childhood immunization across the country is now high and consistent across all ethnicities. The most recent data for 2014–2015 report MMR1 vaccination rates to be 92·3% for Maori, 93·3% for European, 96·4% for Pacific and 95·9% for Asian ethnicities [34]. Unfortunately, earlier immunization rates and serological data by the risk factors used in this analysis are unavailable.
Further information is required to see if the seasonal patterns in travel match any periodic patterns in measles incidence in the countries of origin for individuals traveling or returning to NZ. However, the strong seasonality in travel around the summer vacation in December suggests this may be a time where additional effort and vigilance is required for measles vaccination and control efforts. The country identified as greatest risk for measles importation, Australia, simply reflects the enormous amount of travel between Australia and NZ (Table S4). Recently Australia was declared free of endemic measles and so the 2012 and 2013 data reflect cases linked to multiple measles importations there [4]. Other areas of high risk include the UK, which has been affected by significant measles outbreaks [Reference Hungerford35], and countries in Europe and Asia, where measles is endemic (Table S3). Despite lower travel intensity between NZ and some Asian countries, a higher risk of measles importation from these nations may exist as they have high measles incidence. Note that South Pacific islands do not appear to have posed a greater risk in 2012 and 2013, despite large numbers of travelers of NZ origin, probably because of the low measles incidence in these nations at that time. More refined data on all the destinations and travel histories of travelers, the age of travelers and understanding of the appropriate interaction between travel and measles incidence will improve the risk assessment, but these data are currently unavailable. For example, our importation risk analysis was hindered by the age classifications available and our inability to know if the data represented repeated journeys by the same travelers, the destinations visited by those travelers, and the measles-related status of those travelers.
Despite their limitations, our results do provide information for the MoH regarding potential seasonal and population-level risk and will help us to model the potential future measles outbreak sizes in each DHB, estimate the costs of recent measles outbreaks, and hence estimate the benefit-cost ratio for catch-up vaccination programs targeting susceptible individuals not captured in the current immunization programs.
In summary, our analyses suggest that despite recent high MMR immunization coverage, overall population immunity against measles remains borderline (about 90%) and is lower in those born between 1982 and 2005 (approximately), with the school age population being more at risk for measles outbreaks (especially the older school aged children). Therefore, importation of measles due to travel, even from countries with highly immunized populations, is likely to continue to precipitate measles outbreaks.
SUPPLEMENTARY MATERIAL
The supplementary material for this article can be found at https://doi.org/10.1017/S0950268817000723
ACKNOWLEDGEMENTS
The authors thank Lisa Oakley and Nic Aagaard from the Ministry of Health, Ruth Pirie and colleagues from the Environmental Science and Research, and June Atkinson from University of Otago for help in obtaining the appropriate materials for analyses. This work was funded through a Ministry of Health contract to Massey University.
DECLARATION OF INTEREST
None.
ETHICAL STANDARDS
The authors assert that all procedures contributing to this work comply with the ethical standards of the relevant national and institutional committees on human experimentation and with the Helsinki Declaration of 1975, as revised in 2008. All data were anonymous and extracted from national surveillance data.


