


Introduction
Glaciological investigations have been carried out since 1982 at Paakitsup Akuliarusersua, north-east of Ilulissat, West Greenland, as part of a plan to build a hydro-electric power plant to supply energy to the 3500 inhabitants of Ilulissat.
The basin has an ice-free area of 33.6 km2 and includes a much larger adjoining sector of the inland ice (Fig. 1), so that about 90% of the run-off from the basin is melt water from the ice sheet. The water drains from the ice sheet through three lakes, of which two (Sø 326 and Sø 233) are connected to the third (Sø 187). The lakes Sø 233 and Sø 187 are proposed as the sites of two separate reservoirs from which tunnels would lead to a power station in the fjord just to the west of Sø 233.
The melt water from Sø 233 runs into Sø 187 and drains along the northern lateral part of the outlet glacier from the inland ice into Sø 187. At an earlier time this drainage channel was blocked by the glacier tongue, and because of this the melt water then drained from the westernmost part of Sø 233. The change in drainage took place sometime between 1953 and 1959 (Reference ThomsenThomsen, 1983). The glacier margin has been in general retreat since 1890 (Reference WeidickWeidick, 1968).
Melt-water drainage patterns on the ice sheet are complicated. Over large areas, melt water drains through rivers whose drainage courses are influenced by surface undulation and by the varied structural features of the ice surface. In most cases, the rivers escape down into moulins or crevasses, after which the drainage of melt water is controlled by englacial and subglacial drainage conditions.
Research Programme
The size and character of the basin requires glaciological research within different fields before it is possible to establish a basis for planning. The programme reported in this paper was designed to elucidate run-off conditions, to delineate drainage basins, and to assess the probable effects of future advance or retreat of the ice margin. The investigations include 5 years of mass-balance measurements (Reference ThomsenThomsen, 1986a), repeated photogrammetric and satellite mapping (Reference ThomsenThomsen, 1986b, Reference Thomsen and ReehThomsen and Reeh, 1986; Reference Thomsen and BraithwaiteThomsen and Braithwaite, 1987), stable-isotope studies (Reference Reeh and ThomsenReeh and Thomsen, 1986; Reference Reeh, Thomsen and ClausenReeh and others, 1987a), simulations of run-off (Reference Braithwaite and ThomsenBraithwaite and Thomsen, 1989, this volume), and glacier dynamics (Reference ReehReeh, 1983, Reference Reeh, Hammer, Thomsen and FisherReeh and others, 1987b).
In this paper we deal with the delineation of melt-water drainage basins on the inland ice, for which the required information about supraglacial and subglacial conditions has been obtained by photogrammetric mapping, radio echo-sounding, hot-water drilling, and mathematical modelling.
Surface Topography and Surface Drainage of Water
In order to describe the supraglacial drainage conditions, a photogrammetric map was prepared covering the ice-free part of the drainage basin and the adjoining sector of the inland ice. The map, based on vertical aerial photographs at a scale 1:150 000 taken on 10 July 1985, was converted to a scale of 1:75 000 using a Kern PG-2 stereo-plotting instrument connected to an HP computer system. The map gives physiographic information and details of surface topography, with contour intervals of 50 m in the ice-free areas and 20 m intervals on the ice. Various details have been plotted for the area of the glacier and its trim-line zone, including features on the ice which especially relate to surface hydrology, such as rivers, lakes, and moulins, as well as crevasses and lineaments likely to influence the drainage pattern. The map-plotting procedure was supported by observations in the field made either on foot or from a helicopter. The hydrological map of the glacier is presented in full scale with all available details in Reference Thomsen, Thorning and BraithwaiteThomsen and others (1988), and a generalized topographical version is given in Figure 1.
Melt water drains through innumerable small rivers, merging into large river systems which follow valleys in the strongly undulating ice surface. The drainage pattern is determined by both local and general topography, and also to a lesser degree by structural features such as healed crevasses and lineaments, and this in turn indicates the ice-flow pattern. The larger rivers occupy larger valleys in the ice, and they drain into canyons between 1 and 5 m deep which cut through the surface undulations of the ice. The river bed in these canyons sometimes dips inland, in the opposite direction from that of the ice-surface inclination, and directs melt water away from the ice margin for varying distances. Such drainage conditions complicate interpretation of surface drainage on the basis of ordinary topographic maps. The rivers drain over the ice surface for varying distances, but often escape down into the ice through moulins or crevasses before reaching the ice margin. The moulins vary in size, depending upon their ages and upon the amount of water draining to them, but diameters in the range of 1–2 m are typical for the area.
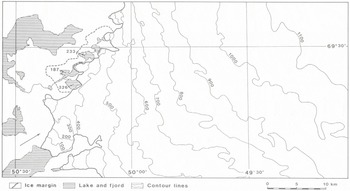
Fig. 1. Drainage basin at Paakitsup Akuliarusersua, north-east of Ilulissat. Contours in metres. Arrow shows viewing direction of three-dimensional representation in Figure 3.
Many lakes exist on the ice surface, often without any identifiable surface outlet. They vary in size from only a few hundred metres in diameter up to about 1500 m, and soundings in the lakes show mean water depths of 2–5 m. The lakes tap periodically. Visits to empty lakes show that moulins often exist at the bottoms of the lakes, and it is reasonable to assume that these moulins are filled with snow during the winter, thus closing the outlets. Lakes are then filled during summer until the moulins are re-opened by a combination of pressure and melting. Observations of similar effects were made in Spitsbergen (Reference liestö, Repp and WoldLiestøl and others, 1980). The described drainage pattern on the ice surface is apparently semi-permanent, which means that drainage takes place in the same valley systems from year to year because the valleys are features of local topography caused by ice movement over the hilly subglacial terrain. Comparisons with older maps, plotted from vertical aerial photographs dating from 1959 (Reference ThomsenThomsen, 1986b) and with oblique aerial photographs taken in 1948, show a stable main drainage pattern with rivers draining in the same valley systems and moulins lying in approximately the same positions as those observed today. This is despite a mean glacier thinning of 14 m up to an elevation of 500 m a.s.l. over the period from 1959 to 1985.
On the basis of the hydrological map of the glacier, the ice surface is divided into a number of drainage cells, each draining into either a moulin or a moulin complex (Fig. 2). The mapped area consists of a total of 249 drainage cells. The melt-water drainage from each cell depends on the englacial and subglacial conditions below the point where water escapes down into the ice.
Radio Echo-Soundings
Radio echo-soundings were used to map the ice thickness over the inland ice sector. The instrument used for this was a 300 MHz radar with an antenna consisting of two dipole elements with a half-parabolic reflector, especially adapted for mounting between the floats of a Bell 206 Jetranger helicopter.
The radio echo-sounding was carried out for two periods, in July 1985 and April 1986 (Reference Thorning, Thomsen and HansenThorning and others, 1986; Reference Thorning and HansenThorning and Hansen, 1987). A total of 22 flying hours was used in each period for actual measurements covering an area of about 850 km2. The operation in 1985 was originally planned as a series of experiments on obtaining a usable signal to evaluate the influence of natural conditions, such as water bodies and crevasse fields, and to test the technical configuration of equipment so as to determine which would yield the best results. However, the results obtained were so encouraging that an actual survey was carried out at that stage. This was done without any navigation equipment, using only visual navigation between identifiable structures on the ice surface and at the ice margin. The 1986 operation extended the survey further inland and used Del Norte line-of-sight navigation equipment. The surveys were carried out at a low, constant elevation of 10 m above the ice surface, as the experiments in 1985 showed this to be of vital importance in obtaining good results. Under these conditions it was necessary to accept a locally reduced accuracy in navigation; in 1985, because no points could be visually identified, and in 1986, because of the loss of line-of-sight to the transponder stations.
Radio echo-sounding data were recorded on a video tape-recorder, and navigation data on audio tape. Hard copies of the data were reproduced and reflections digitized. A package of computer programs was developed for the compilation of data, including provision for migration of data and for plotting at various stages of data processing. Both a map and a model of the subglacial topography were produced by combining the topographical ice-surface data with the compiled ice-thickness data, after both data sets had been transformed into a 100 m × 100 m grid (Fig. 3).
Subglacial Drainage of Water
Studies of englacial and subglacial water drainage usually deal with drainage in temperate ice conditions. Some water drains through tiny cracks and openings along single ice crystals (Reference ShreveShreve, 1972) but most water drains in larger channels and conduits, starting at moulins and crevasses on the surface. Moulins can sometimes reach several hundreds of metres down into the ice and can connect with the glacier bed (Reference IkenIken, 1972; Reference MeierMeier, 1973), although in other cases they may reach only a few tens of metres down into the ice and there connect with an englacial drainage system (Reference Holmlund and LeB. Hooke.Holmlund and Hooke, 1983). At the bottom of the ice, water can drain either as a thin water film or in subglacial channels depending on the regional and local subglacial conditions (Reference Röthlisberger and LangRöthlisberger and Lang, 1987). Reference Behrens, Löschhorn, Ambach and MoserBehrens and others (1977) and Reference Krimmel, Tangborn and MeierKrimmel and others (1973) used tracer experiments to determine travel time for water through the ablation zone of glaciers. The values obtained were of an order of magnitude of hours. Subglacial drainage through channels has been determined by drilling through the ice (Reference Wold and ØstremWold and Østrem, 1979).

Fig. 2. Drainage cells, each draining into either a moulin or a moulin complex, whose positions are given with dots.
No direct observations are available for englacial and subglacial drainage from the area Paakitsup Akuliarusersua. Data from thermistors drilled down to the bedrock show a bottom temperature of –0.8°C at an ice thickness of 300 m, and a minimum temperature of –2°C in the middle of the ice body (Reference ThomsenThomsen, 1988). Observations from White Glacier on Axel Heiberg Island suggest that water escaping down into moulins is able to reach the bottom of the ice, even in cold-ice conditions (Reference IkenIken, 1972).
The water in the three marginal lakes studied is very turbid, indicating the existence of subglacial drainage. The extent of englacial drainage in the basin is difficult to assess. According to Reference ShreveShreve (1972), water-filled englacial conduits dip down-glacier with an angle of 90° minus 11 times the surface slope. With a mean surface slope of 2.5° and a mean ice thickness of 400 m for the basin, such conduits would be expected to reach the glacier bed about 200 m down-glacier from the point where the water escapes down into the ice. This is a small distance compared with the horizontal spread of the surface-drainage cells. It is assumed that most of the surface water from the area which escapes down into the glacier through moulins flows quickly to the bottom of the ice where its drainage is dependent on the subglacial conditions.
A model by Reference BjörnssonBjörnsson (1982) describing subglacial drainage is used in calculating drainage at the glacier bed. The model describes water drainage down the gradient of a potential depending upon both surface and subglacial topography. Data from the photogrammetric surface mapping and data from radio echo-sounding of the bed are used as input for the model. The potential, p, is expressed as
where ρw and ρi are the densities of water and ice respectively, g is the acceleration of gravity, zb and zs are the elevations of glacier bed and glacier surface relative to a horizontal datum, and Κ is an hydraulic factor expressing the relation between subglacial water pressure and ice overburden.

Fig. 3. A three-dimensional representation of subglacial topography. Viewing direction, from south-west, is shown by an arrow in Figure 1.
Water flowing in an isotropic basal layer drains perpendicularly to the potential lines. The model is a first-order approximation of subglacial drainage and does not describe details of water flow. Measurements of subglacial water pressure have been made in bore holes connected with the subglacial hydraulic systems (Reference MathewsMathews, 1964; Reference HodgeHodge, 1976; Reference EngelhardtEngelhardt, 1978). Reference HodgeHodge (1976) described mean water pressures of 74% for the ice-overburden pressure for the months of July and August. Furthermore, Hodge stated that water pressure varies considerably from one bore hole to another, but often in a synchronous manner. Generally, the subglacial water pressure varies with the amount of water draining into the system, which is interpreted as an adjustment of the drainage system to changing water input. The Κ factor will vary in time and with location in a way which is difficult to describe and, as a minimum, requires extensive measurements of the basal water pressure. Subglacial potentials are therefore calculated for a number of Κ values from zero to unity and are plotted as potential maps.
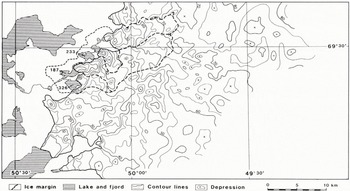
Fig. 4. Calculated subglacial water potential for Κ = 0.7. Units are 10s N/m2. Subglacial water divides are shown by dotted lines.
The subglacial water divides under conditions of varying Κ factor are drawn from the potential maps. This includes delineation of sub-basins draining to the three separate lakes, Sø 326, Sø 233, and Sø 187 (Fig. 4). The results show that subglacial drainage is rather insensitive to changes in the Κ factor. The drainage area and the sub-basins are nearly constant for values from Κ = 0.0 to Κ = 0.5. For Κ = 0.7, there is a slight increase of drainage area in the north-eastern part of the basin, and for Κ = 1.0 this tendency is further reinforced but with a marked change in configuration of sub-basins.
Area sums of surface-drainage cells are used for calculations of surface run-off draining through moulins to the individual subglacial sub-basins (Reference Braithwaite and ThomsenBraithwaite and Thomsen 1989, this volume). The run-off calculations suggest that the K factor under present conditions has values between 0.0 and 0.7, which is in reasonable agreement with measurements of subglacial water pressures made elsewhere (Reference HodgeHodge, 1976), with best agreement between observations and run-off model for Κ = 0.7 (Fig. 4).
Hot-Water Drilling
The mapping and modelling work was followed by drilling, so as to check ice-thickness data obtained by radio echo-sounding and to investigate thermal and hydraulic conditions in and beneath the ice. This involved development and construction of a new hot-water jet drill, which was tested in August 1987. A detailed description of the drill equipment and of the test can be found in Reference Olesen and ClausenOlesen and Clausen (1988).
The central part of the drill consists of two units, a power unit and a heating unit. The power unit is a 6 kW four-stroke gasoline engine with reduction gears connected to a 0.4 kW, 220 V generator and a piston pump capable of delivering 18 dm3/min of water with a pressure of up to 100 bar. Fuel consumption is 2.5 dm3/min and the total weight of this unit is 79 kg. The heating unit is a water-circulation coil with a burner modified for the use of jet-Al fuel. Fuel consumption is 11.6 dm3/h, corresponding to 113 kW, and the weight is 127 kg.
During the drilling, eight deep holes were made with depths ranging between 270 and 383 m and totalling 2436 m. Of these eight holes, five went to the bottom of the ice, the positions of two were uncertain, and one definitely stopped in the ice. The mean drill speeds were 5.2 m/min for the upper 100 m and 3.3 and 2.1 m/min for depths of 100–200 m and 200–300 m, respectively. No corrections have been attempted to compensate for difficult drilling conditions when the drill penetrated layers of debris-laden ice which exerted a considerable slowing effect on the drilling speed.
Comparisons between ice thicknesses measured by radio echo-sounding and that present in the drill holes are satisfactory, with a mean difference of 7%. The radar-measured thickness was read by interpolation between computer-generated contours based on a 100 m grid of filtered data. In two of the holes, thermistor strings were mounted to measure the ice temperature, as mentioned earlier. No attempts were made to monitor water-pressure variations in the holes at this stage of the investigations, but this is planned for the 1988 field season.
Conclusion
Historical documentation through aerial photography shows an overall stability of the supraglacial water-drainage pattern of the area over the last 37 years.
The combined information from mapping and mathematical model calculations of subglacial conditions shows a limited sensitivity in predicted water-drainage areas to changes in hydraulic conditions expressed in terms of a factor relating subglacial water pressure to ice overburden.
The experience gained through these investigations provides the basis for setting safer limits when planning a hydro-electric power plant in Paakitsup Akuliarusersua, and gives us a better general understanding of glacier hydrology from a continuous ice cover such as the Greenland ice sheet.
Acknowledgements
This paper is published by permission of the Director, The Geological Survey of Greenland. The work is part of a study of the feasibility of hydro-electric power for Ilulissat, which was partly funded by the European Economic Community (EEC) through the European Regional Development Fund, and partly by the former Ministry for Greenland, Denmark.


