


1. Introduction
Crevasses are characteristic fissures in a glacier surface that increase surface area and surface roughness (Van der Veen, Reference Van der Veen2008; Colgan and others, Reference Colgan2016). Crevasses form when stress induced by dynamic forces exceeds ice strength. Primarily, brittle failure of the ice occurs due to tensile stress with fracture orientation perpendicular to ice flow, but failure can also occur under shear stress, resulting in flow-parallel fractures. In mountain settings, variability in the glacier stress regime, due to downslope flow or lateral spreading when unconfined by valley walls, results in varied and complex crevasse patterns (Hooke, Reference Hooke2005; Van der Veen, Reference Van der Veen2008). During winter in the accumulation area, crevasses are buried with snow but are then re-exposed the following melt-season.
Crevasses have been reported to pool cold air (Holdsworth, Reference Holdsworth1969; Bhardwaj and others, Reference Bhardwaj, Sam, Singh and Kumar2016) which could enhance atmospheric stability above the glacier surface, reducing melting associated with vertical turbulent heat transfer. However, recent investigations of snow surface temperature using infra-red cameras reveal that crevasse surface temperatures (Aubry-Wake and others, Reference Aubry-Wake2015) and temperatures recorded in snow surface depressions (Purdie and others, Reference Purdie, Katurji, Datta and Zawar-Reza2017) can be higher than surrounding air temperature. Warmer temperatures combined with greater surface area and turbulence-inducing roughness mean that crevassed regions could provide, through a turbulent heat flux away from the crevasse, warmer air relative to the wider glacier area and increase melt rates compared to non-crevassed regions of a glacier (Fig. 1).
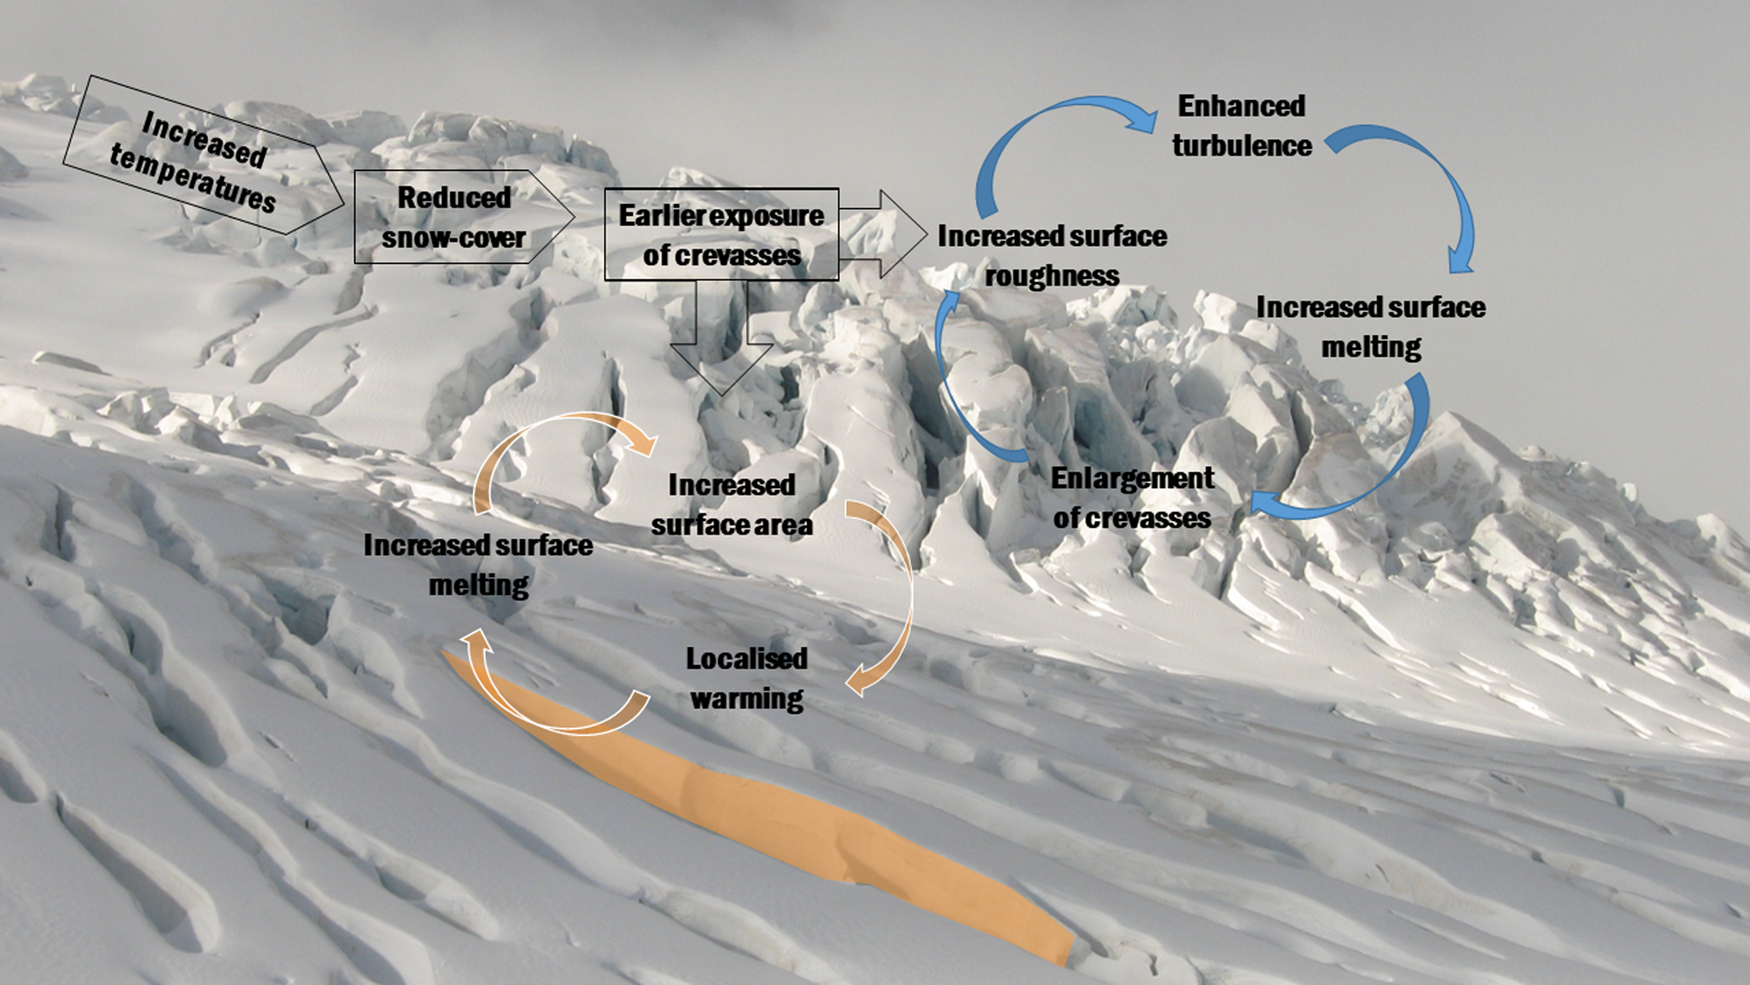
Fig. 1. Potential influence of crevasses on the energy balance of a glacier. Background photo crevasses in the Tasman Glacier accumulation area. Photo J. Thompson.
In alpine regions the mass balance of a glacier is determined by net snow accumulation and snow and ice ablation (primarily melting) (Cuffey and Paterson, Reference Cuffey and Paterson2010). The surface energy balance (SEB) of a glacier is a key determinant of how much snow and ice is transformed into meltwater annually. Net radiation has been identified as a key source of energy for melting (Gillett and Cullen, Reference Gillett and Cullen2011), especially in glacier accumulation areas (Kelliher and others, Reference Kelliher1996). Crevasses increase the surface area of a glacier which will in turn increase the area over which heat and momentum exchange can occur. In theoretical modelling with ‘simple V-shaped’ crevasse geometries, crevasses are found to enhance melting relative to a flat surface, due to increased ice surface area for absorption of incoming solar radiation (Pfeffer and Bretherton, Reference Pfeffer and Bretherton1987; Cathles and others, Reference Cathles, Abbot, Bassis and MacAyeal2011). However, both studies simplified crevasse geometry, which although potentially appropriate for crevasses found in glacier ablation zones, are not particularly good representation of crevasses in the accumulation area of alpine glaciers. In these regions, crevasse walls tend to be more vertical (sometimes overhanging) and their morphology more complicated (Fig. 2).
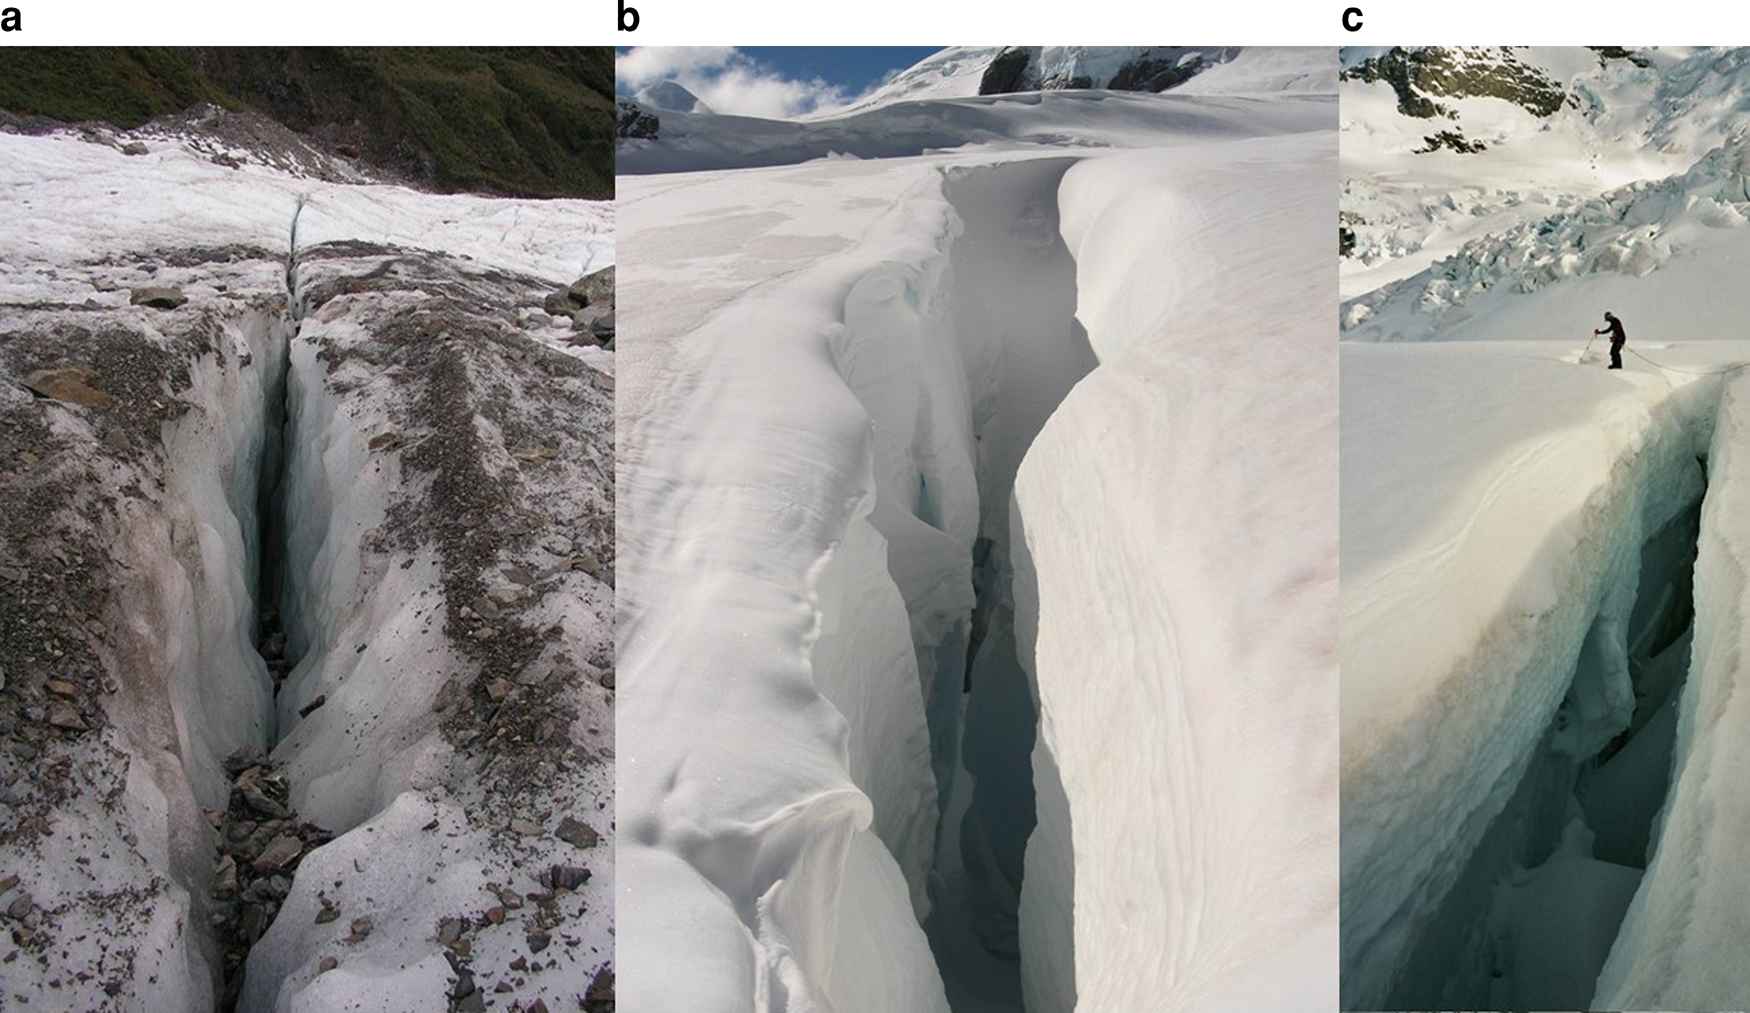
Fig. 2. While crevasses in the ablation area (a) can potentially be represented by a ‘v-shape’, in the accumulation area of alpine glaciers crevasse morphology is more complex (b and c), including overhangs, bulges and wider cavities at depth. Photos H. Purdie.
In maritime climates, turbulent heat fluxes have also been identified as a significant source of energy for snow and ice melt (Anderson and others, Reference Anderson2010; Conway and Cullen, Reference Conway and Cullen2013; Dadic and others, Reference Dadic2013). Turbulent heat fluxes are enhanced by an increase in aerodynamic roughness, which impacts wind shear dynamics within the roughness boundary layer (the layer of the atmosphere immediately interacting with the glacier surface) (Stull, Reference Stull1988). Aerodynamic roughness length plays a major role in modulating the turbulent fluxes, and its increase by one order of magnitude can increase the turbulent heat flux by a factor of two (Stull, Reference Stull1988; Hock, Reference Hock2005). As a consequence, using assumed roughness lengths for ice (e.g. 1 mm) can result in underestimating turbulent fluxes (and thereby ice melt) (Fitzpatrick and others, Reference Fitzpatrick, Radić and Menounos2019). Field experiments have demonstrated that changes in millimetre-scale aerodynamic roughness length varies spatially and temporally as the glacier surface evolves (at the metre scale) between ice and snow cover (Fitzpatrick and others, Reference Fitzpatrick, Radić and Menounos2019, Fig. 14). Many studies have explored these processes in glacier ablation zones as seasonal snow melts exposing glacier ice (Oerlemans, Reference Oerlemans2001; Brock and others, Reference Brock, Willis and Sharp2006; Anderson and others, Reference Anderson2010; Guo and others, Reference Guo2011; Smith and others, Reference Smith2016). Crevasses in the ablation zone create a distinct hummocky surface, resulting in aerodynamic roughness lengths in excess of 10 mm (Smeets and others, Reference Smeets, Duynerkr and Vugts1999; Brock and others, Reference Brock, Willis and Sharp2006). To accommodate this variability, a number of SEB models apply different roughness lengths for snow and ice surfaces to capture the seasonal transition (e.g. Anderson and others, Reference Anderson2010). However those same SEB models tend to treat the accumulation areas as relatively homogeneous surfaces, and while wind complexity and its influence on the turbulent fluxes has been examined (Dadic and others, Reference Dadic2013; Fitzpatrick and others, Reference Fitzpatrick, Radić and Menounos2019), little is known about how ‘inverted’ roughness created by crevasse exposure in the accumulation area might influence the turbulent fluxes. As the climate is warming, snow cover on alpine glaciers is thinning (Vaughan and others, Reference Vaughan, Stocker, Qin, Plattner, Tignor, Melinda, Allen, Boschung, Nauels, Xia, Bex and Midgley2013; Purdie and others, Reference Purdie2015) resulting in earlier exposure of crevasses and increased surface roughness each summer (Ritter and others, Reference Ritter, Fiebig and Muhar2012; Hammond and Pelto, Reference Hammond and Pelto2015; Purdie and Kerr, Reference Purdie and Kerr2018).
Over the years there has been much interest in the morphological dynamics of crevasses, with less attention focused on the influence of crevasses on mass balance (Colgan and others, Reference Colgan2016). Relatively little is known about the thermodynamics of crevasses and in particular, how air temperature evolves throughout the day inside a crevasse (Colgan and others, Reference Colgan2016). Previous efforts to measure temperature within crevasses have taken place in polar environments, where even in summer months, air temperature is predominantly below zero degrees Celsius (Cook, Reference Cook1956; Pings, Reference Pings1961; Harrison and others, Reference Harrison, Echelmeyer and Larsen1998). Automated mapping of crevasses using the thermal bands from satellite sensors (Bhardwaj and others, Reference Bhardwaj, Sam, Singh and Kumar2016) or near-target thermography (Aubry-Wake and others, Reference Aubry-Wake2015) only measures surface brightness temperature. These data, while informative for SEB studies, do not extend understanding of the potential dynamic interactions between the crevasses interior atmosphere and the atmospheric roughness boundary layer of the glacier.
We hypothesise that current mass-balance models underestimate ablation in accumulation areas of alpine glaciers because the influence of crevasses on the atmospheric roughness boundary layer typically goes unaccounted over both time and space. We present air temperature and wind speed data collected from within crevasses in the accumulation area of an alpine glacier, and compare these data to temperature and wind speed data collected simultaneously on the adjacent glacier surface. Meteorological drivers of identified temporal variability of the ‘in-crevasse’ atmosphere are explored. Finally, we introduce a conceptual frame work that considers crevasses as a potential heat exchange structure, and a case is made to give crevassed regions more attention when determining the mass balance of alpine glaciers.
2. Study site
Haupapa/Tasman Glacier (hereafter Tasman Glacier) is a maritime glacier in the Southern Alps of New Zealand (Fig. 3). It is the largest glacier in this mountain range (Baumann and others, Reference Baumann2020), containing ~1/3 of New Zealand's total ice volume (Chinn, Reference Chinn2001). The Tasman Glacier is an ideal site for this process-based study as it has been the location of a number of previous mass-balance measurements (Chinn, Reference Chinn1994; Purdie and others, Reference Purdie and Kerr2018), including surveys of net accumulation via the crevasse stratigraphy method (Ruddell, Reference Ruddell1995; Purdie and others, Reference Purdie, Anderson, Lawson and Mackintosh2011). In this maritime environment, large annual snow accumulation is offset by high summer melt rates, including annual loses of 1.2 m w.e. in the accumulation area (Purdie and others, Reference Purdie and Kerr2018). Repeat survey of the end-of-summer snowline indicates that over the last two decades, the mass balance of the Tasman Glacier has been predominantly negative (Willsman and Macara, Reference Willsman and Macara2020; Lorrey and others, Reference Lorrey2022).

Fig. 3. (a) Location of Tasman Glacier in the South Island of New Zealand, (b) Orthophoto of 2020 study site obtained by RPAS (drone) survey showing location of sampling equipment and highlighting 2021 study site (black box), (c) Tasman Glacier highlighting the 2020 study site in the accumulation area (red box), (d) Orthophoto of 2021 study site obtained by RPAS (drone) survey showing location of sampling equipment.
Note: The variability in end-of-summer conditions in regards to crevasse exposure in 2021 (d) compared to conditions in 2020 (b), red box shows the area used for hill-shade analysis (Fig. 9).
In alpine regions, crevasses in glacier accumulation areas undergo a seasonal cycle of concealment and exposure, driven by annual precipitation patterns. Although snow can occur in the mountainous regions of New Zealand at any time of year, it tends not to persist and accumulate until April/May, with the onset of snowmelt occurring October/November (Porhemmat and others, Reference Porhemmat, Purdie, Zawar-Reza, Zammit and Kerr2021). Consequently crevasse exposure tends to begin late November with maximum exposure occurring often by late February, but this pattern varies from year-to-year (Purdie and Kerr, Reference Purdie and Kerr2018).
Two field campaigns were conducted, one in late February 2020 and the second in early March 2021 (Table 1). In 2020 crevasses were well exposed at the surface as expected in late summer in the Southern Hemisphere. However, the glacier surface was unusually discoloured due to the impact of Australian bushfires which occurred early in the new year (Hansen, Reference Hansen2020; Pu and others, Reference Pu2021; Fig. 3b). The summer of 2021 was characterised by small, frequent, snowfall events, so despite a 2-week delay to the field campaign, a number of crevasses were still partially (or fully) snow-filled (Fig. 3d).
Table 1. Details of crevasse temperature samplers and automatic weather stations (AWS) deployed in the 2020 and 2021 field campaigns

Projection of location coordinates is New Zealand Transverse Mercator.
3. Method
3.1 Temperature inside crevasses
To sample air temperature inside crevasses in the accumulation area, specially designed samplers were constructed utilising Hobo MX2303 temperature loggers, each with two external temperature sensors, mounted inside radiation shields. In 2020, the sensors were attached at 0.5 or 1 m intervals to a series of interconnecting plastic (PVC) poles (Fig. 4), while in 2021 they were attached to a rope ladder suspended from a PVC pole. The change in 2021 to a lighter design made the sampler easier to install even in crevasses with narrow openings. The profilers were up to 13 m long with capacity to add additional sensors to extend their length if required. Data were recorded at 1 min intervals. Table 1 provides details of each crevasse sampler.
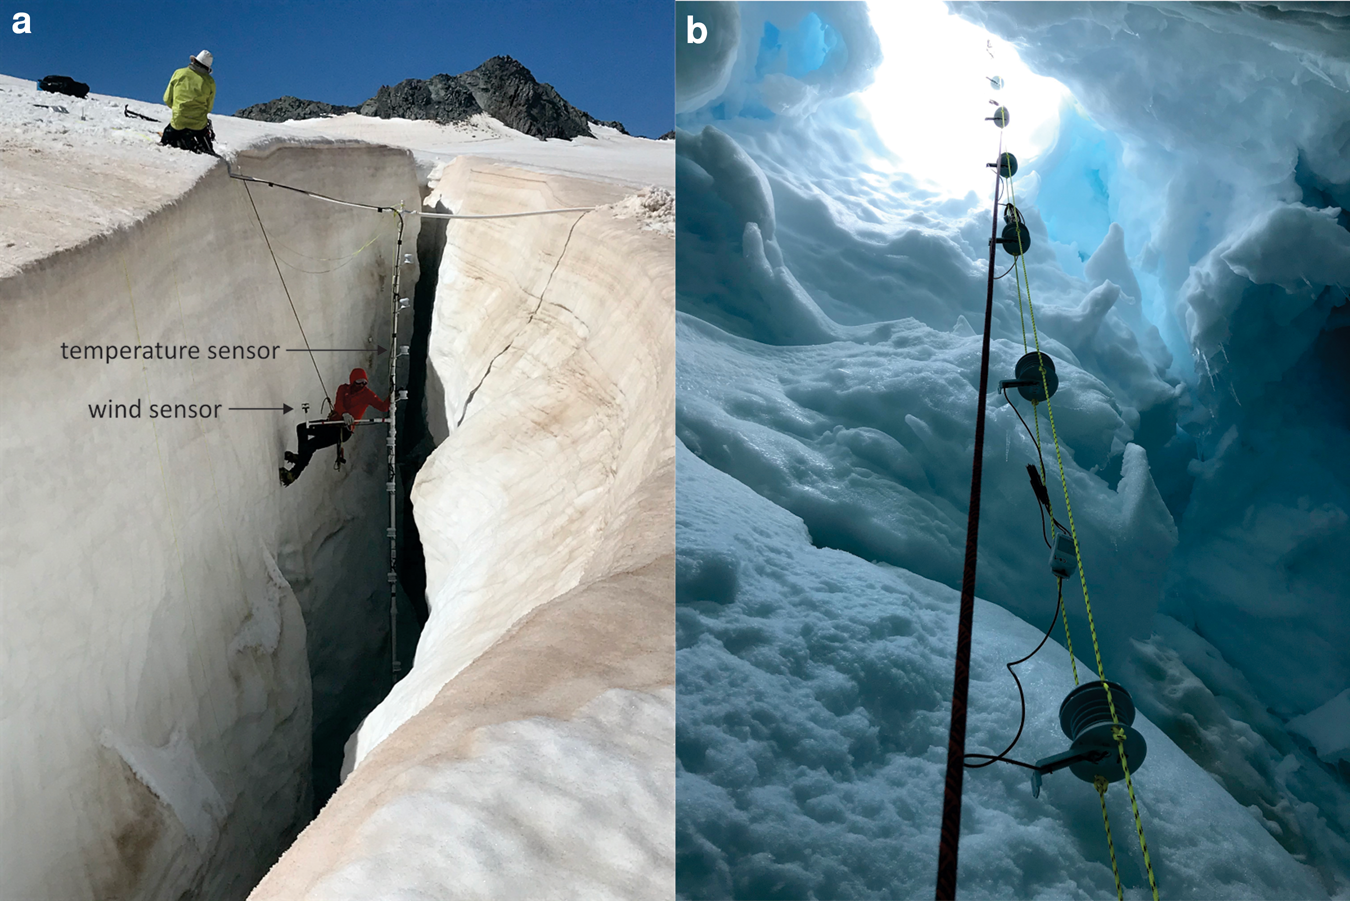
Fig. 4. Installation of temperature samplers in the accumulation area of Tasman Glacier in (a) 2020, and (b) 2021, crevasse C. Photos H Purdie.
Prior to field deployment, the temperature sensors were cross-calibrated while co-located in an internal room over a 24 h period to check for consistency. The average std dev. of the calibration data across all 20 sensors was 0.17°C, with individual sensor std dev. ranging from 0.09 to 0.20°C. These results were within the estimated accuracy of ±0.25°C as specified by the manufacturer. When comparing average temperatures recorded by the sensors over time, most were within ±0.1°C of the mean. However, two sensors were slightly warmer (0.16 and 0.17°C) and one was cooler (0.22°C). These three sensors were bias-corrected prior to data analysis.
We acknowledge that measurement of air temperature using naturally ventilated multi-plate radiation shields can be subject to error due to direct and indirect radiative heating, especially over highly reflective surfaces (Huwald and others, Reference Huwald2009). Over surfaces with high albedo, shortwave radiation can be reflected into radiation shields, and if wind speeds are low, sensor heating occurs. Based on a study comparing temperatures recorded by a range of sensors over a glacier surface, Huwald and others (Reference Huwald2009) developed a formula for correction (refer to their Fig. 8b). Applying this correction to temperature data collected at AWS on the glacier surface indicates that temperatures may have been overestimated on average by ~0.7°C and during daylight hours, with a maximum error of 2.1 and 4.2°C in the 2020 and 2021 seasons respectively (Supplementary 1). Temperature sensors installed inside the crevasses would also likely be subject to some radiative heating, especially near surface sensors in crevasses with larger openings, which allow for greater solar radiation penetration. However, any attempt to correct for this would require a number of assumptions, including timing of solar radiation exposure, incident angle, angle of reflectance and wind speed at multiple depths. While solar illumination of the larger crevasse catchment can be modelled, and reflected radiation was measured on the glacier surface (see section 3.4), we are unable to account for in-crevasse shading (and radiation reflection angles) due to the complex roughness of the crevasse walls (Fig. 4). Therefore we choose here to report raw data values for all temperatures measured, but give consideration to this potential error when reporting and discussing results herein.
3.2 Wind speed inside the crevasse
In 2020 wind speed was measured inside the crevasse using two Trisonica Mini 3D sensors (Anemoment, 2020), which were mounted on the crevasse pole at 2.5 and 10.25 m depth. These sensors logged at 20 Hz from which 1 and 10 min averages were calculated. The wind sensors were mounted on an arm that extended 1 m from the main pole and aligned parallel to crevasse walls (Fig. 4a). Unfortunately our crevasse sampler collapsed near the end of a storm during this first field season resulting in damage to the Trisonica Mini 3D sensors, which rendered them unavailable for the 2021 field season.
3.3 Meteorological conditions on glacier surface
During each field campaign, meteorological parameters on the glacier surface were recorded by nearby automatic weather stations (AWS) (see Fig. 3 and Table 1). Each AWS was equipped with two Young Response ONE sensors (Young, 2020) measuring air temperature, relative humidity, wind speed and direction, and an Apogee SN-500 (Apogee Instruments, 2020) all-wave radiometer measuring short and longwave radiative flux (see Table 1 for sensor heights). Data were sampled each minute and logged as 10 min averages. The accuracy of the temperature sensors in these all-in-one units is estimated to be ±0.30°C. When making comparisons between the surface air temperature and crevasse air temperature, we combined the estimated accuracy of both sensors, thereby deriving an error of ±0.5°C. As highlighted in section 3.1 this error is likely to further increase during cloud-free periods with low wind speeds for sensors exposed to direct solar radiation. The shorter deployment of the AWS in 2020 compared to the crevasse sampler was due to the disassembly of the AWS prior to the arrival of a large storm on the afternoon of 27 February, which persisted through till the early hours of 29 February.
3.4 Data analysis
Polar plots and correlation matrices were created in R and Pearson correlations (two-tailed and cross-correlation) were undertaken using the statistical software SPSS to explore statistical relationships between in-crevasse temperatures and meteorological conditions at the glacier surface. Correlation analysis initially utilised all 10 min data and then was repeated with daytime only data (8:00–22:00 h) for shortwave radiation and wind variables. Cross-correlation was used to explore lags between shortwave radiation as recorded at the surface and in-crevasse temperature change at depth. To further understand the relationships between net shortwave radiation and in-crevasse temperature a hill-shade analysis was undertaken using a Geographical Information System (GIS). Input data were sun altitude and azimuth, derived from www.sunearthtools.com for each site and time period, and high-resolution digital elevation models created from a Remotely Piloted Aerial Survey (RPAS) and Structure from Motion (SfM) analysis using Agisoft Metashape software (Agisoft, 2021). The output is an image of surface illumination where a pixel value of 0 represents full shade and 255 full illumination.
4. Results and interpretation
4.1 Variability of temperature inside the crevasses
In 2020 the four days over which sampling took place captured a range of weather conditions (Table 2), which generated different crevasse atmospheric temperature profiles (Fig. 5). There was a statistically significant (p < 0.01) and strong correlation (Pearson correlation > 0.5) between air temperature recorded on the glacier surface and air temperature inside the crevasse to a depth of 6 m (Fig. 6a and Supplementary 2 for full correlation results). Air temperatures inside the crevasse were mostly positive, and of the small number of negative temperatures recorded none were colder than −0.05°C. On clear sunny days there was a distinctive thermal lag (Fig. 5a). Out-of-crevasse air temperature peaked around midday, but temperature inside the crevasse peaked progressively later at depth, reaching a maximum temperature at the bottom of the crevasse (12 m depth) at around 17:30 (Fig. 5a). During the period of simultaneous temperature measurement in and out of the crevasse, we found that temperature inside the crevasse exceeded out-of-crevasse air temperature at 1.7 m (AWSr) for a total of 9 h. The first occurrence was on 25 February between 15:00 and 19:30 and the second on 26 February between 13:00 and 18:00. These warming events were confined to the two occasions on which sunny clear sky conditions prevailed (Table 2). While these phenomena mostly affected the top 4 m of the crevasse, we did record warming down to 12 m at 17:30 on 25 February (Fig. 5a). This appeared a somewhat anomalous event, as we did not observe this degree of warming at 12 m depth the following day, in which atmospheric and weather conditions were similar. Photographs taken at the field site from the ground and from the RPAS confirmed that the lower section of the crevasse remained in shade. Maximum sun penetration occurred at ~17:30 (on clear days) but even then crevasse morphology meant that only sensors in the upper wider section of the crevasse were exposed to the sun (i.e. the top 5–6 m). This late afternoon warming spike did immediately follow an increase in both surface and in-crevasse wind speed, and N shift in wind direction, so it is possible this anomaly is related to the redistribution of heat inside the crevasse (also see section 4.3). During clear weather there is a noticeable stratification of temperature at ~5–6 m depth especially during the evening (Fig. 5a). We acknowledge that the temperature stratification in the upper 5–6 m was likely enhanced by sensor heating on clear sunny days, but note that stratification was also observed at times when solar radiation was not a factor (e.g. 26 February, 23:00). We therefore consider that our data do show heating of air in the upper portion of the crevasse. This stratification also breaks down as the storm arrives around midday on 27 February (Fig. 7a).

Fig. 5. (a) Air temperature (AWSr) and in-crevasse temperature (2020) at different heights (depths) (colour pallet) plotted with overlay of net shortwave radiation (black line), (b) wind speed inside (blue) and outside (red) of the crevasse and (c) wind direction, with crevasse orientation bottom right.

Fig. 6. Correlation matrix of relationships between temperatures in and out of crevasses with net shortwave radiation in (a) 2020, showing results for surface temperature (T_1.66, T_0.4) and in-crevasse temperature (Cr 0.5-Cr12) and (b) 2021, showing results for surface temperature (T_2.5, T0.6) and in-crevasse (B) temperature (B0-B10). The pink stars and font size of correlation coefficients indicate level of significance where one, two and three stars mean that the corresponding variable is significant at 10, 5 and 1% levels.

Fig. 7. Comparison of temperatures during different synoptic situations. (a) Surface and in-crevasse temperatures during the full study period in 2020. (b–g) Instantaneous snap-shots of vertical air temperture inside the crevasse during different weather conditions.
Note: The shorter duration of the surface temperature dataset in (a). (b–g) Clear sky (sunny) conditions occurred on the 26 February, cloudy 27 February and stormy on 28 February.
Table 2. Summary of general weather conditions during each field campaign

Instantaneous atmospheric temperature within the crevasse taken at the same time on three different days in 2020 demonstrated how the vertical temperature profile varied with different weather conditions (Figs 7b–g). Large diurnal fluctuations occurred on clear sunny days, for example, the daily temperature range was 7.3°C at 1 m depth and 3.5°C at 11 m depth (Figs 7b–g). During cloudy conditions, temperatures were less variable, and a relatively homogeneous temperature structure can be seen inside the crevasse most of the day (Figs 7b–g). However, this structure is seen to break-down once the storm strengthens on the evening of 27 February (Fig. 7g – cloudy). The storm, which dominated conditions on 28 February, was a weather system from the north-west, meaning it was relatively warm and associated with significant precipitation (408 mm rain in 24 h). The vertical temperature profile changes little throughout the storm, and although there are a greater range of temperatures within the crevasse compared to the cloudy day, the variability is not as large as recorded during sunny conditions. Figure 7 provides six snap-shots in time of the in-crevasse vertical temperature structure during different weather conditions, and while differences were revealed, a longer time series would be required in order to extrapolate these results more broadly.
Weather conditions during the shorter 2021 field campaign were less variable than in 2020 (Table 2). The 2-week delay of the field campaign did not result in a significant difference in the range of temperatures recorded at the AWS on the glacier surface (Supplementary 3), with an upper mean daily temperature of ~6°C in both seasons. Inside the crevasses, the daily temperature pattern was also similar to that recorded in 2020 during sunny, calm conditions. Air temperatures were warmer inside the widest crevasse (A) (Fig. 8a, Table 1), with a thermal lag at depth. As observed in 2020, the deepest penetration of incident radiation into this widest crevasse occurred at ~17:30 when the sun was lower in the western horizon. The NW orientation of crevasse A meant that even in the middle of the day, only the top-most sensors received direct sunlight due to shading from the up-glacier crevasse wall. Daily temperature increases were more subdued in crevasses B and C (Figs 8b, c), which had increasingly smaller openings (Table 1 and Fig. 4b). Even though crevasses B and C had a more WNW orientation, which would potentially expose them to greater solar radiation penetration later in the day, their small surface openings meant that only the top 2 sensors received direct sunlight. Crevasse D was closed to the atmosphere and temperatures ≤2 m depth were close to 0°C throughout with only the upper 3 m showing small diurnal variations (Fig. 8d).

Fig. 8. (a) Air temperature (AWS2) and in-crevasse temperature (2021) at different heights (depths) (colour pallet) plotted with overlay of net shortwave radiation (black line) for crevasses A–D (a–d), (e) surface wind speed a measured at two heights and (f) wind direction, with crevasse orientations bottom right.
In 2021 there was also a statistically significant (p < 0.01) strong correlation (Pearson correlation > 0.5) between air temperatures recorded at AWS on the glacier surface and in-crevasse air temperatures (Fig. 6b and Supplementary 4–7). In crevasses A, B and C this relationship extended to at least 10 m depth but in the closed crevasse (D) the relationship only held down to 3 m depth. Observations of in-crevasse air temperatures recorded in the widest crevasse A in 2021 were positive 39% of the time and exceeded out-of-crevasse air temperature measured at 2.5 m above the surface (AWS1) for a total of 9 ½ h. This generally occurred between midday and 19:00, and only affected the upper 3 m of the crevasse, with the exception of a short 40 min interval on 12 March ~17:00 when the warming reached 4 m depth (Fig. 8a). In the narrower crevasse B (Fig. 8b), in-crevasse air temperatures were also positive 36% of the time, but only the sensor at the very top of the crevasse (B0) exceeded the AWS temperature at 2.5 m. Temperatures inside crevasse C (Fig. 8c), which had a narrow opening but wider cavity at depth (Table 1), were positive 27% of the time but values never exceeded the air temperature at AWS2. Temperatures inside crevasse D did not exceed nearby air temperatures, but they were predominantly positive with an average temperature of 0.24°C (Fig. 8d and Table 1).
4.2 Influence of radiation parameters on temperature
Each field season had distinctly different surface albedo properties. In 2020, deposition from the Australian bushfires resulted in an average surface albedo of 0.4 (Fig. 3b), while in 2021, frequent summer snowfall meant that average surface albedo was 0.6 (Fig. 3d). In both field seasons all net radiation was strongly correlated with shortwave radiation at all AWS sites (Pearson correlation > 0.99) (Supplementary 2, 4–7), which was not unexpected given the mostly cloud-free conditions during the field campaigns. Net longwave radiation measured at the surface was negatively correlated with in-crevasse temperatures at all crevasses (Supplementary 2, 4–7). Due to the dominance of clear-sky conditions during AWS data collection, net longwave was always an energy sink rather than a source.
A comparison of air temperature in and out of the crevasse with net shortwave radiation in 2020 shows warming in the upper region of the crevasse appeared to correspond with peak radiation, but the warming deeper in the crevasse did not occur until surface radiation was already in decline (Fig. 5a). During cloud-free conditions, solar radiation was received at the site from 07:30 until 20:00, but as noted above, the east-west orientation of the crevasse meant more radiation penetrated into the crevasse later in the afternoon as the sun progressed westwards (Fig. 9). Crevasse morphology and irregularities of the crevasse walls prevented solar radiation penetration at depth (section 4.1). We also observed asymmetry of crevasse walls, with the down-glacier (north facing) wall of shallower angle, indicating it was subject to greater ablation rates than the shaded up-glacier wall (Fig. 4a). Positive correlations between net shortwave radiation and air temperature (surface and in-crevasse) were only significant down to 6 m depth (Fig. 6a and Supplementary 2). Cross-correlation analysis between net shortwave radiation and in-crevasse temperatures lagged at 10 min intervals found stronger correlations with increasing time lags at greater depths (Supplementary 8). For example, near the surface, the strongest correlations occurred with no lag between the two variables, at 2–3 m depth the strongest correlation (Pearson correlation ≥ 0.83) was when in-crevasse temperature lagged shortwave by 1 h, and at 5 m depth the strongest correlation (Pearson correlation = 0.75) occurred when crevasse temperature lagged shortwave radiation measured at the surface by 2 h.

Fig. 9. Modelled changes in crevasse illumination under clear-sky conditions 13:00 and 17:00 h in 2020 and 2021, where 255 = full illumination. White circles denote locations of crevasse samplers and red circles AWS locations. Also refer to Figure 3 for specifics on instrumentation and 3 d for the area covered by hill shade analysis.
Note: That even though total irradiation has decreased by 17:00 h, there is more penetration into the crevasses later in the day due to their east-west orientation.
In 2021 net radiation values were lower due to the decreased solar zenith associated with the later timing of the field campaign (Figs 8, 9), and although we still observed a lag between peak net shortwave radiation and in-crevasse temperatures (Figs 8a–c), statistical relationships were weaker with surface air temperature and in-crevasse air temperature (Fig. 6b). Cross-correlation analysis between net shortwave radiation and lagged in-crevasse temperatures at crevasses B and C found the strongest relationship (Pearson correlation ≥ 0.8) in the upper 3 m of both crevasses with a 1.5 h time lag (Supplementary 8); below this depth the influence of shortwave radiation decreased. This result was not surprising given the much smaller opening of these crevasses and the fact that the majority of the temperature sensors in these two crevasses remained in shade throughout the day. At crevasse A, cross-correlation did not reveal any clear patterns, despite this being the widest crevasse sampled in 2021. We expect this might be related to the more complicated morphology of crevasse A, as here the upper temperature sensors were positioned in close proximity to a thin, partial, snow bridge (Table 1). The snow bridge partitioned the upper region of the crevasse, and had a NW orientation. This snow bridge would have created a strongly reflective surface, which may have resulted in sensor heating and masking of relationships.
4.3 Influence of wind speed on crevasse temperature
Given that the strongest relationship was found between air temperature over the glacier surface and in-crevasse air temperature, we further explore the role of turbulence on in-crevasse air temperature. In 2020 a comparison of out-of-crevasse near surface wind speed with in-crevasse wind speed found a statistically significant relationship between surface wind at 1.7 m and wind inside the crevasse at −2.5 m (Pearson correlation = 0.58, p < 0.01) (Supplementary 9). Negative correlations (Pearson correlation ⩽ 0.4, p < 0.001) were found between daytime (8:00–20:00 h) surface wind at 1.7 m and in-crevasse temperature down to ~3 m depth (Supplementary 10), indicating that during the day faster surface winds cool air temperature in the upper part of the crevasse. Inside the crevasse, weaker, although statistically significant positive correlations were found between temperature and wind speed, particularly between 5 and 8 m depth, indicating that at depth increased wind speed was associated with a warming trend of the air inside the crevasse. Although these relationships were strongest in the daytime only analysis, they were also observed in the full dataset (Supplementary 10).
Because we cannot determine with confidence what proportion of the temperature variability identified inside the crevasse during clear sunny weather might be attributable to radiative heating of our sensors, particularly the sensors nearer the surface, we show evidence for downward sensible heat flux to further explain in-crevasse temperature variability at times when solar radiation played no role (Fig. 10). Figure 10 focuses on conditions during the first night of the 2020 field campaign, from 20:00 25 February to 06:00 26 February. There is episodic penetration of warmer air into the crevasse associated with changes in the airflow dynamics at the surface. A detailed description is as follows; initially at 20:00 air above the glacier surface is cool with wind blowing from the NE. Wind speeds at the glacier surface are ~4 m s−1 and wind speed inside the crevasse starts to increase. Concurrently with the increase in wind speed, temperatures deeper inside the crevasse also increase. Warming of surface air occurs at ~22:00 when wind direction shifts to the N-NW. Warmer temperatures are then observed inside the crevasse down to 6 m depth, but as the in-crevasse wind speed drops we see the lower portion of the crevasse return to near zero temperatures. Throughout the night, warming (down to ~6 m depth) can be observed to coincide or closely follow peaks in surface wind speed. At ~03:30 26 February, wind direction at the surface changes to a more westerly flow, surface temperature increases and air warms inside the crevasse. The colder air at 10–12 m depth again warms, and wind speed both at the surface and at depth increases. So without the added complexity of daytime heating, we can more clearly observe how in-crevasse warming can occur due to downward turbulent sensible heat flux. This warming at depth was also observed during the storm on 28 February (Fig. 7a).

Fig. 10. Night time case study of 2020 (a) wind direction (AWSr) and (b) Surface (AWSr) and in-crevasse air temperature plotted with surface (AWSr) and in-crevasse wind speeds.
In general in 2020, during the times when wind speeds (inside and outside of the crevasse) are relatively low, there is stronger stratification of temperatures within the crevasse (e.g. midnight on 26 February), with noticeably colder temperatures in the bottom half of the crevasse (Figs 5, 10). Conversely, peaks in wind speed, especially wind inside the crevasse, are associated with warming (e.g. 05:00 and 11:30 on the 26 February). Wind direction at the surface appears to also influence the vertical temperature structure, in particular, when surface winds blow parallel to the crevasse (e.g. midnight on 27 February), generating a relatively homogeneous (well-mixed) temperature structure (Fig. 5). In both years the warmer temperatures inside the crevasses were associated with winds from the north-west (Figs 10, 11), which is the general down-valley glacier wind. In 2020 winds from the south-west produced noticeably cooler in-crevasse air temperatures (Fig. 11a).

Fig. 11. Relationships between wind direction, surface wind speed and in-crevasse air temperature in (a). 2020 from 1 to 12 m depth and (b) 2021, from 0 to 10 m depth (crevasse B).
In addition to comparing wind speed in and out of the crevasse, in 2020 we also compared wind speed (and wind direction) recorded at an AWS situated within the crevasse field (AWSr) with one situated on a smooth snow surface (AWSs). We found no statistically significant difference (paired t-test) in wind direction or surface wind speed between the crevassed and non-crevassed site. This was somewhat surprising as we expected wind speed among the crevasse field to have been lower than that recorded at the more open exposed site. However, given the short duration of the field campaign and generally light wind conditions recorded, it is likely that wind speeds were of insufficient strength to overcome boundary layer stability and generate significant turbulence (Oke, Reference Oke1987).
In 2021 wind speed was not measured inside the crevasses (section 3.3), therefore we can only compare in-crevasse air temperature with wind speed recorded at the AWS on the glacier surface immediately adjacent to the crevasses. At crevasse A, the in-crevasse air temperature had a statistically significant negative correlation (Pearson correlation ⩽ 0.4, p ≤ 0.01) with near-surface (0.6 m) wind speed to a depth of 3 m (Supplementary 4), indicating cooling with higher wind speeds; results reflective of 2020. However, we did not observe a switch to positive correlations at depth. At crevasses B (Fig. 11b) and C, the strongest relationship (positive correlation) with surface wind speed and daytime in-crevasse air temperature was recorded in the region where the crevasses narrowed towards the surface (e.g. 4–6 m depth) (Table 1). As recorded in 2020, small warm pulses inside crevasse B can be observed to coincide or follow spikes in surface winds (Fig. 8b specifically overnight on 12/13 March). In 2021 both the slowest and fastest wind speeds were associated with warmer in-crevasse air temperatures, while wind speeds in the range of 2–3 m s−1 were linked to the coldest in-crevasse air temperatures at all depths (Fig. 11b). Despite the lack of surface connection, crevasses B and C were connected below 6 m depth (Table 1), so it is possible that this mid-depth relationship between temperature and wind speed is associated with crevasse morphology and horizontal flow inside the crevasse.
5. Discussion
5.1 Meteorological influences on crevasse temperature structure
Prior to this study, information about air temperature inside crevasses was limited to a few studies in polar regions (Cook, Reference Cook1956; Meier and others, Reference Meier1957; Pings, Reference Pings1961, Reference Pings1962; Harrison and others, Reference Harrison, Echelmeyer and Larsen1998), and a small number of remote-sensing studies, which only capture ‘skin’ temperature (Aubry-Wake and others, Reference Aubry-Wake2015; Bhardwaj and others, Reference Bhardwaj, Sam, Singh and Kumar2016). Of the previous in-crevasse air measurements, positive temperatures were only reported on two occasions in midsummer on the Greenland ice sheet (Meier and others, Reference Meier1957; Pings, Reference Pings1961, Reference Pings1962). Here we have discovered that air temperature inside a crevasse in the accumulation area of a maritime glacier can be frequently above 0°C in summer and that this air can be as warm, or even warmer, than the air temperature over the glacier surface (Figs 5a, 8a). We also found that this warming can penetrate deep into crevasses, with temperatures in excess of 5°C recorded at 12 m depth in the widest crevasse sampled. Different synoptic weather conditions result in different vertical temperature structures inside crevasses. During clear sky conditions, there was large diurnal variability in air temperature inside the crevasse. Warming penetrated to the bottom of the crevasse, although there was a 5 h lag between peak surface air temperature and peak air temperature deeper inside the crevasse. Cloudy conditions resulted in a much more homogeneous vertical temperature structure, while stormy conditions also increased temperature variability in the upper regions of the crevasse (Figs 5, 7). These findings are important because it is common for researchers to use measured (or estimated) surface temperature to estimate melt rates on glaciers (Oerlemans, Reference Oerlemans2001), meaning that at times, energy-balance models will likely be underestimating melt in crevassed regions of the accumulation area.
Exploration of possible meteorological drivers to explain the observed in-crevasse temperature patterns found that at the widest crevasse, net shortwave radiation correlated strongly with in-crevasse temperatures, especially when a lag was applied to surface radiation data with increasing depth. Even so, this relationship was only statistically significant in the upper 5 m of the widest crevasse, and in narrower crevasses, only in the upper 3 m. The general east-west alignment of crevasses in the Tasman Glacier accumulation area means that there is higher radiation retrieval in the afternoon as incident radiation becomes increasingly oblique to the surface. Our experimental design meant that we were unable to determine whether a proportion of the warming recorded in the upper regions of the crevasses might be attributed to radiative heating of the sensors. However, many of the sensors were not exposed to direct solar radiation, and the warming of air inside crevasses was not just limited to times when solar radiation had a direct influence.
Peaks in wind speed, measured inside the crevasse and on the glacier surface, were often associated with warming and a break-down of the vertical temperature stratification inside the crevasse (Figs 5, 10). Therefore in addition to radiative heating of air inside crevasses, we have demonstrated how surface winds enable the transfer of sensible heat from the surface boundary layer down into the crevasse. A case study focusing on night-time temperature patterns demonstrated how warmer surface air could be advected into deeper, narrower sections of a crevasse, heating the entire in-crevasse air column (Fig. 10). We found that the effectiveness of this heat transfer was also related to wind direction, with the warmest night-time in-crevasse air temperatures associated with winds from the west to north-west (Figs 10, 11). The predominant synoptic flow in the Southern Alps is westerly (Sturman and Wanner, Reference Sturman and Wanner2001), which on interaction with local topography results in a generally NW glacier wind in the accumulation area of Tasman Glacier (Fig. 11). Winds blowing parallel to crevasse orientation (i.e. westerly) were found to be most effective at disrupting vertical stability inside the crevasse and enabling warming at greater depths. These results demonstrate that how effective crevasses will be at modifying glacier ablation will not only depend on seasonal snow cover variability, which influences the duration of crevasse exposure, but also on site-specific factors like crevasse orientation in relation to prevailing winds. Sensible heat transfer into crevasses will likely be less efficient at locations where the dominant glacier wind is perpendicular to crevasse orientation.
In the New Zealand Southern Alps, snow melt is associated with the eastward passage of anticyclones and frontal systems with approximately weekly periodicity (Neale and Fitzharris, Reference Neale and Fitzharris1997; Cutler and Fitzharris, Reference Cutler and Fitzharris2005). While the largest melt events are associated with northwest frontal systems, which bring relatively warm and large precipitation events (Marcus and others, Reference Marcus, Moore and Owens1985; Hay and Fitzharris, Reference Hay and Fitzharris1988; Cullen and others, Reference Cullen2019), anticyclones are the most frequent driver of glacier ablation (Gillett and Cullen, Reference Gillett and Cullen2011). Studies on New Zealand glaciers have found that both radiation (e.g. Hay and Fitzharris, Reference Hay and Fitzharris1988; Gillett and Cullen, Reference Gillett and Cullen2011), and the turbulent fluxes contribute significantly to the SEB (Anderson and others, Reference Anderson2010; Conway and Cullen, Reference Conway and Cullen2013). Here we found that while the net shortwave radiative flux was influential in the upper 3–5 m of the crevasses (depending on crevasse width and orientation) the sensible heat flux could distribute heat to greater depths thereby providing energy for melting throughout a crevasse. While it is generally recognised that globally, radiative fluxes are primary drivers for glacier melt (e.g. Hock, Reference Hock2005), there is increasing evidence that turbulent fluxes, associated with large-scale circulation phenomena, like atmospheric rivers, drive enhanced melt events on both alpine glaciers (Little and others, Reference Little, Kingston, Cullen and Gibson2019) and ice sheets (Fausto and others, Reference Fausto2016; Kuipers Munneke and others, Reference Kuipers Munneke2018). Atmospheric rivers are expected to increase in frequency as climate continues to warm, especially at mid-latitudes (Espinoza and others, Reference Espinoza, Waliser, Guan, Lavers and Ralph2018), meaning that relationships identified in this study between crevasses and the sensible heat flux could become increasingly important to future ice loss.
We also identified a significant negative correlation between net longwave radiation and in-crevasse air temperatures. However, due to the dominance of clear-sky conditions during AWS data collection, net longwave was always an energy sink rather than a source. Tasman Glacier is temperate, therefore the ice is at melting point, and by the end of summer, overlying snow is also relatively warm (e.g. −1°C). Because snow and ice cannot exceed 0°C, outgoing longwave radiation on temperate glaciers during summer is relatively constant at ~315 W m−2 (Hock, Reference Hock2005). Consequently it is common for the longwave flux to be negative, except for during cloudy conditions, when it can become an energy source (e.g. Oerlemans, Reference Oerlemans2010; Conway and Cullen, Reference Conway and Cullen2016).
5.2 Morphological influences on crevasse temperature structure
How wide the opening of a crevasse is affects its temperature structure, with greater air temperatures recorded inside the wider crevasses. Relationships identified between net shortwave radiation and in-crevasse air temperature indicate that shortwave radiation contributes to heating of air inside the crevasses, especially in the upper regions. Reflection of shortwave radiation from crevasse walls becomes a source of energy available to heat air inside the crevasse. As highlighted by Peffer and Bretherton (Reference Pfeffer and Bretherton1987, p. 192), crevasses act as solar radiation traps, allowing radiation to be absorbed at greater depths in the glacier. Wider crevasses have greater surface area over which energy transfer can occur. Our results support these previous theoretical studies that explored relationships between solar zenith and crevasse openings (Pfeffer and Bretherton, Reference Pfeffer and Bretherton1987; Cathles and others, Reference Cathles, Abbot, Bassis and MacAyeal2011), finding the strongest relationship between in-crevasse air temperature and net shortwave radiation at the widest crevasse with an orientation favourable to radiation retrieval. The slope, orientation and roughness of the crevasse walls, particularly in the upper sections, is clearly of influence to the amount of shortwave radiation absorbed (Fig. 9) and reflected, and crevasse morphology will also influence how easily longwave radiation, emitted from the ice surface, can escape. By sampling a range of crevasse morphologies (Table 1), representative of crevasses at different stages of exposure, we can postulate that as the melt season progresses and crevasses become more open, the ability of the crevasses to trap shortwave radiation becomes more pronounced (e.g. Figs 5a, 8a–d). At the wider crevasses, our field observations noted a distinct asymmetry of crevasse walls, indicating higher ablation rates on north-facing walls. A similar asymmetry was described and modelled by Cathles and others (Reference Cathles, Abbot, Bassis and MacAyeal2011) in the ablation area of the Greenland ice sheet, and Germain and Moorman (Reference Germain and Moorman2019) also recorded such asymmetry in the evolution of supraglacial streams. Such an asymmetry will in turn drive positive feedback as more gently sloping north-facing crevasse walls will have greater radiation retrieval resulting in more melting and thus leading to further widening of the crevasse. Consequently, the role crevasses have in modifying the SEB in glacier accumulation areas will have a distinct seasonal trend.
Different crevasse morphologies interacted differently with surface winds. At the widest crevasse sampled (2020), increases in wind speed were associated with air cooling in the upper regions of the crevasse but with air warming deeper in the crevasse. Crevasses with more complex morphologies, for example, those we found to be connected at depth but not at the surface, had more complex relationships between temperature and surface wind. Horizontal as well as vertical wind flow likely influence in-crevasse air temperature, and so future work could look to explore dominant in-crevasse wind flow in differing crevasse morphologies to better understand in-crevasse heat redistribution at varying depths.
Given the novelty of this research we have only the theoretical studies of Pfeffer and Bretherton (Reference Pfeffer and Bretherton1987) and Cathles and others (Reference Cathles, Abbot, Bassis and MacAyeal2011) with which to compare our results in a glacial context. However, a partial analogy to our work is research conducted on air temperature structures inside dolines in karst topography (Whiteman and others, Reference Whiteman, Haiden, Pospichal, Eisenbach and Steinacker2004). In this environment, sky-view was found to be the most important influence on radiative cooling, and vertical temperature gradients were found to vary seasonally (Whiteman and others, Reference Whiteman, Haiden, Pospichal, Eisenbach and Steinacker2004). Vertical temperature stratification with downward mixing was been recorded in the McMurdo Dry Valleys, using a pseudo-vertical temperature sensor network (Zawar-Reza and others, Reference Zawar-Reza2013, Fig. 3). In this setting, periods of increased wind speed drove top-down warming, while lower wind speeds favoured temperature stratification in the valley. For the time we were able to maintain wind speed measurement both in and out of a crevasse, we observed similar patterns. Although our dataset is too short to determine a potential threshold surface wind speed required to drive in-crevasse warming, we did observe a breakdown of vertical temperature stratification with surface wind speeds of only 3 m s−1. In general, the maximum speed of the glacier wind is found to occur at ~5–10 m above the surface, but wind speeds of 3–4 m s−1 are common nearer the surface (≤2 m) (Oerlemans, Reference Oerlemans2010). However, wind orientation in relation to the crevasse was also an important control on the effectiveness of heat redistribution into the crevasses.
5.3 Crevasses as drivers of positive feedback for glacier melt
Drawing on the results of this study we now revisit our conceptual model (Fig. 1), which considered how crevasses might modify the SEB in glacier accumulation areas. Depending on the size and shape of a crevasse, shortwave radiation heats air in the upper section of a crevasse, while deeper parts remain in shadow. However, sensible heat is also transferred from the surface into the crevasse by the glacier wind. Air flow inside a crevasse means that turbulent heat exchange can be directed horizontally (into and out of crevasse walls), as well as downwards into the glacier. Previous temperature observations within an ice mass immediately adjacent to a crevasse on the Greenland ice sheet (Meier and others, Reference Meier1957) confirmed the existence of a heat flux from the crevasse into the adjacent ice mass (Pings, Reference Pings1961, Reference Pings1962). We also conclude that on temperate glaciers where ice is at melting point, crevasses in the accumulation area can act as locations of temporary heat storage and will be undergoing surface melting which currently goes unaccounted in glacier mass-balance models. Multiple energy-balance studies conducted on glaciers around the world have found net radiation to be primary source of energy for melting, with the turbulent sensible heat flux the second most important energy source (Hock, Reference Hock2005). Crevasses significantly increase the surface area over which such heat exchanges can occur, but as demonstrated here, and in a previous modelling study (Pfeffer and Bretherton, Reference Pfeffer and Bretherton1987), the magnitudes of heat exchange will vary with varying crevasse geometry in relation to surrounding topography and the time of year, with the most significant impact generally occurring late in the melt season when crevasse exposure is greatest.
Climate warming is not only increasing average temperatures in alpine regions, but also leading to an increase in the length of the ablation season (Thibert and others, Reference Thibert, Eckert and Vincent2013). This means that crevasse exposure in glacier accumulation areas will increase, and crevasses will stay open (uncovered) for longer each year. So as crevasse surface persistence increases, so too will glacier melt. Previous research has highlighted important turbulent feedbacks associated with the greater surface roughness of ice compared to snow in glacier ablation areas (Oerlemans, Reference Oerlemans2001; Anderson and others, Reference Anderson2010). Crevasse morphology in the accumulation area differs from that in ablation (hard-ice) regions, as the crevasse roughness elements are contained below the surface. Unlike the hummocky surface of ice in the ablation zone, crevasses in flatter regions of an accumulation area have less ability to physically disturb wind flow over the surface. While our conceptual model also hypothesised enhanced turbulence in crevassed regions of the accumulation area (Fig. 1), we did not find evidence for this during our short field campaign. However, our results have demonstrated that even during relatively low wind speeds, warm air penetrates crevasses.
Although the primary focus of our conceptual model was to consider the potential impact crevasses have on ablation in glacier accumulation areas, we also observed how crevasses can temporarily store heat. Therefore it is possible that warm air, which has accumulated in crevasses during the day, could be redistributed to the glacier surface during cooler periods (i.e. overnight), thereby transforming the crevasse into a heat source rather than a heat sink. But in order for this to occur, there must be some turbulent exchange from air inside the crevasse towards the overlying boundary layer. While we have recorded downward advection of surface heat into crevasses, we have not as yet identified whether in-crevasse air flow can be orientated towards the surface in certain conditions. If this were to occur, it would have potential to further increase the role of crevasses on the glacier SEB.
6. Conclusions and future work
This study contributes to a deeper understanding of the role crevasses in the accumulation area of glaciers have on mass balance. We found that during summer, air temperature inside the crevasses was often positive and at times could exceed air temperature over the glacier surface. Greatest warming occurred in the widest crevasses and during clear-sky conditions, but full depth warming of crevasses could also occurred at night. Net shortwave radiation was found to be of influence to heating air in the upper regions of crevasses, but it was turbulent sensible heat transfer which was the most effective mechanism to drive warm air deeper into the crevasses. Consequently crevasses with an orientation that maximised radiation retrieval, and ran parallel to the dominant glacier wind, will have the greatest potential for warming and heat storage. As climate continues to warm, we envisage a positive feedback loop, where crevasses become exposed earlier in the melt season, from which time they are locations of increased heat absorption, which will lead to increased snow and ice melt. This in turn will enlarge the crevasses and further their impact on the glacier SEB.
Although we did not measure surface melting inside crevasses during this study, meteorological data collected supports our hypothesis that snow and ice melt in glacier accumulation areas will currently be under estimated in mass-balance models. In order to quantify this, our next step will be to develop a system to measure surface melting inside the crevasses. Preliminary attempts to install ablation poles into crevasse walls were unsuccessful. A 3-D model, created using a combination of structure-from-motion (from a remotely-piloted-vehicle) and a terrestrial laser scanner, has the potential to aid ablation estimation if dynamic change can be controlled for. In order to establish if crevasses can indeed become a heat source, further in-crevasse wind instrumentation will be required to better understand horizontal and vertical wind flows, and finally, trialling different temperature sensors to minimise radiative heating is also a priority.
Supplementary material
The supplementary material for this article can be found at https://doi.org/10.1017/jog.2022.73
Acknowledgements
This research is supported by the Marsden Fund Council from Government funding, managed by Royal Society Te Apārangi, grant number MFP-UOC1804; the Ministry of Business, Innovation and Employment (MBIE), New Zealand, grant number ANTA1801, and by the Royal Society of New Zealand grant number RDF-UOC1701. We also acknowledge the support of the Department of Conservation, University of Canterbury Te Whare Wānanga o Waitaha, School of Earth and Environment, Te Kura Aronukurangi, and Heliworks. We thank Justin Harrison and Arthur Schwing for technical support. Special thanks to Jane Morris IFMGA for field support.


 Open access