


Introduction
Late-life depression symptoms have been associated with an increased risk for dementia (Diniz et al., Reference Diniz, Butters, Albert, Dew and Reynolds2013). Most studies on this topic used the sum score on a screening instrument for depression, like the Geriatric Depression Scale (GDS-15), to assess depression severity. Such an operationalization rests on the idea that the total test score acts as an indicator of a single underlying condition (Borsboom, Reference Borsboom2005; Reise and Waller, Reference Reise and Waller2009). However, it has been firmly established that depression is a heterogeneous condition that involves distinct subdomains that each have their own relations to external variables (Fried, Reference Fried2015, Reference Fried2017; Fried and Nesse, Reference Fried and Nesse2015; Lux and Kendler, Reference Lux and Kendler2010; van Borkulo et al., Reference van Borkulo, Boschloo, Borsboom, Penninx, Waldorp and Schoevers2015a, Reference van Borkulo, Boschloo, Borsboom, Penninx, Waldorp and Schoevers2015b). This means that it is important to distinguish between different domains within depression instruments to study their relations with development of dementia.
In previous studies, which used factor analyses to make this kind of differentiation between subdomains among GDS-15 items, three of its items were identified as being specifically indicative for apathy symptoms rather than for depression symptoms (Adams et al., Reference Adams, Matto and Sanders2004; Kim et al., Reference Kim, DeCoster, Huang and Bryant2013). Apathy has originally been defined as a syndrome of lack of motivation featured by decreased goal-directed behavior, cognition and emotion (Marin, Reference Marin1991). Since apathy can manifest itself independently as well as occur in the context of depression, it is at least suboptimal to completely distinguish these groups of symptoms from each other in order to separately investigate their associations with dementia risk. Also, factor analyses treat symptoms as passive psychometric indicators of a latent variable, which implies this method is not naturally suited to study the hypothesis that development of psychopathology (or neurodegeneration) is driven by specific symptoms.
A potentially more suitable statistical approach to investigate the functioning of individual GDS items and the properties they measure is through network analysis. Network analysis models a construct like depression in terms of a set of symptoms that have direct interactions with each other. In this approach, this set of symptoms could as well include apathy symptoms. Therefore, network analysis can be used to explore pathways through the symptom network that may channel these interactions and thus may be specifically important to the relationship between depression symptoms and the development of psychopathology (Isvoranu et al., Reference Isvoranu, van Borkulo, Boyette, Wigman, Vinkers and Borsboom2017; van Borkulo et al., Reference van Borkulo, Boschloo, Borsboom, Penninx, Waldorp and Schoevers2015b). Thus, network analysis can be used to assess how these items and properties relate to the external variable dementia at follow-up. This allows to explore possible paths between development of dementia and individual GDS items that could further explain their association. Since functional status seems to mediate in the relation between both apathy as well as depressive symptoms with subjective cognitive impairment and amnestic mild cognitive impairment, we have also added a measure for level of physical disability in our analyses (Deutsch et al., Reference Deutsch, Tan, Fine, Llanes, Hantke and Zeifert2012).
With this method of network analysis in the present study we aimed to explore the network of GDS items and decreased functional status relative to dementia at follow-up. In order to do this properly, we started with assessing the frequency of indicative responses to GDS items. Subsequently, in our exploration we had two specific aims. At first, we aimed to explore whether the apathy items that previously loaded on the same component in factor analyses are also strongly connected to each other in a network structure, and in addition, to what extent these are connected to other GDS items. Secondly, we aimed to explore which GDS items appear to be the bridge variables between the GDS items with functional status and dementia at follow-up.
Methods
Participants
Subjects were derived from the Prevention of Dementia by Intensive Vascular Care (preDIVA) trial (Moll van Charante et al., Reference Moll van Charante2016). In short, this cluster-randomized controlled trial tested the efficacy of a nurse-led, multi-component cardiovascular intervention to prevent all-cause dementia among 3526 community-dwelling elderly aged 70 to 78 years at baseline. Exclusion criteria were prevalent dementia or conditions that would hinder successful long-term follow-up, like terminal illness. Eligible subjects were recruited from 2006 up to 2009 and participants were followed for 6.7 years on average. Subjects in the intervention group visited a practice nurse every 4 months to receive intensive cardiovascular care, while the control group received standard care. At baseline and after each 2 years of follow-up data were collected on medical history, medication use, cardiovascular risk factors and cognitive status for both groups of participants. These measures included the GDS and the Academic Medical Center Linear Disability Scale (ALDS) to measure functional disability, see below. For this study the preDIVA participants were analyzed as a single cohort. We deemed this appropriate since the main trial results were generally neutral. More details on the preDIVA trial can be found elsewhere (Moll van Charante et al., Reference Moll van Charante2016).
Outcomes
Dementia outcome
Data collected at each 2-year follow-up assessment were used to determine dementia diagnoses, supplemented by electronic health records made available by general practitioners. These records included reports on hospital admissions, outpatient diagnostic evaluations by geriatricians, neurologists and psychiatrists. For all subjects (also for those who did not complete the study duration) dementia diagnosis was assessed at the end of the 6 to 8 years follow-up period. An independent outcome adjudication committee evaluated all dementia diagnoses, which were evaluated one year later to ensure for more details. More details on this procedure can be found in Moll van Charante et al. (Reference Moll van Charante2016).
Functional disability
The AMC Linear Disability Score (ALDS) was used to measure level of physical disability. It is a generic disability measure based on the Item Response Theory which quantifies functional status by assessing the ability to perform activities of daily life (Holman et al., Reference Holman, Lindeboom, Vermeulen and de Haan2004). For this study we dichotomized the ALDS score at the median score that was scored by our study sample, which was 89.15. We operationalized decreased functional status as a score lower than this median on the ALDS.
Geriatric depression scale
The GDS was developed in 1982 and originally consisted of 30 dichotomous items (Yesavage et al., Reference Yesavage1982). In subsequent years a shortened 15-item version has been developed that has since been translated to and validated in many languages. After factor analyses showed items 2 (“Have you dropped many of your activities and interest?”), 9 (“Do you prefer to stay at home, rather than going out and doing new things?”), and 13 (“Do you feel full of energy”?) loaded on a single factor, the GDS-3A subscale was described that comprised these three items (Adams et al., Reference Adams, Matto and Sanders2004; Kim et al., Reference Kim, DeCoster, Huang and Bryant2013). This subscale has since then repeatedly been used to assess apathy among study populations, while the 12 remaining items have since then also been considered as the GDS-12D subscale that measures mood symptoms (Eurelings et al., Reference Eurelings, Ligthart, van Dalen, Moll van Charante, van Gool and Richard2014; Ligthart et al., Reference Ligthart2012; Mitchell et al., Reference Mitchell2015; van der Mast et al., Reference van der Mast2008).
Data
We used baseline GDS data and the baseline ALDS dichotomous score. Participants for whom any GDS item or the entire ALDS was missing were excluded from the analysis. This was different for the two questionnaires, since the GDS items were analyzed individually while the ALDS total score could be calculated (and dichotomized at the median) even if one or a few items were missing. Participants for whom data with regards to dementia status at follow-up was not retrieved were also excluded from the analysis.
Network analysis
The network analysis was conducted on 17 variables: the 15 GDS items with the addition of the dichotomized decreased functional status variable and incident dementia at follow-up. We used the method developed by Van Borkulo et al. (Reference van Borkulo2014) to estimate the network structure among these nodes. This method combines logistic regression with model selection, which allows assessing associations between two dichotomous variables, while controlling for all other binary variables (van Borkulo et al., Reference van Borkulo2014).
In short, in this procedure L1 regularized logistic regression (also called Least Absolute Shrinkage and Selection Operator [LASSO]) is applied multiple times: each variable in turn functions as a dependent variable, while all other variables act as predictors. The LASSO forces regression coefficients to decrease, some even being set to zero, leaving a smaller set of predictors for each dependent variable. We combined these sets of regularized regression coefficients in a matrix of so-called edge weights by averaging pairs of nonzero coefficients (the AND-rule). For a more detailed explanation on this procedure, we refer to Van Borkulo et al. (Reference van Borkulo2014). With regards to the LASSOs, for each we set the hyperparameter γ at 0.25, used 100 values for the penalty parameter λ, computed the Extended Bayesian Information Criteria (EBIC) for each λ, and selected the set of regression coefficients that yielded the lowest EBIC (called the eLasso procedure).
Network visualization and interpretation
The network was visualized using the Fruchterman-Reingold algorithm, which forces nodes with higher edge weights between each other to be plotted closer to each other (Fruchterman and Reingold, Reference Fruchterman and Reingold1991). Green lines indicate positive edge weights, and red lines negative edge weights. A positive edge weight means that two variables are correlated positively, so that one symptom is more likely to be present if the other symptom is present, while controlling for all other variables in the network. A negative edge weight indicates a negative correlation, which means the probability of one symptom decreases if the other is present, independent of all other variables. The thickness of the line depicts the strength of the association. At last, the length of an edge is simply the inverse of the absolute value of the edge weight. Therefore, the shortest path between two nodes is the minimum sum of edge lengths that are necessary to connect these nodes. This means that in case two nodes are directly connected, the shortest path between these nodes is equal to the single edge length that connects these two nodes.
The centrality measures “betweenness”, “closeness” and “strength” have also been calculated to assist in the interpretation of the networks. These are calculated by using the edge weights and edge lengths. “Betweenness” of a node is the number of shortest paths that go through the node in question. “Node strength” is the sum of the edge weights that are connected to a node. “Node closeness” is calculated by taking the inverse sum of all shortest paths between a node and all other nodes. Therefore, “betweenness” of a node is the importance of the variable to connect other variables with each other; “strength” is a measure for the direct connectivity of a node with other nodes; and “closeness” is a measure for the indirect connectivity of a “node”. The centrality measures have been standardized to a normal Z distribution with a mean of 0 and standard deviation of 1 to ease the interpretation (Epskamp et al., Reference Epskamp, Borsboom and Fried2017; Opsahl et al., Reference Opsahl, Agneessens and Skvoretz2010).
Network stability
We have added supplementary material in which we applied bootstrapping methods to estimate the network (see Appendix A1, published as supplementary material attached to the electronic version of this paper), firstly to assess network stability parameters (see Figure S2, published as supplementary material attached to the electronic version of this paper), and secondly, to explore what edges and node centrality indices differ significantly from each other (see Figures S3–S7, published as supplementary material attached to the electronic version of this paper).
Software
All analyses were conducted in R. The package “IsingFit” was used for the network analysis (van Borkulo et al., Reference van Borkulo2014). IsingFit requires “glmnet” for the LASSO procedure (Friedman et al., Reference Friedman, Hastie and Tibshirani2017). “Qgraph” was used to visualize the network and “ggplot2” for the centrality indices graphs (Epskamp et al., Reference Epskamp, Cramer, Waldorp, Schmittmann and Borsboom2012; Wickham, Reference Wickham2016). For the analyses on network stability parameters we used the “bootnet” package (Epskamp et al., Reference Epskamp, Borsboom and Fried2017).
Results
For 3298 (93.5%) preDIVA participants a complete baseline GDS questionnaire and baseline functional status were available. Follow-up with regards to dementia was available for 3229 (97.9%) of these participants, yielding 20542 person-years of observation. Dementia was diagnosed among 6.8% (220/3229) of subjects after a median follow-up of 60 months (IQR: 39–74). Participants for whom dementia outcome was missing (N = 69) did not differ from the sample included for analysis (N = 3229) with regards to gender, education or baseline Mini-Mental State Examination (MMSE) score. Study sample characteristics are shown in Table 1.
Table 1. Study sample characteristics

* 31 missings;
† 52 missings;
‡ Based on a score lower than the median on the AMC Linear Disability scale; 94 subjects had scored exactly equal to the median of 89.15 points.
In Figure 1 the distribution of the GDS item – responses is shown. The most common symptom was the tendency to stay at home (31%). Indicative responses were also more commonly given to the “dropping activities” (20%), the “lack of energy” (22%), the “afraid” (18%) and the “memory problems” (17%) item.
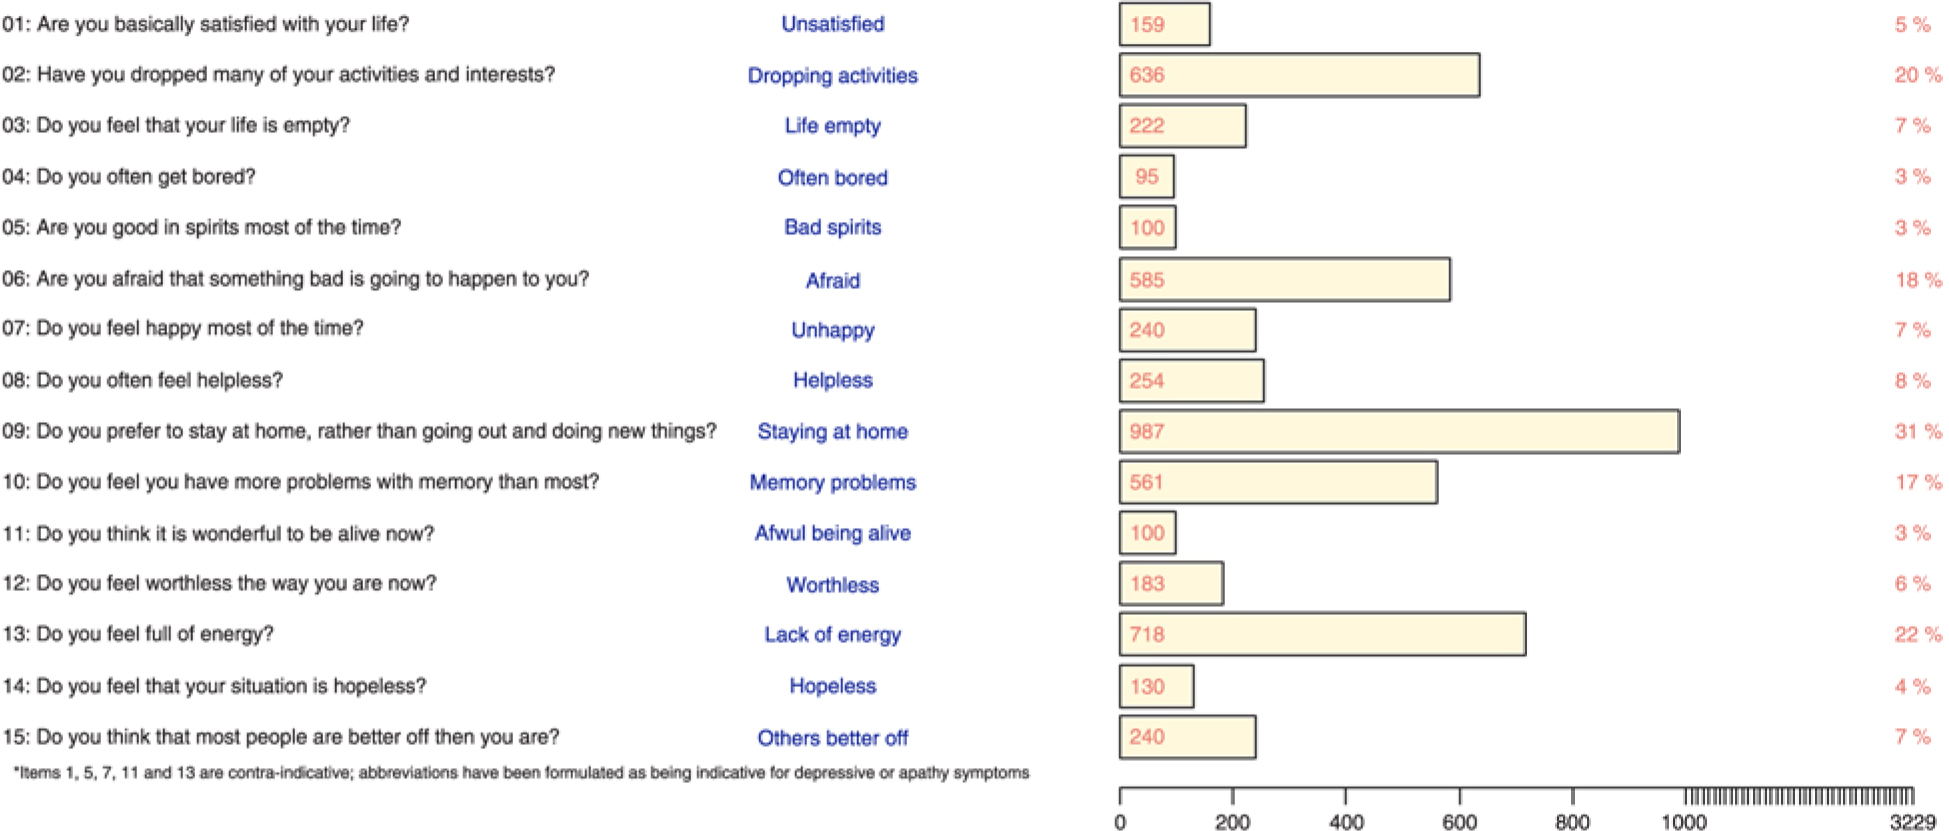
Figure 1. Numbers and percentages of indicative responses to GDS-15 items among the 3229 participants.
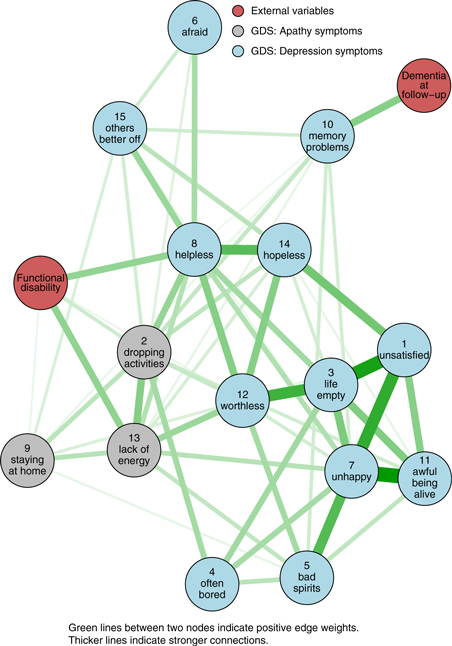
The network structure among the GDS items, decreased functional status and dementia at follow-up is shown in Figure 2. The eLasso procedure resulted in a selection of 59 edges. The analysis showed that the “dropping activities”, “staying at home” and “lack of energy” items, together also considered as the GDS-3A subscale, were connected to each other. This cluster of items was also connected to most GDS-12D items, whereas the “staying at home” item had less connections with the GDS-12D items than “dropping activities” and “lack of energy”.

Figure 2. Visualization of the network using the Fruchterman-Reingold algorithm. Green lines indicate positive edge weights. The thickness of the edge depicts its strength.
All three GDS-3A items and the GDS-12D items “helplessness” and “worthlessness” were connected to decreased functional ability. The only item connected to dementia at follow-up was the “Do you feel you have more problems with memory that most?” item. Markedly, since the “memory problems” node was the only one connected to “dementia at follow-up” and connected to six other GDS items, which included the three items considered as the GDS-3A subscale, the betweenness of this item was almost one standard deviation above the mean (Figure 3). The edge weights underlying the network visualization are shown in Table S1 and the unstandardized centrality indices in Figure S1 (published as supplementary material attached to the electronic version of this paper). We have also added supplementary material on stability of centrality indices (Figure S2), bootstrapped confidence intervals of estimated edge weights (Figure S3) and bootstrapped difference tests on edge weights (Figure S4), node strength (Figure S5), node closeness (Figure S6) and node betweenness (Figure S7).

Figure 3. Standardized centrality measures of the network nodes. Node betweenness is the importance of a variable to connect other variables with each other; node closeness is a measure for indirect connectivity of a variable; node strength is a measure for direct connectivity of a variable.
Discussion
A network approach to the GDS proves a suitable way to gain more insight in the structure among its items and its relations to functional disability and dementia at follow-up. The “dropping activities”, “staying at home” and “lack of energy” items probing (lack of) initiative were connected to each other, which could be interpreted as a replication of the separate cluster of apathy items that was found via factor analyses on the GDS. In addition, our network approach showed that these GDS-3A items are much more interwoven with the GDS-12D items than what would have been expected based on factor analyses alone, particularly the “dropping activities” and “lack of energy” items. Our exploration also showed that functional status is connected to all three GDS-3A items and only to two GDS-12D items, namely “helplessness” and “worthlessness”. Finally, the tenth GDS item on memory problems seemed to be the bridge symptom between future dementia and the other GDS items.
Since the connections between GDS-3A items seemed comparable to their connections with several GDS-12D items, the question arises whether these items actually should be considered to constitute a somewhat separate cluster of apathy symptoms, and if so, in how far it is justified to distinguish these from the other twelve items. The validity of the GDS-3A subscale as an instrument to assess apathy among elderly has been questioned before (Bertens et al., Reference Bertens2017). Since item 9, “Do you prefer to stay at home, rather than going out and doing new things?” actually seems to question what an older person likes instead of what he or she is able to do, contrary to items 2 (“Have you dropped many of your activities and interests?”) and 13 (“Do you feel full of energy?”), one could argue this item seems to be the most pure GDS apathy item. The latter two can be answered positively out of a “not wanting to” (apathy) or “not being able to” (functional disability) and thus are ambiguous with respect to apathy, whereas for item 9 in general this is not the case. One might argue this relates to the network results that showed that the “dropping activities” and “lack of energy” items were more strongly connected to decreased functional ability (“not being able to”), as compared to the “staying at home” item. It seems intuitive that participants with decreased functional ability responded indicatively most often to the GDS items “lack of energy” and “helplessness”. Future studies could take these different associations of GDS items with decreased functional ability into account.
Even though the network approach to the GDS suggests the GDS-3A subscale as an instrument to assess apathy might be suboptimal, we still consider its items to be seemingly more important than most GDS-12D items in the association between the GDS score and dementia risk. This was reflected in the network by the direct connections between the GDS-3A items with “memory problems”, which, importantly, was the only node connected to dementia at follow-up. GDS-12D items that were connected through “memory problems” with dementia at follow-up were the “bad spirits”, “unhappiness”, “helplessness” and “others better off” items. The role of the “memory problems” item was notable in another study as well, whereas this item performed worst with regard to discriminating elderly with and without depressive symptoms from each other, among elderly both with and without cognitive impairment (Midden and Mast, Reference Midden and Mast2017). When defining GDS items as a set of interacting symptoms in a network, it suggests symptoms related to lack of initiative and energy, feelings of bad spirits, unhappiness and helplessness are particularly associated with memory problems and, in the long run, with dementia, while this seems less the case for feelings of fear, worthlessness, boredom and hopelessness. It is important to note in a network structure the direction of connections between memory problems and other items is not modeled, which means specific mood or apathy symptoms might lead to memory problems, but another explanation for these connections might be that memory problems both causes the other symptoms as well as are associated with dementia in the long run. Previously it was shown that a lesser degree of subjective memory problems is associated with only depressed mood, while a higher degree is related to both clinical diagnoses of depression and dementia at follow-up, which also suggests that memory problems themselves are central in a network of depression symptomatology and onset of dementia (Montejo Carrasco et al., Reference Montejo Carrasco2017).
A strength of our study is the use of a large cohort of over 3000 participants and the thorough assessment of dementia diagnoses with re-evaluation after one year. However, replication of our findings that go beyond the use of a specific depression scale would be beneficial in order to generalize these results. A limitation is the use of the ALDS as a measurement for decreased functional status, since this scale is known for its large ceiling effect (Holman et al., Reference Holman, Lindeboom, Vermeulen and de Haan2004). We deemed defining decreased functional status as a score below the median among this sample appropriate to separate participants with decreased functional ability from those without. The use of another measurement for functional disability is recommended for future research in order to aim for conceptual replication of our results to be more specific in this subdivision. Similarly, it would be interesting to compare our results to those of studies that will administer a different depression questionnaire to study the association between mood and apathy symptoms using network analysis. That way it can be compared to what extent our results seem to go beyond the use of a specific depression questionnaire. Lastly, since elderly with expected limited follow-up were excluded at baseline of the preDIVA trial (Moll van Charante et al., Reference Moll van Charante2016), our study sample might have been suboptimally representative for a general geriatric population. Nevertheless, for the current tested hypotheses we consider it legitimate these elderly were excluded, since elderly persons with expected limited follow-up might not have been suitable anyhow to study long-term associations between apathy and depression symptoms with incident dementia at follow-up.
In conclusion, this study has shown a network approach on the GDS produces more insight in the connectedness of its individual items which goes beyond the options standard analytical methods provide and it allowed to relate GDS items with the external variables decreased functional status and dementia at follow-up directly. Future research into the association between depression and apathy symptomatology with dementia might assess specific symptoms or items and clusters of these, rather than sum scores on screening instruments, in order to identify older persons with increased risk for developing dementia. Also, when investigating the association between depression and apathy symptomatology with dementia, it should be realized specific mood and apathy symptoms can be both predictive for dementia, as well as being related to memory problems themselves, which may both herald incident dementia and produce other symptoms related to depression.
Conflict of interest
None.
Funding
The preDIVA trial was supported by the Dutch Ministry of Health, Welfare and sport (grant 50–50110–98–020), the Dutch Innovation Fund of Collaborative Health Insurances (grant 05–234), and the Netherlands Organisation for Health Research and Development (grant 62000015). The funders had no role in study design, data collection and analysis, decision to publish, or preparation of the manuscript.
Description of authors’ roles
L. L. van Wanrooij, D. Borsboom and W. A. van Gool designed the study. L. L. van Wanrooij also conducted the statistical analyses and drafted the manuscript. E. Richard, E. P. Moll van Charante and W. A. van Gool supervised the study. All authors interpreted the analyses and critically revised the manuscript.
Acknowledgments
The authors thank the participants of the preDIVA study and everyone involved in its conduction.
Supplementary material
To view supplementary material for this article, please visit https://doi.org/10.1017/S1041610218002387.


 Open access