


Introduction
The Antarctic Peninsula is one of the regions on Earth most affected by climate change, with air temperatures increasing six times faster than the global average during recent decades (Reference Vaughan, Marshall, Connolley, King and MulvaneyVaughan and others, 2001, Reference Vaughan2003). This appears to be causing glaciological and ecological changes unprecedented in the history of this region for the last 10000 years (Reference DomackDomack and others, 2005).
Prominent consequences of the atmospheric (Reference Turner, Lachlan-Cope, Colwell, Marshall and ConnolleyTurner and others, 2006) and oceanic warming (Reference Meredith and KingMeredith and King, 2005) have been glacier retreat (Reference Cook, Fox, Vaughan and FerrignoCook and others, 2005), break-up of several floating ice shelves, significant glacier acceleration and an accelerating contribution to global sea-level rise (Reference RignotRignot and others, 2005). In particular, the Wordie Ice Shelf lost almost 1100km2 between 1966 and 1989 (Reference Doake and VaughanDoake and Vaughan, 1991a,Reference Doake and Vaughanb; Reference VaughanVaughan, 1993) and this was followed by the collapse of the Larsen A ice shelf in January 1995 (Reference Rott, Skvarca and NaglerRott and others, 1996; Reference Doake, Corr, Rott, Skvarca and YoungDoake and others, 1998) and of the Larsen B ice shelf in March 2002 (Reference Rignot, Casassa, Gogineni, Krabill, Rivera and ThomasRignot and others, 2004; Reference Scambos, Bohlander, Shuman and SkvarcaScambos and others, 2004). More recently, the Wilkins Ice Shelf, one of the southernmost on the Antarctic Peninsula, has also been impacted, with the loss of >1800km2 (Reference Braun, Humbert and MollBraun and others 2009; Reference HumbertHumbert and others, 2010). The collapsing ice shelves further south along the Antarctic Peninsula have been related to a thermal limit of ice-shelf viability (Reference Vaughan and DoakeVaughan and Doake, 1996) approximately coinciding with the mean annual –9˚C isotherm (Reference Morris, Vaughan, Domack, Burnett, Convey, Kirby and BindschadlerMorris and Vaughan, 2003), or more precisely the summer isotherm of –1.5˚C (Reference Scambos, Hulbe, Fahnestock, Domack, Burnett, Leventer, Conley, Kirby and Bind-schadlerScambos and others, 2003). Both isotherms have migrated southward in recent decades, threatening a number of ice shelves (Reference GlasserGlasser and others, 2009).
The retreat of these ice shelves is not contributing to sea-level rise directly, as the ice they contain is already floating and in hydrostatic equilibrium with the ocean. However, it has been demonstrated that loss of the ice shelves can have a clear impact on upstream glaciers, causing accelerated ice flow and ice thinning. This increasing ice discharge does imply a contribution to global sea level (Reference ThomasThomas and others, 2004) that may or may not be balanced by increasing accumulation in the glacier catchments. Many of the glaciers along the Antarctic Peninsula that used to feed the ice shelves that have been lost recently are now showing some of the largest mass imbalances and rates of thinning seen anywhere on the Antarctic ice sheet (Reference De Angelis and SkvarcaDe Angelis and Skvarca, 2003; Reference Rignot, Casassa, Gogineni, Krabill, Rivera and ThomasRignot and others, 2004, Reference Rignot2005; Reference Pritchard, Arthern, Vaughan and EdwardsPritchard and others, 2009). The ice-flow changes in these glaciers appear to result from the loss of buttressing stress associated with loss of the ice shelves, a relationship predicted (e.g. Reference HughesHughes, 1973; Reference MercerMercer, 1978) decades before recent events made it verifiable.
However, the processes governing ice-shelf retreat and its influence on glacier dynamics are still not completely understood. In particular, we do not yet have the capability to predict ice-shelf retreat reliably or forecast major breakups. One of the reasons for this deficiency is that some of the basic variables required to constrain ice-dynamics evolution models have remained unknown. Although remote sensing offers the opportunity to monitor glaciers from space by measuring ice velocities (Reference Goldstein, Engelhardt, Kamb and FrolichGoldstein and others, 1993) and surface-elevation changes (Reference Shepherd, Wingham, Payne and SkvarcaShepherd and others, 2003), these measurements lack adequate temporal or spatial resolution.
One of the main questions that needs to be addressed is the response time of glaciers after ice-shelf loss. How long do glaciers continue to accelerate and thin after the removal of the buttressing of ice shelves? We believe that one area where this question can be addressed usefully is Fleming Glacier (69.5˚ S, 66˚ W; Fig. 1), which once fed the Wordie Ice Shelf on the west coast of the Antarctic Peninsula. In recent years, we have used airborne, field and remote-sensing data to investigate change on this glacier and establish benchmark datasets against which future change could be measured. The main aim of this paper is therefore to study recent evolution of its ice shelf and the impacts on glacier dynamics.

Fig. 1. ASTER image of Fleming Glacier acquired on 2 February 2009 superimposed with the tracks of airborne laser campaigns (ATM track in 2004 shown in black, CAMS track in 2008 represented surface altitude in colours) and the ICESat track used in the comparison (in white). (ASTER: Advanced Spaceborne Thermal Emission and Reflection Radiometer; ATM: Airborne Topographic Mapper; CAMS: CECS Airborne Mapping System; ICESat: Ice, Cloud and land Elevation Satellite.) The black box indicates location of Figure 4. Inset map of the Antarctic Peninsula shows the researched area (red box) and other names referred to in the text.
The Wordie Ice Shelf collapsed sometime prior to 1989, and interpretation of satellite images acquired before and after that collapse led to the suggestion that Fleming Glacier had not accelerated either during or immediately after the loss of the ice shelf (Reference VaughanVaughan, 1993). However, airborne and satellite data showed that this conclusion was incorrect and both thinning and acceleration had actually occurred (Reference RignotRignot and others, 2005), but there still remains uncertainty as to whether, 30 years after the loss of most of the ice shelf, these changes are ongoing or whether the glacier is now approaching a new equilibrium.
We can begin to address these uncertainties using data from two recent field campaigns conducted in the area. In November/December of 2007 and 2008, Centro de Estudios Científicos (CECS) collected meteorological and geodetic data during ground-based campaigns. Also a survey flight on board a Twin Otter airplane of the Chilean Air Force (FACH) was conducted in December 2008 to Gibbs, Airy and Fleming glaciers (Fig. 1) using a laser scanning system developed by CECS to survey the ice surface topography.
Retreat of the Wordie Ice Shelf
Reference Vaughan and DoakeVaughan and Doake (1996) presented a history of the retreat of the Wordie Ice Shelf up to 1989. Reference FerrignoFerrigno and others (2008) mapped ice-shelf changes at and around the Larsen Ice Shelf and included an update on the Wordie Ice Shelf until 2001; their data are available in the 2007 version of the Antarctic Digital Database (BAS, 1998). Using this and other data, we can now present a new history of the retreat of the Wordie Ice Shelf, describing how, since 1989, the ice shelf has disappeared almost completely (Figs 2 and 3).

Fig. 2. The frontal positions of the Wordie Ice Shelf between 1989 and 2009 compared with the grounding line as estimated by Reference RignotRignot and others (2005) for 1996. Background: ASTER image acquired on 2 February 2009.

Fig. 3. History of areal changes of the Wordie Ice Shelf compiled from different sources.
We have acquired several satellite images (see Table 1) of Wordie Bay to update the ice-shelf history. Cloud-free optical satellite images are rare in the region, but we have also used synthetic aperture radar (SAR) images, which are not degraded by cloud cover. Although the SAR backscatter intensity images have a lower resolution due to the speckle effect, interferometric processing can help to identify the limit between coherent ice shelf, grounded ice and detached icebergs grounded on the seabed or held fast in sea ice. For the European Remote-sensing Satellite (ERS) tandem data used to map the ice shelf in 1995, this approach facilitates ice-shelf delineation. As the ice tongues are shown to be almost completely gone in the more recent radar data, this delineation problem no longer exists. For area change comparison, the grounding line of 1996 (Reference RignotRignot and others, 2005) was used as the baseline and all area changes are referred to this configuration, independently of a possible upstream migration in recent years.
Table 1. Updated area of the Wordie Ice Shelf from 1989 to 2009. Dates are dd/mm/yyyy

After a continued areal reduction until 1989 (Fig. 3), the ice shelf stabilized in the early 1990s. The data compiled by Reference FerrignoFerrigno and others (2008) showed a minor readvance in 1997, but the RADARSAT data they used were subject to the above-mentioned limitations of radar amplitude images. However, the front of the ice shelf shrank again in the following years, reaching a minimum in 2009. At the time of the latest image, the total floating part of the ice shelf is only 96 km2 (Table 1) and there is virtually no contiguous ice shelf left. Only Prospect Glacier and a local confined glacier next to Hariot Glacier still possess a floating ice tongue. The fronts of all other glaciers flowing into Wordie Bay coincide with the 1996 grounding line.
There are insufficient data to estimate whether the local grounding line has been stable or whether it has suffered any upstream migration; however, the subglacial topography available from BEDMAP in the vicinity of the grounding line of Fleming Glacier (Reference Lythe and VaughanLythe and others, 2001; BAS_7172, mission 33) indicate bed elevation ranges between –489 and –700 m. The surface elevation of Fleming Glacier front measured in 2008 by the CECS Airborne Mapping System (CAMS) yielded values of 50–100m a.s.l., so it is unlikely that the ice front is totally afloat. Using the hydrostatic equilibrium equation (water/ice densities of 1.0 and 0.9g cm3, respectively), we estimate that the ice thickness needed for flotation must range between 450 and 900 m, values which are within the uncertainty of measured ice thickness available in BEDMAP. As a consequence, the main front of Fleming Glacier is most probably partially grounded, with local floating segments, losing mass through calving.
From the above analysis, it is possible to conclude that after 1989 the Wordie Ice Shelf has continued to retreat and currently very little floating ice remains. From the longer-term perspective, the retreat of the Wordie Ice Shelf appears to have been fairly constant since the late 1960s, perhaps with a small readvance in the mid-1990s. This behaviour differs from that of other ice shelves like Larsen A or B, which experienced accelerating rates of retreat that culminated in collapse. One reason for the steady retreat continuing over such a long time period might be the existence of many islets in Wordie Bay which served as pinning points containing the retreat.
Change in Ice Flow on Fleming Glacier
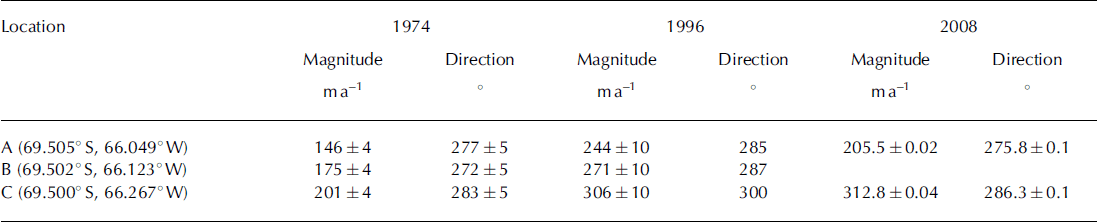
The first measurements of ice-flow speed on Fleming Glacier were undertaken in 1974 (Reference DoakeDoake, 1975). Although these measurements were compared with radar satellite measurements from 1996 and 2004 (Reference RignotRignot and others, 2005), our field campaign in 2008 provided the first opportunity to undertake precise in situ remeasurement of these data.
Two of the sites where ice flow was measured by Doake using optical resection to nearby rock outcrops were reoccupied with dual-frequency GPS for 12days. The data were processed kinematically against a reference station on a nunatak located close to the base camp used in 2007 and 2008 (Fig. 4). Velocities were determined by a least-squares adjustment that gives an rms value of a single observation of 0.02 m. The many displacement measurements derived from a timespan of 12 days were extrapolated to annual velocities with resulting uncertainty of a few centimetres per year. We assume that as summer melting has not been observed at this site, there are no significant seasonal changes in ice flow. This assumption is implicit in both of the earlier measurements, but, as the measurements in 1974 and in 2008 were both carried out in December and radar data used by Reference RignotRignot and others (2005) were acquired in the summer, seasonal changes should not affect the comparison.

Fig. 4. Ice velocities in 1996 (Reference RignotRignot and others, 2005; blue arrows) and 2008 (red arrows) of locations originally surveyed by Doake in 1974 (Reference DoakeDoake, 1975; black arrows). Blue triangle shows the site of the automatic weather station (AWS), where the base camp was established in 2007.
Table 2 lists the velocity and respective uncertainties of the comparison of the three dates. The resulting data confirm the higher velocities measured in the 1990s without any evidence of further acceleration. The flow directions implied by the 1974 and 2008 measurements are very similar (Table 2). The apparently different flow direction obtained by Reference RignotRignot and others (2005) is probably not significant and could be erroneous given the higher uncertainties of the interferometic method in this case, in which there was an unfavourable geometry in the satellite tracks available.
Table 2. Comparison of ice velocities at Fleming Glacier determined by optical survey (Reference DoakeDoake, 1975), SAR interferometry (Reference RignotRignot and others, 2005) and GPS measurements. See Figure 4 for locations
Surface-Elevation Change on Fleming Glacier
In December 2004, an airborne campaign was conducted from a Chilean Navy Orion P3 airplane. During this campaign, surface topography was mapped using the NASA Airborne Topographic Mapper (ATM) laser. The campaign covered various glaciers and ice shelves, including Fleming and Airy Glaciers where surface topography was measured at decimetre accuracy (see black line in Fig. 1).
During the December 2008 airborne campaign, the laser scanning system CAMS was used to survey the surface topography from the glacier front at Wordie Bay up to 1100ma.s.l. The system consists of a Riegl scanning laser altimeter (LMS-Q240–60) combined with kinematic GPS, an inertial measurement unit and a digital camera to retrieve orthophotos. This scanning laser altimeter provides an effective measurement rate of 10 000 shots per second, resulting in one point measurement each ∼1.5 m distance on the ground, when flying at an altitude of 400m above the surface. The vertical accuracy of these measurements is estimated to be 0.2 m. The survey tracks were designed to repeat earlier measurements including the 2004 ATM track and an Ice, Cloud and land Elevation Satellite (ICESat) track acquired in 2003 (Fig. 1). The track acquired runs parallel to the main ATM profile at Fleming Glacier for about 30km and gives some additional crossovers closer to the ice front. These co-located measurements allow us to analyse ice elevation changes between 2004 and 2008. From a statistical point of view, access to only two epochs means there is a limitation to the interpretations we can draw from any changes we find, but in this case it should be noted that two high-precision datasets collected using very similar methodology were compared and we believe that these can yield some insight into the ongoing ice-elevation changes.
The rms values of the differences between 2008 and 2004 are estimated to be better than 1 m, implying that we should certainly see secular trends >0.25ma−1 for the elevation change rates between 2004 and 2008. To analyse their elevation dependence, rates are plotted against absolute elevation in Figure 5. The graph also shows changes in areas of overlap between a 2003 ICESat track and 2008 in the elevation range 120–450 m.
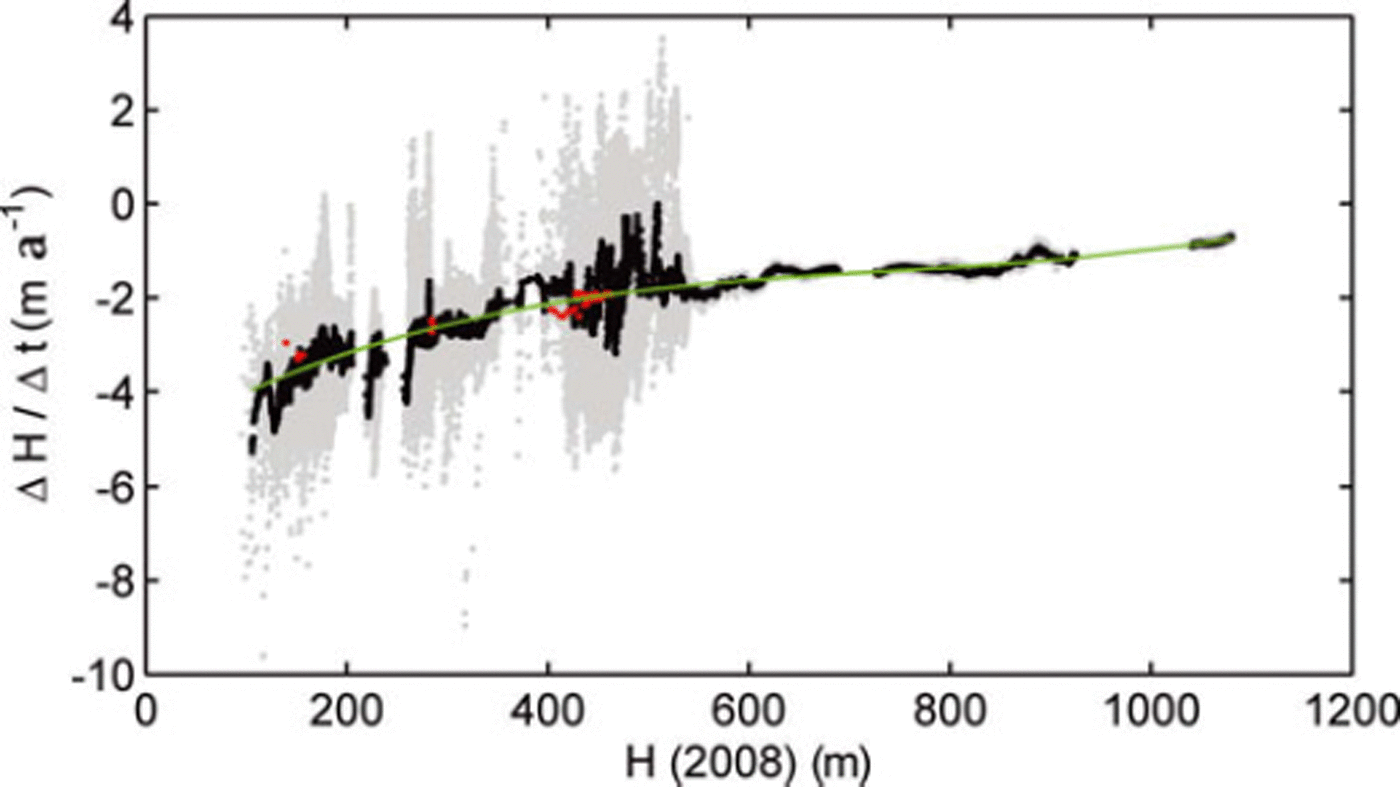
Fig. 5. Elevation change rates at Fleming Glacier between 2004 and 2008 plotted against absolute elevation in 2008. Measurements (grey dots) were median-filtered (black dots) before adjustment of a cubic function (green line). Rates derived from a comparison of ICESat measurements in 2003 and CAMS are shown in red.
Figure 5 shows that there was a pronounced lowering of the surface between the 2004 and 2008 surveys and also between the 2003 and 2008 surveys. The rates measured match for both intervals and across the elevation range. The graph shows a clear trend to increased thinning rates towards the glacier front. The large scatter below 500 m elevation is due to the undulated and heavily crevassed surface. Here there are many crevasses up to 50 m wide and 300 m long; however, a median filter was applied to the data before calculating linear and cubic regression functions.
This linear regression implies an elevation change rate of –3.0 m a−1 at the approximate elevation of the ice front. The cubic regression function that adjusts more closely to the data suggests a surface lowering of up to 4.1 ± 0.2 m a−1.
Discussion
The data presented here provide a far from complete picture of change in the Wordie Ice Shelf/Fleming Glacier system, but they do enable some new insights and an interesting counterpoint to studies on the Larsen Ice Shelf (A and B).
In the mid-1990s, Fleming Glacier was already flowing (Reference RignotRignot and others, 2005) at ice velocities 40–50% higher than it had been at the time of the first measurements in 1974. However, the velocity measured in 2008 appears to show no further change at either site. While it is possible that velocity has varied in this period, the simplest interpretation is that ice flow rose as most of the ice shelf was lost, but has since remained approximately constant.
Again, it is possible to apply a different interpretation, but our limited ice elevation data appear to show ice thinning up to 4.1 m a−1 in the lower reaches all along a profile from the ice front to 40 km upstream from the nearest grounding line. This could also be an impact of the removal of the ice shelf. These values are remarkable since approximately half of the maximum extension of the ice shelf collapsed prior to 1989, more than 20 years ago. Given the present data, it is difficult to determine whether the ongoing ice-elevation changes are related to the partial loss of the Wordie Ice Shelf prior to 1989 or to the more recent loss of the remaining part of the Wordie Ice Shelf, which has taken place since the mid-1990s.
Apart from the increases in temperature that have been observed (e.g. at Rothera Station (Reference Vaughan, Marshall, Connolley, King and MulvaneyVaughan and others, 2001) 240 km to the northwest of Fleming Glacier), very limited air-temperature data exist in the area. There are even fewer measurements of precipitation in the area. However, we do have regional estimates, based upon general circulation models, indicating precipitation has increased in recent times (Reference Van den Broeke, van de Berg and van MeijgaardVan den Broeke and others, 2006; Reference MayewskiMayewski and others, 2009). According to Reference MonaghanMonaghan and others (2006), who studied changes in Antarctic snowfall since 1955, on the western side of the peninsula there was an increase between 1975 and 1994 and a decrease in the period 1995–2004. The overall increase in snowfall was confirmed at Gomez plateau (73.598 S, 1400 m a.s.l.), where ice-core data revealed a doubling in snow accumulation since the 1850s (Reference Thomas, Marshall and McConnellThomas and others, 2008).
Melting has been considered negligible and certainly not sufficient to enhance sliding of Fleming Glacier (Reference RignotRignot and others, 2005); therefore, the observed changes in elevation are most likely related to dynamic responses of the glacier to the almost total disappearance of the ice shelf. Our compilation of data to 2009 indicates that the Wordie Ice Shelf has reduced to ∼5% of its maximum area extension measured in 1966. The widespread atmospheric warming affecting the western side of the peninsula and the consequent rise in the equilibrium line (Reference Fox and CooperFox and Cooper, 1998) is therefore insufficient to explain the ice surface elevation changes taking place in the area and we conclude that dynamic thinning of the glacier, resulting from the loss of the ice shelf, is the cause.
In this context, strong ice thinning at low altitude and higher snow accumulation at higher altitude probably results in enhanced mass turnover and ice acceleration (Reference Pritchard and VaughanPritchard and Vaughan, 2007). However, these changes in snowfall have not been large enough to balance the glaciers, as the Antarctic Peninsula is experiencing an overall negative mass balance (Reference RignotRignot and others, 2008).
The data presented here are representative of the data that need to be collected on other retreating ice shelves in order to understand fully their interactions with the glaciers that fed them. The Wordie Ice Shelf and Fleming Glacier present a different picture to that noted on the northeast coast of the Antarctic Peninsula, where ice-shelf retreat culminated in very rapid collapses of the Larsen A and B ice shelves. On the Wordie Ice Shelf the retreat appears to have continued for more than three decades and its main feeding glacier has continuously accelerated for at least 12 years.
The change rates measured between 2004 and 2008 appear to show strong thinning, with larger negative elevation changes at the grounding line, implying a progressively steepening glacier. Since it might be expected that this process will increase driving stress and further increase glacier velocities, there is little reason to believe this glacier is close to re-establishing its equilibrium. In order to verify this, close monitoring is required, providing precise ice velocities and subglacial topography especially near the grounding line.
Acknowledgements
CECS is sponsored by Millennium Science Initiative (ICM), the Excellence Centres of CONICYT Basal Financing Programme and the Regional Government of Los Ríos, among many others. This project was financed by the Bicentennial Science and Technology Programme of CONICYT (Scientific and Technological National Commission of Chile)/World Bank. The logistic support of the Chilean Antarctic Institute (INACH), FACH and the British Antarctic Survey is highly appreciated. The project is within the framework of 2007–08 International Polar Year. The 2004 ATM data were collected thanks to a joint airborne campaign conducted by CECS, NASA, the University of Kansas and the Chilean Navy. We highly appreciate their efforts for the successful campaign. H. Fricker provided ICESat data. Global Land Ice Measurements from Space (GLIMS) provided ASTER satellite imagery. ERS and Envisat data were provided by the European Space Agency under project AOCRY.2674. The comments and suggestions of D. Vaughan, A. Vieli and an anonymous reviewer significantly improved this paper.


