


BACKGROUND AND PURPOSE
In simple terms, intensity-modulated radiotherapy (IMRT) is the delivery of radiation to a clinical target volume using fields with non-uniform radiation fluences. This modality has matured in recent years and is now widely accepted as being superior to conventional external beam radiotherapy in certain clinical situations. The IMRT has been successfully incorporated into the treatment of cancers in a range of anatomical sites including head and neck (H&N), central nervous system tumours, prostate, lung, abdominal/retroperitoneal malignancies, gynaecological diseases and breast cancer.
Within Helios™, users can define dose volume constraints and their priorities among other parameters. The X and Y smoothing factors are used as weighting factors to penalise excessive fluence differences between adjacent bixels in the X or Y directions. The optimal fluences represent the ideal field modulation and do not take into account the physical and mechanical limitations of the Dynamic Multileaf Collimator (DMLC) device. Optimal fluences are converted to actual deliverable fluences by the Leaf Motion Calculator (LMC) module in the Varian Eclipse™ Treatment Planning System (TPS).
Typically, higher values result in a greater degree of smoothing and should reduce the MUFactor for the LMC. The MUFactor itself is the beam-on time equivalent in intensity and is defined as follows.1
Equation 1: MUFactor
where
Σj = Sum of positive intensity deltas in slice ‘j’,
c = Maximum of these sums for all slices, complexity constant for a certain fluence matrix, depending on (relative) intensity values of the matrix only,
w = Width of the field in cm, constant for a given matrix,
smin = Minimal slope for a leaf trajectory in cm–1, depending on leaf speed, dose rate and MU maximum of the field.
Equation 2: Minimal slope for a leaf trajectory
where
R = Dose rate in MU/min,
D = Field maximum in MU,
v = Maximum leaf speed in cm.s–1.
The MLC controller can, for example, adjust the dose rate (R), but the exact MUFactor value must be known for transmission correction. This depends on smin and if the correct transmission correction is to be achieved, this ratio must be the same for both the leaf motion calculation and the delivery of the calculated plan. Once a leaf plan has been calculated, the MUFactor is implicitly contained in it.1
The degree of smoothing affects the average Leaf Pair Opening (LPO), which in turn directly relates to the number of monitor units (MU) required per field.1,Reference Anker, Wang and Tobler2 However, a survey of 12 radiotherapy centres using Eclipse™ has shown a wide variation in the X–Y values used in fluence smoothing (unpublished data).
This work examined the effect of varying the X–Y smoothing values on the average LPO, MUFactor and total number of MU in a cohort of 20 patients (10 H&N, 10 prostate) treated with sliding window IMRT. For a fixed maximum optimisation priority value, we attempt to determine the effects of various X–Y smoothing combinations on these two groups of patients.
MATERIAL AND METHODS
Twenty inverse planned IMRT cases were selected at random from a cohort of 30 prostate and 30 H&N patients who had previously completed their treatment. The 10 H&N cases consisted of oropharynx with unknown primary,Reference Shaw, Kline and Gillin3 tongue,Reference Shaw, Kline and Gillin3 thyroidReference Shaw, Kline and Gillin3 and tonsil.1 All plans had been created using the Varian Eclipse™ Treatment Planning System (TPS) version 8.9.09 (Varian Medical Systems, Palo Alto, USA). All plans were initially optimised using smoothing parameters of X = 60 and Y = 60 as per the local clinical protocol and each of these clinically approved and dosimetrically verified plans was used as a reference plan for each patient. These reference plans were then copied and the X and Y smoothing parameters varied from 0 to 100. Although it is possible to vary the smoothing from 0 to 999, this study concentrates on the range up to 100 to compare with a similar study performed by Anker et al.Reference Anker, Wang and Tobler2 In this study, the X smoothing value was always 10 more than the Y value, to reflect the default XY values suggested by the vendor and a fixed maximum optimisation priority value of 100 was used as per the local protocol. In general, the original, clinically approved treatment plans were optimised with a lower priority assigned to the organs at risk (OAR) than to the planning target volume (PTV). The intent was to first achieve good 95% isodose coverage of the PTV before addressing the user-defined OAR constraints. So, for example, a prostate IMRT plan would initially be optimised with a priority of 70, (the maximum is 100) for the PTV and 30 for the bladder, rectum and femoral heads. It should be noted that the clinical plans used in this computational study were produced by several different users and individual approaches to assigning exact priorities would have been varied. However, the scope of this study begins with the clinically approved plans and does not go into the details of creating each of those.
These copied plans were then re-optimised for a fixed number of iterations (35), as this value was sufficient to approach a minimum cost function and reflects what is done in practice locally. The PTV coverage was normalised in exactly the same way as the reference plans, that is, to the median PTV dose (itself 100% of the prescribed dose). This enabled a direct comparison to be made among plans for similar disease sites using this particular TPS. A Pencil Beam Convolution (PBC) version 8.2.23 was used for the dose calculation with a grid size of 2.5 mm and modified Batho was the inhomogeneity correction used. No a posteriori fluence editing was used. For each of the 10 prostate and 10 H&N patients, 10 and 11 X–Y combinations were optimised, giving a total of 220 individual dose plans.
Standard treatment plan reports were used to obtain values for the average LPO, MUFactor and MU for individual fields. The dose-volume histogram (DVH) analysis was performed to determine the near-minimum absorbed dose (D98%) for the PTV. To determine the quality of the absorbed dose distributions resulting from smoothing, the Paddick Conformity Index, CIPAD and the International Commission on Radiation Units (ICRU) Homogeneity Index(HI) were calculated for all plans.Reference Shaw, Kline and Gillin3,4
The Paddick Conformity Index, CIPAD, is defined as
Equation 3: Paddick Conformity Index
where PI is the volume of the prescription isodose line (95%), TVPI is the target volume within the PI, and TV is the target volume. A CIPAD of 1.0 suggests a perfect plan.
The ICRU HI is defined as
Equation 4: ICRU Homogeneity Index
where D50% is the dose received by 50% of the target volume and so on. An HI of zero suggests a perfectly homogeneous absorbed-dose distribution.
RESULTS
Average LPO
For the 10 prostate IMRT patients, there was a definite increase in mean LPO averaged over the five treatment fields used for this site. For X = 0 and Y = 0, the average LPO was 2.4 cm (σ = 0.20 cm) and for X = 100 and Y = 100, this increased to 3.5 cm (σ = 0.35 cm) (Figure 1).
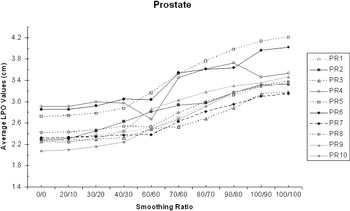
Figure 1. The average LPO increases with X–Y smoothing (prostate IMRT).
For the 10 H&N IMRT patients (eight 5-Field and two 7-Field), there was also a definite increase in mean LPO averaged over all fields. For X = 0 and Y = 0, the average LPO was 1.7 cm (σ = 0.17 cm) and for X = 100 and Y = 90, this increased to 2.3 cm (σ = 0.27 cm)
Total MU
The mean of the total MU for the 10 prostate plans decreased with increasing X–Y smoothing values, from 1028 (σ = 244.6) at X = 0 and Y = 0 to 688.4 (σ = 159.3) at X = 100 and Y = 100. Figure 3.
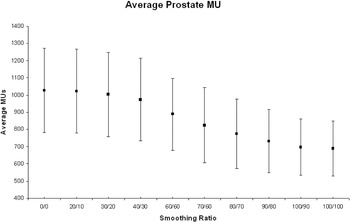
Figure 3. Average number of MU for all 10 prostate patients at each X–Y smoothing combination.
For the 10 H&N plans, there was a similar but less marked trend, with the mean of the total number of MU decreasing from 913 (σ = 267.2) at X = 0 and Y = 0 to 696 (σ = 214.03) at X = 100 and Y = 90 (Figure 2).
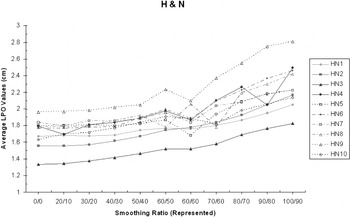
Figure 2. The average LPO increases with X–Y smoothing (H&N IMRT).
Total MU
The mean of the total MU for the 10 prostate plans decreased with increasing X–Y smoothing values, from 1028 (σ = 244.6) at X = 0 and Y = 0 to 688.4 (σ = 159.3) at X = 100 and Y = 100 (Figure 3).
For the 10 H&N plans, there was a similar but less marked trend, with the mean of the total number of MU decreasing from 913 (σ = 267.2) at X = 0 and Y = 0 to 696 (σ = 214.03) at X = 100 and Y = 90 (Figure 4).
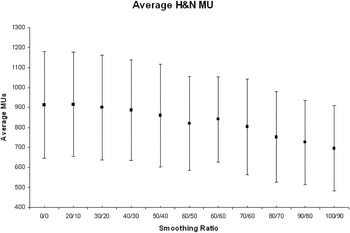
Figure 4. Average number of MU for all 10 H&N patients at each X–Y smoothing combination.
MUFactor
The MUFactor, which gives a measure of beam-on time required to deliver a field, decreased from 1.81 (σ = 0.19) at X = 0 and Y = 0 to 1.38 (σ = 0.11) at X = 100 and Y = 100 averaged for all 10 prostate patients.1 This suggests increased delivery efficiency with increasing X–Y smoothing (Figure 5).
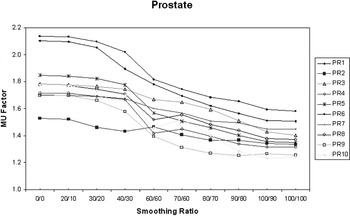
Figure 5. MUFactor decreases with increasing X–Y smoothing for prostate IMRT patients.
For the 10 H&N patients, the average MUFactor decreased from 1.50 (σ = 0.14) at X = 0 and Y = 0 to 1.24 (σ = 0.09) for X = 100 and Y = 90, suggesting a similar increase in delivery efficiency (Figure 6).
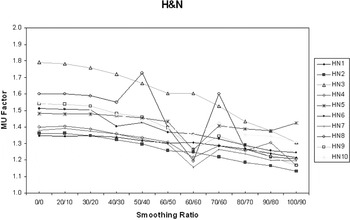
Figure 6. MUFactor decreases with increasing X–Y smoothing for H&N IMRT patients.
D98% of the PTV
For the 10 prostate patients, there was a small but reproducible decrease of approximately 2% in the D98% of the PTV as the smoothing ratio was increased from X = 0 and Y = 0 to X = 100 and Y = 100. However, there was no discernible trend for the H&N patients. No obvious correlation was found between the MUFactor and the D98% of the PTV for both the prostate and H&N patients. The results of the analysis of the prostate group are presented in Figure 7.
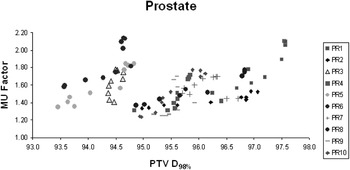
Figure 7. No obvious correlation between MUFactor and D98% PTV for 10 prostate IMRT patients.
OAR sparing
In terms of OAR sparing, increased smoothing had little effect on the maximum (D98%), mean or median dose to the rectum. Collective analysis of 10 prostate patients showed that the mean dose to the rectum varied between 54.6% and 65.2% of the prescribed dose. The median dose to the rectum varied from 63.6% to 65.7%. For the 10 H&N patients, the mean dose to the contra-lateral parotid was < 28 Gy (local tolerance) in six cases confirming the benefit of using IMRT for these patients. For the four cases where the mean contra-lateral parotid dose was > 35 Gy, three were oropharynx patients with unknown primary. It was suspected that the bi-lateral level II nodes contained tumour and the need to include the retrostyloid nodes in the treated volume precluded parotid sparing. The fourth case involved a tongue tumour with both sides of the neck involved which limited the sparing of either parotid gland. However, the point to emphasise is that the absolute dose varied little across the range of smoothing values used (0.11 ≤ σ ≤ 0.52 Gy). All 10 H&N patients received < 51.0 Gy to the brain stem and again increased smoothing had little effect on the maximum absorbed dose (0.16 ≤ σ ≤ 0.82 Gy) (Figures 8 and 9).
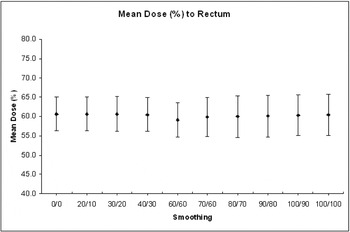
Figure 8. Effect of smoothing on the mean dose (%) to the rectum for 10 prostate IMRT patients.
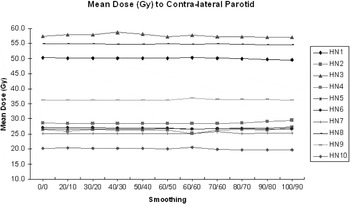
Figure 9. Effect of smoothing on the mean dose (Gy) to the contra-lateral parotid for 10 H&N IMRT patients.
DISCUSSION
This paper evaluates the effect of increased smoothing on plan complexity for 10 prostate IMRT and 10 H&N IMRT patients. A total of 220 individually optimised plans were examined in all. A fixed maximum optimisation priority value of 100 was maintained in Eclipse™ as per the local protocol. This was varied in another study and found to have little effect on overall plan efficiency.Reference Anker, Wang and Tobler2 The process by which Helios™ iteratively approaches a minimum cost function is influenced by many variables, including the maximum optimisation priority, user-defined dose constraints and smoothing.
As smoothing was increased for both cohorts of patients, the average LPO increased, indicating reduced plan complexity, agreeing with previous findings.Reference Nicolini, Fogliata and Vanetti5–Reference Matuszak, Larsen and Fraass9 Similarly, for both sets of patients, there was a decrease in MUFactor with increasing smoothness. This decrease was less marked for the H&N patients indicating the limits imposed by more detailed anatomy and the greater number of individual dose constraints in the objective function calculation. The MUFactor is a function of leaf speed, dose rate, maximum MU of the field, average width of the field and a complexity constant for the fluence matrix. It is a reflection of the complexity of the actual fluence and a higher MUFactor implies greater complexity. In this context, a complex fluence is defined as one where the fluence profile measured in the direction of a leaf pair produces more than one peak. Fluence complexity is itself directly related to the efficiency of dose delivery and is ultimately limited by the ability of a MLC-equipped linear accelerator to deliver intricate dose distributions. A recommendation for good IMRT practice is to minimise the complexity of the plan.Reference Webb10
A fall in the total number of MUs per plan was also evident for both sets of patients, being more pronounced for the prostate patients. Again, this corroborates the findings of Nicolini et al. but is based on a much larger number of treatment plans.Reference Nicolini, Fogliata and Vanetti5
The literature presents numerous methods for quantifying treatment plan quality; however, this study has used a simple HI and the CIPAD.Reference Wu, Wessels and Einstein11–Reference Yoon, Park and Shin16 The average ICRU HI for the H&N patients varied from 0.07 to 0.28 (σ = 0.05, CI: 0.12–0.13). For individual patients from this group, very little change was noted when smoothing was increased from X = 0 and Y = 0 to X = 100 and Y = 90. The CIPAD varied overall from 1.00 to 0.88 (σ = 0.02, CI: 0.96–0.97), for the H&N patients. It was noted that varying the smoothing from X = 0 and Y = 0 to X = 80 and Y = 70 had little effect. However, beyond this there was a slight decrease and overall, the reduction in CIPAD varied from 0% to 3% for the 10 H&N cases analysed. Taken together, these two indices suggest that as smoothing is increased, coverage of the PTV is maintained at the expense of normal tissue sparing. However, it should be noted that these currently used conformity indices depend on target size and shape complexity.Reference Wu, Wessels and Einstein11
For a fixed maximum optimisation priority value, there may be a unique complexity level required to produce an acceptable IMRT plan. This complexity level will be influenced both by the required dose distribution criteria applied to the target and OAR, as well as the local definition of an acceptable treatment plan. There is a trade-off between increasing plan complexity and reducing plan efficiency. However, a high number of MU is not detrimental in itself. The disadvantage in having excessive modulation is that the PBC Algorithm and to a lesser extent the Anisotropic Analytical Algorithm (AAA) would ‘smooth out’ the noise while the delivery would exactly reproduce the excessively modulated fluences. Further work is required, in the form of actual absolute dose measurements during treatment delivery at various points in a water phantom. These would better quantify the trends found in this purely computational study. Since the range of possible smoothing parameters is so large, radiotherapy centres using the Varian Eclipse™ TPS should decide upon an appropriate range of smoothing values for various disease sites. These should appear in the site-specific planning protocol and should be verified as part of the plan- checking procedure.
CONCLUSION
For the 220 IMRT treatment plans investigated, it has been shown that increasing smoothing from X = 0 and Y = 0 to X = 100 and Y = 100 does not greatly improve OAR sparing, but decreases the MUFactor, decreases the total MU for the plan and increases the average LPO. The ICRU HI and the CIPAD appear to vary little after increasing smoothing up to X = 80 and Y = 70. However, the CIPAD displays a downward trend beyond this level of smoothing.
While it is not possible or clinically responsible to be prescriptive in recommending exact smoothing parameters, there appears to be scope to increase the vendor-recommended default smoothing values from X = 40 and Y = 30 up to approximately X = 80 and Y = 70 for a fixed priority of 100. For cases where dose constraints are just within tolerance and the dose distribution appears inhomogeneous, increased smoothing rather than adjustment of the user-defined dose constraints may be a solution.
ACKNOWLEDGEMENT
Special thanks to Dr. Sabeena Sidhu for statistical input.
Declaration of interest
There are none to disclose.


