


INTRODUCTION
Blastocystis is a protist anaerobic parasite considered to be Stramenopiles [Reference Silberman1]. Faecal–oral transmission either by direct contact or waterborne transmission is currently the most accepted mode of its transmission [Reference Lee2].
A consensus on subtypes of Blastocystis terminology was proposed by Stensvold et al. [Reference Stensvold3] and, based on analyses of the small subunit rDNA (SSU rDNA) gene, at least 17 subtypes (STs) are known to colonize a range of hosts, including humans, other mammals, birds, reptiles and insects [Reference Alfellani4–Reference Scanlan and Stensvold6]. Humans have been reported to be infected mainly by ST1–ST4, whereas ST5–ST9 have been isolated only sporadically from humans [Reference Li7, Reference Yan8].
Despite being among the most common intestinal parasites infecting many animals and humans [Reference Fayer, Santin and Macarisin5, Reference Stenzel and Boreham9–Reference Stensvold11], the pathogenicity of Blastocystis still remains uncertain [Reference Stenzel and Boreham9, Reference Poirier12]. Indeed, the presence of this parasite has been linked to various gastrointestinal symptoms and signs such as diarrhoea, abdominal pain, vomiting, constipation and flatulence [Reference Tan10, Reference Stensvold11, Reference Boorom13], and it seems that it may also play a significant role in several chronic gastrointestinal illnesses of unknown causes, such as irritable bowel syndrome (IBS) and inflammatory bowel disease (IBD) [Reference Dogruman-Al14, Reference Wawrzyniak15]. On the other hand, some studies consider Blastocystis as a commensal protist in humans, lacking any pathogenic role [Reference Leder16]. Nevertheless, the parasite is able to establish a chronic infection [Reference Scanlan and Stensvold6] and is often resistant to drugs particularly in patients with severe infections [Reference Tan10]. Metronidazole administration is considered the first-line therapy, whereas cotrimoxazole and nitazoxanide are used as second-choice drugs [Reference Tan10]. It has been suggested that the pathogenic role of Blastocystis could be related to the immune system of humans, to genetic factors, to characteristics of the different subtypes (zoonotic or not) or to the synergic effect of different pathogens present in the intestinal tract of patients [Reference Stensvold3]. Previous studies have shown there is no significant difference in patients with and without symptoms harbouring the same subtype [Reference Bohm-Glöning, Knobloch and Walderich17]. In addition, Stensvold et al. [Reference Stensvold11] underlined that the subtype distribution of Blastocystis in IBS patients is independent of IBS symptoms, and patients showing chronic diseases do not harbour specific subtypes [Reference Stensvold11].
The aims of this paper were to: (a) perform molecular genotyping of Blastocystis from a large number of human faecal isolates from Italy by using sequence analysis of the SSU rDNA gene; (b) describe the occurrence of Blastocystis subtypes occurring in patients of different ages and with IBS or IBD symptoms vs. those which are mildly symptomatic; (c) estimate the genetic differentiation inter- and intra-subtype between the subtypes detected in the present study; (d) estimate the genetic variability, at the intra-subtype level, of the subtypes identified in the present survey; and (e) detect any possible association between different subtypes, haplotypes, patients' age groups and symptomatology.
MATERIALS AND METHODS
Blastocystis isolates
During the years 2012–2014, a total of 195 human faecal samples were microscopically classified as positive (by Lugol staining of a wet smear, directly or after Ridley concentration) for Blastocystis. Samples were collected from 122 male and 73 female subjects (aged 10–88 years) referred to the Umberto I Teaching Hospital from many different Italian regions; patients were classified as ‘mildly symptomatic’ or ‘symptomatic’ (Table 1). They were considered as ‘mildly symptomatic’ if suffering sporadic episodes of diarrhoea and/or constipation (a couple of episodes per month), and ‘symptomatic’ in cases where the diarrhoea persisted for ⩾2 weeks (chronic diarrhoea) or if they had IBS (defined according to Rome III criteria) and IBD (specifically ulcerative colitis). Six patients experiencing immunodeficient conditions (Kaposi's sarcoma, liver disease/HCV, monoclonal gammopathy, chronic renal insufficiency/type 2 diabetes) and complaining of gastrointestinal disorders were classified as ‘Others’ (Table 1). Data on co-infection with other intestinal parasites were also available, and the intensity of Blastocystis infection was scored as: +, 2 parasites/field; ++, 5 parasites/field; and +++, >5 parasites/field.
Table 1. Number of patients infected by Blastocystis, sequenced at the SSU rDNA gene (536 bp). Patients are reported according to clinical data and divided according to gender and age

M, Male; F, female; IBS, irritable bowel syndrome; IBD, inflammatory bowel disease; Other, includes immunodeficient patients.
DNA extraction and sequencing of Blastocystis isolates
Genomic DNA of Blastocystis was extracted from ~200 mg fresh or frozen faecal samples using the ISOLATE Fecal DNA kit (Bioline, UK) according to the manufacturer's protocol. The SSU rDNA from each isolate was amplified following the protocol described by Scicluna et al. [Reference Scicluna, Tawari and Clark18]. Amplification of DNA was performed with the Blastocystis-specific primer BhRDr (5′-GAGCTTTTTAACTGCAACAACG-3′) and the broad-specificity eukaryote-specific primer RD5 (5′-ATCTGGTTGATCCTGCCAGTC-3′) [Reference Clark19]. These primers were used in a standard polymerase chain reaction (PCR) with Taq DNA polymerase (BIOTAQ, Bioline, UK), amplifying an ~600 bp fragment of the 1800 bp SSU rDNA gene. The master mix was composed of: 5 ng DNA, 0·25 µl of each primer (12·5 pmol), 2·5 µl of 10x PCR buffer, 3·0 µl of 25 mm MgCl2, 2·5 µl of 20 mm dNTPs, 1 U (0·2 µl) of Taq DNA polymerase (BIOTAQ, Bioline, UK) and bidistilled water up to 25 µl. The amplification was performed with a thermocycler (Tpersonal, Biometra, Germany) following these conditions: initial denaturation for 1 min at 94 °C, 35 cycles of 1 min each at 94 °C (denaturation), 59 °C (annealing) and 68 °C (extension), and a final elongation step at 72 °C for 7 min. Five microlitres of the amplification products were analysed by 1% agarose gel electrophoresis with 1·5 µl Gel-Red (Biotium, USA); positive PCR products were purified using Sure Clean kit (Bioline, Italy) according to the manufacturer's recommendations. Purified products were sequenced using the amplification primer(s) (Macrogen Europe, The Netherlands). The resulting chromatograms were analysed and edited in the computer software Chromas version 2.33 (Technelysium Pty Ltd, Australia). The sequences obtained were compared to Blastocystis spp. sequences previously deposited in GenBank and available at the website (http://www.ncbi.nlm.nih.gov/genbank/) by using the BLAST application. They were aligned with SSU rDNA sequences representing ST1–ST9 using Clustal X software (www.clustal.org) for comparative analysis. Subtypes were identified by determining the exact match (100%) or closest identity (99%), according to the classification of the subtypes given by Stensvold et al. [Reference Stensvold3]. In addition, haplotype data generated from the SSU rDNA gene sequences obtained in the present study were cross-correlated to subtype allele data (retrievable at www.pubmlst.org/blastocystis).
Phylogenetic and genetic diversity analyses
The phylogenetic analysis of the sequence datasets obtained was carried out by Bayesian inference (BI) using MrBayes3·1 [Reference Huelsenbeck, Ronquist and Nielsen20]. JModeltest [Reference Posada and Buckley21] was used to determine the best-fit substitution model for the dataset considered in the study, as implemented with Akaike's Information Criterion (AIC) [Reference Posada and Buckley21]. The best-fit jML model and parameters used for the BI analysis were the following: Jukes–Cantor (JC) model + G (G = 0·137). Therefore, BI was performed using the Bayesian posterior probability analysis using the MCMC algorithm, with four chains, 0·2 as the temperature of heated chains, 1 000 000 generations, with a subsampling frequency of 100 and a burn-in fraction of 0·25. Posterior probabilities were estimated and used to assess support for each branch in the inferred phylogeny with high probability values (P > 95% is indicative of significant support) [Reference Reeder22]. The phylogenetic tree was rooted using Blastocystis lapemi (GenBank accession no. AY 590 115) and B. pythoni (GenBank accession no. AY590112) as outgroups. Inter- and intra-differentiation between subtypes was calculated using the JC model with the Mega 6 software program [Reference Tamura23].
Moreover, a median joining network, with maximum parsimony (MP) analysis as the optional post-processing calculation, was obtained by Network 4·6·1·3 software (http://www.fluxus-engineering.com) [Reference Bandelt, Forster and Röhl24, Reference Polzin and Daneschmand25] with the default settings and assumptions.
Finally, the estimation of genetic variability values, within and between subtypes, was performed using DnaSP version 5.1 [Reference Librado and Rozas26]; it included haplotype number (N h), haplotype diversity (H d) and relative standard deviation (s.d.), nucleotide diversity (π), average number of nucleotide differences (K) and number of polymorphic sites (S) [Reference Librado and Rozas26].
Statistical analysis of epidemiological data
To test the distribution of different Blastocystis subtypes among different age groups, gender and symptoms, the Wilcoxon signed-rank non-parametric test [Reference Wilcoxon27] was used. P < 0·05 was considered statistically significant. Moreover, to test for pattern of association between the different categorical variables observed in the considered patients (i.e. age group, symptoms and haplotypes observed at the SSU rDNA in the observed subtypes), a multiple correspondence analysis (MCA) was performed. MCA is an extension of correspondence analysis (CA) that can be seen as a generalization of the principal component analysis (PCA) when the variables to be analysed are categorical instead of quantitative; the patterns of ordination are obtained using a standard CA on a coded matrix (i.e. a matrix whose entries are categories) [Reference Salkind28]. The statistical analyses were performed with R (R Development Core Team, Austria).
RESULTS
Molecular subtyping of Blastocystis isolates
Of the 195 faecal samples positive for Blastocystis sp. in the microscopical analysis, 189 proved to be positive by PCR, and the expected 536 bp fragments of the SSU rDNA gene amplified were successfully sequenced.
Sequences obtained showed a high identity (98–100%) to homologous sequences of Blastocystis isolates previously reported in GenBank and, according to the consensus terminology [Reference Stensvold3] and based on the phylogenetic analysis carried out by BI inference, enabled the clustering of our isolates into six Blastocystis subtypes (Fig. 1). In detail, 29 isolates clustered with ST1 (AY135403 and AB107961), 26 formed a distinct clade with ST2 reference sequences (AB070997 and AB107969), 86 clustered with the reference sequence ST3 (AB091235 and AB107965), 41 clustered with the ST4 sequence deposited in GenBank (JF274689 and AY590114), six clustered with the ST6 GenBank sequence (AB070994 and AB091238), and one sample corresponded to ST8, forming a distinct clade with ST8 reference sequence (AB107970) (Fig. 1). The clades obtained using BI received very high percentages of posterior probabilities, thus supporting the clustering of the Blastocystis isolates of the present study as belonging to distinct subtypes (Fig. 1).

Fig. 1. Bayesian inference (BI) tree based on sequences obtained at the SSU rDNA gene (536 bp) of Blastocystis isolates of the present study, performed using MrBayes 3·1 [Reference Huelsenbeck, Ronquist and Nielsen20], with the best-fit model for the dataset, as implemented in jModeltest with Akaike's Information Criterion [Reference Posada and Buckley21]; the parameters are: JC + G (G = 0·137). For Bayesian analysis, four incrementally heated Markov chains (using default heating values) were run for 1000 000 generations, sampling the Markov chains at intervals of 100 generations. Numbers at the nodes are posterior probabilities. The sequences of Blastocystis obtained in the present study were analysed in comparison with the sequences available in GenBank for all the Blastocystis subtypes detected genetically on the basis of the same gene, and are reported with their accession numbers (ST1 = AY135403 and AB107961; ST2 = AB070997 and AB107969; ST3 = AB091235 and AB107965; ST4 = JF274689 and AY590114; ST6 = AB070994 and AB091238; ST8 = AB107970). B. lapemi (accession no. AY590115) and B. pythoni (accession no. AY590112) were used as outgroups.
The SSU rDNA gene sequences obtained in the present study have been deposited in GenBank under accession nos. KP284167 to KP284175, as detailed in Table 2.
Table 2. Values of Blastocystis inter-subtypes (below the diagonal) and intra-subtypes (along the diagonal)
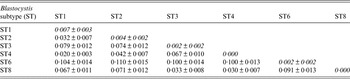
Genetic differentiation ±standard deviation among isolates identified in the present study calculated using the JC model with Mega 6 software program [Reference Tamura23].
Genetic diversity at the inter- and intra-subtype level
At the inter-subtype level, the genetic differentiation values [Reference Jukes, Cantor and Munro29] ranged from a minimum of JC = 0·02, found in our samples between ST1 and ST4, to higher values such as that observed between ST6 and the remaining subtypes identified in our samples (Table 2).
At the intra-subtype level, a high genetic homogeneity was recorded in ST4 (JC = 0·000), whereas higher genetic variation was found in isolates corresponding to ST1 (JC = 0·007) and among those belonging to the clade of ST2 (JC = 0·004) (Table 2).
Accordingly, the median joining network analysis showed great genetic diversity among the distinct subtypes, and some genetic variation at the intra-subtype level was observed in some subtypes (Fig. 2). The median joining network analysis showed the existence of distinct clades, including different haplotypes, designated H1–H20, among the Blastocystis subtype isolates analysed. The haplotypes are shown in Figure 2 and are reported with their relative proportions as occurring in our isolates. A low genetic variation was found in Blastocystis isolates corresponding to ST4; a single haplotype (designated H2) was found, whose relative proportion represented 22·0% of the haplotypes detected in the present study. Similarly, ST3 resulted relatively homogenous in the isolates detected with only three distinct haplotypes found, i.e. H1, H3 and H7. They were found to correspond, respectively, to allele nos. 34, 36 and 37 at the rDNA barcoding of Blastocystis (available at www.pubmlst.org/blastocystis). Of those haplotypes, H1 was the most abundant in our isolates, showing a relative proportion of 34·0%. On the other hand, nine distinct haplotypes were found in the clade formed by ST1, even if they were present at a lower percentage (Fig. 2). Of these, H15 and H16 matched allele nos. 77 and 4, respectively (www.pubmlst.org/blastocystis). Furthermore, the H4 variant observed in ST2 (Fig. 2) corresponded to allele no. 9; and the H11 variant in ST6 matched the sequence of allele no. 123 (www.pubmlst.org/blastocystis). Finally, in ST8, the H19 variant (Fig. 2) was found to correspond to allele no. 95 (retrievable at www.pubmlst.org/blastocystis). The remaining haplotypes detected in the present study, did not match any alleles so far available at www.pubmlst.org/blastocystis.
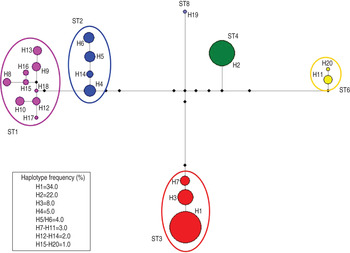
Fig. 2. Median joining network analysis of the SSU rRNA sequences obtained in Blastocystis subtypes detected in the present study. It was estimated using maximum parsimony (MP) analysis as the optional post-processing calculation using Network 4·6·1·3 software (http://www.fluxus-engineering.com) [Reference Bandelt, Forster and Röhl24, Reference Polzin and Daneschmand25] with the default settings and assumptions. Each haplogroup represents a distinct subtype to which a different colour is given. The haplotypes are numbered from H1 to H20; their frequency is given in the box of the figure and is represented by the size of the circle. The number of the haplotype connection represents a single base difference; the missing haplotypes are indicated by black circles.
According to the results obtained by the median joining analysis, a higher level of genetic variability values (Table 3) were observed in ST1, with a nucleotide diversity π = 0·0067, haplotype diversity (H d) = 0·892 and number of polymorphic sites (S) = 8. Nevertheless, a lower level of genetic variability was found in ST2 and ST3, which exhibited a nucleotide diversity π = 0·0033 and π = 0·0008 and haplotype diversity H d = 0·751 and H d = 0·419, respectively. Finally, for ST4, π = 0·0000 and H d = 0·000.
Table 3. Genetic variability estimates in isolates of Blastocystis subtypes (STs) identified in the present study, according to the following parameters

N, Number of sequences analysed; N h, haplotype number; H d, haplotype diversity; s.d., relative standard deviation; π, nucleotide diversity; K, average number of nucleotide differences; S, number of polymorphic sites.
Correlation between Blastocystis subtypes and patient characteristics
No significant correlation was found between patients' gender and Blastocystis sp. infection (P > 0·05). Regarding age, some significant difference (P = 0·016) was observed in the distribution of ST3 between different age groups, being more prevalent in patients belonging to age groups II, III and IV than in the older patients of groups V and VI (Table 4). Similarly, a significant difference with regard to age (P = 0·016) was found in patients infected with ST1, with the highest infection rate occurring in group III. Finally, a slightly significant correlation was found in the distribution in relation to age in patients with ST4 and ST2 (P = 0·031).
Table 4. Age distribution of patients positive for distinct Blastocystis subtypes identified in the present study
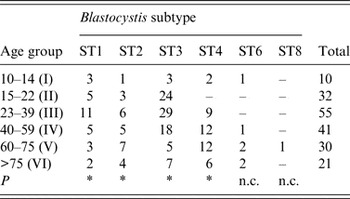
ST, Subtype; P, probability value at the Wilcoxon signed-rank non-parametric test; n.c., not calculated because of the low number of patients found at those subtypes.
* P < 0·05.
As for the possible link between Blastocystis subtypes and the occurrence of IBS and IBD, some significant correlation (P = 0·031) was found in patients infected with ST4; indeed, several of them presented IBS as a functional disorder at the gastrointestinal level and another had IBD or chronic diarrhoea (Table 5). Similarly, a slightly positive correlation (P = 0·032) was observed between the occurrence of ST2 and ST3 in patients who presented IBS symptoms, even after the exclusion of patients having ST3 in co-infection with other parasites. Indeed, 18/86 faecal samples positive for ST3 were also positive for other protozoan parasites (Entamoeba coli, E. histolytica complex, Endolimax nana, Iodamoeba bütschlii), which were found co-occurring in both symptomatic (n = 9) and mildly symptomatic (n = 9) patients. Finally, no significant association was found between ST1 and the occurrence of symptoms (P = 0·062).
Table 5. Subtype identification of human Blastocystis isolates in symptomatic and mildly symptomatic patients, analysed in the present study, reported with their accession number of the SSU rDNA sequences (536 bp) deposited in GenBank
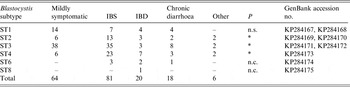
ST, Subtype; IBS, irritable bowel syndrome; IBD, inflammatory bowel disease; P, probability value at the Wilcoxon signed-rank non parametric test; n.s., not significant; n.c., not calculated because of the low number of patients examined at that subtype.
* P < 0·05.
The results of the MCA, performed to test the possible role of different variables (occurrence of infection with distinct subtypes, observation of haplotypes, patients' age) in the appearance of IBD or IBS and other manifested disorders, are reported in Figure 3. All variables used had a significant contribution to the observed pattern of ordination in the 189 patients (isolates) with respect to the first axis of ordination MCA1, which explained by age (r 2 > 0·58 and P < 0·001 for all variables). A slightly higher percentage of MCA2 was explained by the different haplotypes of the detected subtypes present among the patients (r 2 = 0·57 and P < 0·001), although both age and symptoms contributed to the ordination of the patients along the second axes (r 2 > 0·45 and P < 0·001). This result, in terms of the percentage of ordination, also appeared to be explained by both axes, which assumed almost similar values (~7%).

Fig. 3. Pattern of ordination of infected patients given by multiple correspondence analysis (MCA). Colours correspond to the different subtypes (ST) detected: black = ST1; red = ST2; green = ST3; blue = ST4; turquoise = ST6. MCA1 and MCA2 are the main axes of ordination, and are mostly correlated with age (MCA1) and haplotype (MCA2), although the very similar values in the percentage of explained variance by MCA1 and MCA2 suggest the role of both age and symptoms in the ordination pattern of patients.
DISCUSSION
Very few isolates (n = 6) proved negative by PCR analysis, despite repeated DNA extractions and numerous attempts to optimize the PCR conditions. A negative PCR analysis was probably due to the small amount of Blastocystis DNA being below the detection level (the patients were positive only with a rate +), or to the presence of known PCR inhibitors in the stools, or to DNA degradation due to a long storage time, or, finally, to a misidentification by light microscopy.
In Italy, a previous molecular identification of Blastocystis isolates from 30 symptomatic patients, carried out by using SSU rDNA sequence analysis, showed the occurrence of ST3 as the most prevalent subtype, followed by ST2, ST1, ST7 and ST8, but a small number of the patients had subtype ST4 [Reference Meloni30]. The present work improves our knowledge of the occurrence of subtypes of Blastocystis identified in a large number of patients (n = 189), both ‘mildly symptomatic’ and ‘symptomatic’, which, in addition to ST1, ST2, ST3, ST8 and ST4, ST6 was also found. Of those, ST3 proved the most prevalent subtype, found in 86/189 patients (46·0%), followed by ST4, identified in 41/189 patients (21·7%), ST1 in 29/189 patients (15·3%), ST2 in 26/189 patients (13·8%) and ST6 in 6/189 patients (3·2%); finally, a single patient harboured ST8. Thus, with respect to a previous study performed in Italy [Reference Meloni30], ST6 was detected for the first time. Moreover, in agreement with previous identifications from Denmark [Reference Stensvold31, Reference Rene32], Sweden [Reference Forsell33], Ireland [Reference Scanlan and Marchesi34] and Italy [Reference Meloni30], a greater percentage of ST4 was indicated, and the relative proportions found for ST1, ST2, ST3 and ST4 are quite similar to those observed in Europe by different authors [33, and citations therein].
Of the 20 haplotypes detected in Blastocystis subtypes in the present study, eight cross-corresponded to alleles previously observed and so far available at www.pubmlst.org/blastocystis. The remaining haplotypes recorded here were novel for several subtypes (ST1, ST2, ST4, ST6). Interestingly, H1, which resulted the most frequent haplotype in our isolates, matched allele no. 34, which represents the most common variant found in humans worldwide.
A low-level of genetic variability was found in the ST4 sequences obtained from isolates identified in the present study; these sequences matched those deposited in GenBank for Blastocystis ratti, sequenced at the same gene (AY590114) [Reference Noël35], indicating a close genetic relationship with this taxon. The genetic variation in the nuclear SSU rDNA found in our isolates of ST4, which is low compared to ST3, agrees with previous findings [Reference Forsell33, Reference Noël35, Reference Stensvold, Alfellani and Clark36] and, according to Stenvold [Reference Stensvold37], if added to data from multilocus sequence typing (MLST) of the mitochondrion-like organelle genome, could be related to the fact that the ST4 lineage has extended its range to humans during its more recent evolutionary history [Reference Forsell33, Reference Stensvold37]. Therefore, according to this hypothesis, its pathogenic role could be greater than that observed for the other subtypes. In support of this premise, the percentage of patients infected by ST4 and characterized by IBS, IBD or chronic diarrhoea was very high (87·2%) compared to mildly symptomatic patients. These findings, which were also determined by previous authors [Reference Forsell33, Reference Stensvold37], confirm that ST4 has a potential pathogenic role independent of the age and gender of the patient (Tables 4 and 5). Rodents may be a reservoir for human Blastocystis infections of ST4, as proposed by Noël et al. [Reference Noël35], underlying its zoonotic role for humans and indicating a recent entry in the human population [Reference Scanlan and Stensvold6].
By contrast, a higher genetic variability was observed in the sequences analysis of our isolates belonging to ST1, ST2 and ST3. In particular, ST1 showed a high degree of intra-subtype genetic variation with up to nine distinct haplotypes detected, at different relative proportions, mostly in the 23–39 years age group, but proved not to be significantly associated with a particular disease. Nevertheless, ST2 proved to be associated with IBS disease; in this regard, a cross-sectional study carried out on patients with IBS, identified ST2 as the most prevalent subtype, even if the most common genotype was ST4, allele 42 [Reference Engsbro38]. In accordance with previous findings [Reference Alfellani4], the high level of genetic variability found in ST1 and ST2 isolates of the present study seems to support the low host specificity of these subtypes. Indeed, both ST1 and ST2 have been found in a wide range of animals, including monkeys, cattle, pigs, dogs and non-human primates, whereas they rarely occur in chickens (Fig. 4). Therefore, it is been suggested that these subtypes of animal origin are zoonotic subtypes, able to infect humans at different frequencies [Reference Lee2, Reference Yan8, Reference Stensvold11, Reference Noël35].

Fig. 4. Bayesian inference (BI) tree based on sequences obtained for the SSU rDNA gene of subtype isolates, mapped in association with their main hosts.
Finally, the genetic variability found in sequences of ST3 using the SSU rDNA gene was at a similar level to that found in a previous study [Reference Stensvold, Alfellani and Clark36]. The latter authors detected a substantial genetic variation at the intra-subtype level in ST3 by analysing both the nuclear SSU rDNA and MLST of the mitochondrion-like organelle genome. Moreover, data obtained by MLST showed that many ST3 strains from non-human primates are distinct from those found in humans, indicating that cryptic host specificity exists, at least in this subtype [Reference Alfellani4, Reference Stensvold, Alfellani and Clark36]. Indeed, ST3 was predominant in humans but had a relatively low prevalence in different animals. It was suggested that it is the only subtype of human origin having a human-to-human transmission [Reference Tan10, Reference Noël35, Reference Stensvold, Alfellani and Clark36, Reference Stensvold37]. ST3 exhibits high intra-subtype diversity and may have co-evolved with human hosts over a longer period than ST1, ST2 and even ST4, which may have colonized humans at different times over an evolutionary time scale [Reference Scanlan and Stensvold6].
Interestingly, in Blastocystis isolates analysed in the present study, ST3 was found to be associated with patients complaining of IBS belonging to age groups III and IV (23–59 years), but it was not correlated to a pathological state in older patients (aged 60–>75 years). According to the ‘hygiene hypothesis’, it has been suggested that the incidence of IBD has increased markedly during recent decades in industrialized countries where helminths are rare [Reference Rook39]. By contrast, IBD is still uncommon in global areas where most people harbour worms. Indeed, this hypothesis, based on Darwinian medicine, incorporates the concept of ‘old friends’, which states that the co-evolutionary history of humans with microbes has led to a state of host-evolved dependence on this microbiota. Having this concept in mind, it has been suggested that specific subtypes/genotypes of Blastocystis should be considered as ‘old friends’ [Reference Rook39], as they may be required for intestinal homeostasis and/or serve as a marker of intestinal homeostasis [Reference Scanlan and Stensvold6]. In addition, there is evidence to suggest that certain genotypes of Blastocystis may actually form part of the normal human intestinal microbiota, since Blastocystis has been detected in healthy and asymptomatic hosts for extensive periods of time [Reference Scanlan and Stensvold6, Reference Scanlan and Marchesi34]. In this regard, data by Krogsgaard et al. [Reference Krogsgaard40] suggested that Blastocystis (and Dientamoeba fragilis) contribute to the diversity of microbiota, and their absence could be a potential indicator of intestinal dysbiosis. In order to persist for such an extended period of time, Blastocystis must either evade the immune response, or be recognized as a ‘friend’. Furthermore, the predominance of ST1–ST3 (the subtypes most commonly associated with humans, as confirmed also in the present study) in non-human hosts, such as cattle and pigs [Reference Alfellani4], would suggest that these subtypes have shared co-evolutionary history with humans and their closest living relatives. Consequently, the lack of exposure to intestinal helminths in young generations living in industrial countries, compared to previous generations (which would have been exposed to several helminths during their youth, as is the case in Italy), may negatively affect the development of the immune system, predisposing them to infection even by an ‘old friend’ parasite, such as ST3 of Blastocystis. This theory appears to be supported by the finding that our patients with ST3 and affected by IBD or IBS are restricted to patients in the 15–50 years age group, which could be considered as human generations who, in Italy, have had fewer contacts with intestinal helminths during their youth.
However, the multivariate analysis applied here does not indicate a clearly defined association between occurrence of symptoms and the variables ‘Blastocystis subtypes’, ‘haplotypes of Blastocystis’ and ‘patients’ age’ (Fig. 3). The only exception was found in the cases of ST4 and ST6, which proved mostly associated with clinical manifestations (Fig. 3). This suggests that several other variables, relating to parasite pathogenicity and the human host, are responsible for the occurrence of the disease. Indeed, it has been demonstrated that cysteine-protease may be also considered as an essential virulence factor responsible for variation in the pathogenicity of Blastocystis subtypes. On the other hand, human host variables (such as immunosuppression, host genotype, presence of virus or bacteria associated with Blastocystis, parasite load, dysbiosis, etc.) could also be responsible for the association with clinical features of the disease attributed to Blastocystis subtypes.
Finally, a greater knowledge of the evolutionary history of Blastocystis subtypes could, in future, explain any pathogenic aspects related to distinct subtypes. In the present study, the existence of subtypes representing distinct phylogenetic lineages was demonstrated. The phylogenetic relationships observed in the different subtypes are similar to those inferred by previous studies [Reference Stensvold3, Reference Forsell33, Reference Noël35]. Interestingly, the BI presented here shows the existence of two distinct and well supported clades (Fig. 4): the first, Clade I, encompasses six subtypes (i.e. ST1, ST2, ST3, ST4, ST5, ST8) that have been found to parasitize mainly mammals, including humans, whereas the second, Clade II, includes two subtypes (i.e. ST6, ST7) that have been found mainly in homeothermic vertebrates, such as birds. The latter subtypes are considered as zoonotic for humans. Furthermore, according to the BI analysis, it seems that ST6 and ST7 represent sister taxa with respect to the subtypes included in Clade I; they also exhibited high genetic divergence values compared to the subtypes comprising Clade I (average JC distance ≈0·12).
Future genomic analysis may clarify possible co-evolutionary aspects, which, in turn, could provide data for understanding Blastocystis biology, host–parasite interactions and pathogenicity to humans. In addition, proteomics of the different subtypes of Blastocystis would improve the knowledge about mechanisms involved in the pathogenicity of these parasites to humans.
Finally, further molecular epidemiological studies are required in Italy to determine the occurrence and distribution of subtype isolates from other vertebrates (pigs, cattle, domestic animals, rodents, etc.) in order to clarify the pathways of zoonotic transmission to humans.
ACKNOWLEDGEMENTS
The authors thank two anonymous referees, whose remarks and suggestions have greatly improved the manuscript. We are very grateful to Dr David I. Gibson (Natural History Museum, London) for reading the manuscript.
DECLARATION OF INTEREST
None.


