


1 Introduction
In many real-life situations, people experience a conflict between their own personal interests and the interests of others. For instance, each person is individually better off when he or she does not contribute to public goods such as blood banks and health care. However, if everyone acts according to this logic, these public goods will cease to exist. Along similar lines, people might be tempted to further their self-interest by harvesting excessively from common resources such as water and energy. However, it would be better for everyone to consume such resources sparingly, in order to prevent them from becoming depleted. Situations such as these in which people must decide between maximizing selfish or collective interests are generally referred to as social dilemmas (Reference DawesDawes, 1980; Reference Komorita and ParksKomorita & Parks, 1995; Reference Weber, Kopelman and MessickWeber, Kopelman & Messick, 2004).
In order to investigate social dilemmas empirically, scholars have modeled these conflicting interests in a range of mixed-motive games (Reference Dawes and MessickDawes & Messick, 2000; Reference Murnighan and WangMurnighan & Wang, 2016). A critical question that arises from this approach is the extent to which game behavior reflects how people act in real-life. Extant research provides only limited insight into this question. The present study therefore aimed to examine the extent to which mixed-motive games model prosocial behavior in everyday life. In particular, we asked whether mixed-motive games are more strongly related to real-life prosocial behavior when game behavior and prosocial behavior are measured multiple times in different variations instead of only one time in a single variant.
1.1 Modelling Social Dilemmas into Mixed-Motive Games
Over the last few decades, various mixed-motive games have been developed. Each of these games is designed to study specific aspects of behavior that benefits the collective, also called prosocial behavior (Reference KollockKollock, 1998; Reference Haesevoets, Reinders Folmer and Van HielHaesevoets, Reinders Folmer & Van Hiel, 2015; Reference Van Lange, Joireman, Parks and Van DijkVan Lange, Joireman, Parks & Van Dijk, 2013). In the present study, we rely on the Prisoner’s Dilemma, the Commons Dilemma, and the Public Goods Dilemma. These three games are among the most commonly studied games in psychological research. Moreover, these games represent human interactions in a variety of settings. Below, we discuss the main characteristics of these three games.
1.1.1 Prisoner’s Dilemma
The Prisoner’s Dilemma (Reference AxelrodAxelrod, 1984; Reference Axelrod, Riolo and CohenAxelrod, Riolo & Cohen, 2002) is the most straightforward example of a mixed-motive game as it involves only two players, who each simultaneously face a dichotomous choice between a cooperative and a defective alternative. An example of the Prisoner’s Dilemma is provided in Figure 1. If in this example one of the two players defects and the other player cooperates, the cooperative player receives a payoff of $0 and the defector receives a payoff of $3. However, if both players defect they both receive a payoff of $1. And, if both Players cooperate they both receive a payoff of $2. Thus, each player is individually better off defecting regardless of what the other player does. However, previous research has shown that people do not always act on their self-interest but also display considerable levels of cooperation (e.g., see Reference Roth and MurnighanRoth & Murnighan, 1978). This dilemma reflects social dilemma situations in politics such as political advertising and international relations, although its basic dimensions are also present in many other situations such as market competition in economics and doping use in sports.
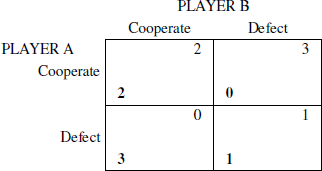
Figure 1: Examples of a Prisoner’s Dilemma: The best outcome for each player is to unilaterally defect (DC; payoff = $3), the second best outcome is mutual cooperation (CC; payoff = $2), the second worst outcome is mutual defection (DD; payoff = $1), and the worst outcome is to unitarily cooperate (CD; payoff = $0). Player A’s outcomes are in bold.
1.1.2 Commons Dilemma
An important characteristic of many real-life social dilemma situations, however, is the involvement of multiple parties. Several multiple-player games have therefore been developed. One prominent multiple-player game is the Commons Dilemma (Reference HardinHardin, 1968; Reference DawesDawes, 1980; Reference Van Dijk and WilkeVan Dijk & Wilke, 2000). In the Commons Dilemma, multiple players share a limited common resource pool from which everyone may harvest, with the potential danger of overuse because the resource is in limited supply. In its classical form, this dilemma describes a group of cattle herders having open access to a common parcel of land on which they all can let their cows graze. It is in each herder’s interest to put as many cows as possible onto the land. However, if all herders would make this individually reasonable decision, the land is overgrazed and the common good will soon be destroyed. Then, the herders will be worse off compared to the situation where only small harvests were made. The Commons Dilemma concerns the maintenance of collective resources such as clean water, fresh air, fish, and energy. In addition, this game also reflects collective problems like commuting and traffic congestion.
1.1.3 Public Goods Dilemma
The Public Goods Dilemma (Reference Allison and KerrAllison & Kerr, 1994; Reference OlsonOlson, 1965; Reference Van Dijk and WilkeVan Dijk & Wilke, 2000) is another multiple-player game. In this game, people must choose between withholding resources for private use or contributing these resources to a public good. A public good reflects a shared resource from which all may benefit, regardless of whether or not they have helped to provide or sustain it. For instance, people can enjoy public television whether or not they contribute any money. Public goods are thus non-excludable, and as a result there is the temptation to enjoy the good without contributing to its creation or maintenance. The interests of each person are therefore best served by not contributing, and free-riding on the contributions of others instead. However, if too many individuals make this individually rational choice the public good will not be provided or will cease to exist.
1.2 Prosocial Behavior in Everyday Life
An important limitation of the mixed-motive game approach, however, is that these games do not represent “the complex totality of humans’ interpersonal interactions” (Reference Murnighan and WangMurnighan & Wang, 2016, p. 80). Compared to daily-life situations, mixed-motive games are abstract and often framed in monetary outcomes, which might reduce the impact of processes that lead to prosocial behavior in real-life (see Poppe, 2005, for a similar argument). Scholars have acknowledged the lack of mundane realism in experimental games for a long time. Reference Tedeschi, Schlenker and BonomaTedeschi, Schlenker, and Bonoma (1973, p. 203), for example, noted that “no generalizations about social phenomena based exclusively on laboratory experiments could be safely assumed to be applicable in natural social environments without further inquiry.” Reference Pruitt and KimmelPruitt and Kimmel (1977, p. 387) similarly argued that “the strategic nature of the gaming environment is characteristic of only certain settings and frames of mind in the outside world” and, as such, “one must be aware of the dangers of overgeneralizing as a result of ignoring critical background conditions that differ between the laboratory and the target setting.” In reaction to these statements, Reference Van Lange, Bekkers, Schuyt and VugtVan Lange, Bekkers, Schuyt and Van Vugt (2007, p. 376) more recently underscored “the importance of bridging the gap between ‘games’ and more ‘mundane’ or everyday forms of interpersonal behaviors” (see also Reference Allison, Beggan and MidgleyAllison, Beggan & Midgley, 1996; Reference Van Vugt, Snyder, Tyler and BielVan Vugt, Snyder, Tyler & Biel, 2000).
Several empirical studies have examined directly whether the same participants react similarly inside and outside of the lab (e.g., see Reference Carpenter and SekiCarpenter & Seki, 2011; Reference Fehr and LeibbrandtFehr & Leibbrandt, 2011; Reference Kolstad and LindkvistKolstad & Lindkvist, 2012; Reference LeibbrandtLeibbrandt, 2012; Reference Levitt and ListLevitt & List, 2007a, 2007b; Reference Van Lange, Van Vugt, Meertens and RuiterVan Lange, Van Vugt, Meertens & Ruiter, 1998; Reference Voors, Bulte, Kontoleon, List and TurleyVoors, Bulte, Kontoleon, List & Turley, 2011; Reference Voors, Turley, Kontoleon, Bulte and ListVoors, Turley, Kontoleon, Bulte & List, 2012). However, a closer inspection of these studies reveals that their results are inconsistent. That is, some studies have found significant correlations between behavior in particular games and everyday forms of prosocial behavior, whereas others have found no significant correlations.
Recently, Reference Galizzi and Navarro-MartínezGalizzi and Navarro-Martinez (2019) conducted a meta-analysis of previous literature on the external validity of mixed-motive games. Their results revealed an overall average lab-field correlation of .14 across all studies, whereas the average correlation in the papers that reported significant correlations was .27. Based on these findings, the authors concluded that “there is currently only weak evidence of correlation between these social preference games and behavior in the field” (p. 977) and that their “results are worrying and call for more, and more systematic, research on this issue” (p. 987).
1.3 Aggregation Through Multiple Measurements
A possible problematic aspect of most prior studies on the external validity of mixed-motive games is that they typically administered these games in only one single version. Such one-shot measurements of game behavior may suffer from a number of shortcomings (Reference Nunnally and BernsteinNunnally & Bernstein, 1994; Reference SpectorSpector, 1992). First, measuring game behavior with a single trial might prove unreliable due to measurement error. The aggregation over multiple, non-identical game trials averages out this random error, which results in a more precise measurement of game behavior. Indeed, behavior is notoriously unstable and influenced by a host of factors, which necessitate its repeated measurement (Reference Rushton, Brainerd and PressleyRushton, Brainerd & Pressley, 1983). Moreover, the use of single game trials can also be expected to lead to low variability, which precludes the detection of fine-grained behavioral differences by reducing the number of points of discrimination and thus reducing measurement range. For example, the Prisoner’s Dilemma allows only two different response options, those being defection or cooperation. With the use of a single game trial participants can thus obtain a score of either zero or one. When this game is measured with, for instance, eight different game trials, in different variations of the payoff structure, the summed responses can range from zero to eight, which greatly increases the ability to distinguish different degrees of defection and cooperation.
However, the aggregation principle does not only yield more stable and precise estimates of game behavior; it can also be applied to prosocial behavior in everyday settings. Indeed, single indicators of real-life prosocial behavior might also inflate measurement error. According to this perspective, the use of multiple instances of prosocial behavior should similarly be preferred over the use of only a single measurement (for more information on the pro and cons of single and multiple item measurements, see Reference Bergkvist and RossiterBergkvist & Rossiter, 2007; Reference Gardner, Cummings, Dunham and PierceGardner, Cummings, Dunham, & Pierce, 1998; Reference Sarstedt and WilczynskiSarstedt & Wilczynski, 2009; for more information on the principle of aggregation, see Reference Rushton, Brainerd and PressleyRushton et al., 1983).
1.4 The Present Study
In the present paper, we propose that the use of single-shot measures of game behavior and/or the use of single indicators of prosocial behavior in prior research can possibly explain why so many of these previous studies failed to obtain significant associations. To explore this possibility, participants in our study played eight different trials of the Prisoner’s Dilemma, the Commons Dilemma, and the Public Goods Dilemma. Each of these trials consisted of a different variation of the payoff structure. To measure a variety of real-life prosocial behaviors, we included a comprehensive set of prosocial behavioral measures related to giving blood, donating money to noble causes, volunteering, commuting behaviors, and various forms of environmental behaviors. Moreover, we also administered some measures that reflect more distant forms of prosocial behavior such as civil participation and activism.
Besides these three laboratory games and this wide set of real-life prosocial behaviors, we additionally included a measure of participants’ social value orientation. Social value orientation (SVO) reflects a person’s preference for the allocation of resources between oneself and another person in interdependent situations (Reference Messick and McClintockMessick & McClintock, 1968; Reference Van LangeVan Lange, 1999). SVO is a particularly interesting variable in the context of the present study, because instruments that measure this concept are based on multiple hypothetical game-like decisions.
2 Method
2.1 Sample and Procedure
We recruited 225 first year psychology students from a Belgian University. They participated in exchange for partial fulfillment of course credit for a Social Psychology course. Up to 45 participants were run simultaneously in a large computer room, in which each participant was seated at a separate desk in front of a computer. Participants first completed a paper-based SVO questionnaire, followed by an online questionnaire that consisted of various real-world prosocial behavioral measure. Next, participants played incentivized versions the mixed-motive games with other students via connected computers. All participants first played a series of eight one-shot Prisoner’s Dilemma Games, followed by a series of eight one-shot Commons Dilemma Games and a series of eight one-shot Public Goods Dilemma Games. For each participant, the eight trials of each game were presented in a (different) randomized order. Before the start of the games, participants were informed that in each game trial they would randomly be matched with one or more other participants in the session. It was made clear to participants that they would never play more than one game trial with the same person. Moreover, to avoid that participants’ decisions would be influenced by the choices of the other players, participants were informed that they would receive no feedback about the other players’ choices during the experiment. In reality, however, participants were not directly connected to each other during the study, but were manually paired at the end of the experimental session, and paid according to the outcome that resulted from each player’s decision in one randomly selected game trial.Footnote 1 In the week after the experiment took place, participants were asked to complete an online survey that probed several individual difference measures.Footnote 2 Participants had to complete both the experimental session and the online survey in order to receive their course credit.
Three participants (1.3%) did not complete the online survey. Therefore, their data were excluded from the reported analyses. Because insufficient levels of attention and/or comprehension may result in poor data quality, we included several check questions in the different parts of our study. Of the remaining 222 participants, 44 participants (19.8%) failed to answer sufficient check questions correctly, and were therefore also excluded from the reported analyses. More detailed information on the employed inclusion criteria can be found in Appendix A. This procedure resulted in a final sample of 178 participants who were on average 18.55 years old (SD = 1.97; 35 males and 143 females).Footnote 3
2.2 Social Value Orientation (SVO)
Participants’ SVO was measured using the six-item version of the SVO Slider Measure (Reference Murphy, Ackermann and HandgraafMurphy, Ackermann & Handgraaf, 2011). Based on participants’ most preferred allocations in six hypothetical distribution decisions, the SVO angle for each individual was constructed. Importantly, the SVO Slider Measure captures the four most common idealized orientations (i.e., altruistic, cooperative, individualistic, and competitive) and produces a continuous scale rather than a nominal category. Essentially, a larger SVO angle indicates a greater concern for others (M = 30.69, SD = 9.82, range = −2.02 to 52.08). More details concerning the six SVO Slider items can be found in Appendix B.
2.3 Mixed-Motive Games
Using identical game trials holds the risk that participants would provide the same answer in every trial. To avoid this, we created eight different versions of each game by manipulating two central game features. More specifically, in all three games we manipulated the size of the available endowments. In addition, in the Prisoner’s Dilemma we also manipulated the level of non-correspondence between the players’ outcomes, whereas in the Commons Dilemma and the Public Goods Dilemma we also manipulated the factor with which the remaining or given resources were multiplied (more information below). Participants played the game variants for units (each unit being worth 0.01 euro). The descriptive statistics of the game behaviors are included in Table 1. Appendix C provides the exact setup and payoff structure of each game trial; Appendix D visualizes the distributions of participants’ choices across the eight different game trials.
Table 1: Setup of the different game trials and descriptive statistics of the game behaviors.
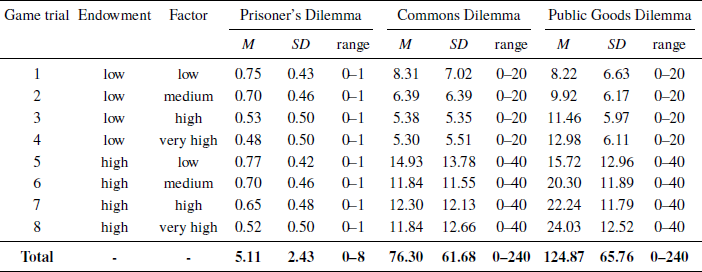
Note. “Factor” is the non-correspondence/multiplication factor. The total scores represent the sum scores of the eight game trials. In the Prisoner’s Dilemma trials, participants had to choose between a defective (scored 0) and a cooperative (scored 1) option. In the Commons Dilemma trials, participants had to indicate how many collectively owned resources they wanted to harvest. In the Public Goods Dilemma trials, participants had to indicate how many individually owned resources they wanted to contribute. More details on the exact setup of the different game trials is included in Appendix C; Appendix D visualizes the distributions of participants’ choices across the different Commons Dilemma and Public Goods Dilemma trials.
2.3.1 Prisoner’s Dilemma
In the Prisoner’s Dilemma, two players have to choose simultaneously between a cooperative and a defective alternative. In order to create eight different game variants, we orthogonally manipulated the endowment size (low vs. high) and the level of non-correspondence (low vs. medium vs. high vs. very high) in the different game trials. The high endowments were always double the size as the low endowments. The level of non-correspondence varies the level of conflict between individual and collective outcomes, and can be expressed in terms of Reference RapoportRapoport’s (1967) K-index of cooperation. This index captures the benefit of mutual cooperation over mutual defection, relative to the benefit of exploitation over the sucker’s payoff. To create four different non-correspondence levels, we decreased the payoff of mutual cooperation while simultaneously increasing (to an equivalent extent) the payoff of mutual defection; while the outcomes of unilateral defection and unilateral cooperation were held constant. The resulting four non-correspondence levels are characterized by a K-index of 0.80 (low non-correspondence), 0.60 (medium non-correspondence), 0.40 (high non-correspondence), and 0.20 (very high non-correspondence), respectively (see Appendix C for more information on these calculations).Footnote 4 Higher levels of non-correspondence are expected to result in less cooperative behavior. As shown in Table 1, on average, participants chose the cooperative option in about five of the eight game trials (M = 5.11, SD = 2.43, range = 0 to 8).
2.3.2 Commons Dilemma
In the Commons Dilemma, four players had to simultaneously decide how much to harvest from a collective resource pool. Participants were informed that, at the end of each game trial, the resources that the players left in the collective pool would be multiplied by a multiplication factor and then distributed equally among the four players, regardless of how much they harvested. The eight game trials were created by orthogonally manipulating the endowment size of the resource pool (low vs. high) and the magnitude of the factor by which the remaining resources would be multiplied (low vs. medium vs. high vs. very high). In the high endowment trials, the resource pool from which participants could harvest consisted of double the resources as in the low endowment trials. In the low multiplier trials, participants were told that the resources that were not taken by the players would be multiplied by factor 1.5. The multiplication factor was 2 in the medium multiplier trials, 2.5 in the high multiplier trials, and 3 in the very high multiplier trials. These four multiplier levels thus differed in terms of the profitability of not harvesting collectively owned resources, and hence the level of conflict between individual and collective outcomes. Higher multipliers are expected to result in less taking behavior. Across the eight game trials, participants harvested on average 76.30 resources (SD = 61.68, range = 0 to 240) from the collective resource pool (see Table 1).
2.3.3 Public Goods Dilemma
In the Public Goods Dilemma, four players had to decide simultaneously how much of their individual resources they wanted to contribute to the collective. At the end of each game trial, the total amount of resources that was contributed by the four players was said to be multiplied by a multiplication factor and then distributed equally among the four players, regardless of their contributions. The eight game trials were created by manipulating the endowment size of the players’ individual resources (low vs. high) and the magnitude of the multiplication factor (low vs. medium vs. high vs. very high). In the high endowment trials, participants’ individual resources at the start of the game were double the amount of those in the low endowment trials. Resources that were contributed to the collective good were said to be multiplied by a multiplication factor of 1.5 (low multiplier), 2 (medium multiplier), 2.5 (high multiplier), or 3 (very high multiplier). As such, these four multiplier levels differed in terms of the profitability of donating individually owned resources to the collective, and hence the level of conflict between individual and collective outcomes. Higher multiplication factors are expected to result in more giving behavior. As shown in Table 1, across the eight trials of the Public Goods Dilemma, participants donated on average 124.87 resources (SD = 65.76, range = 0 to 240) to the collective.
2.4 Self-Reports of Real-Life Prosocial Behavior
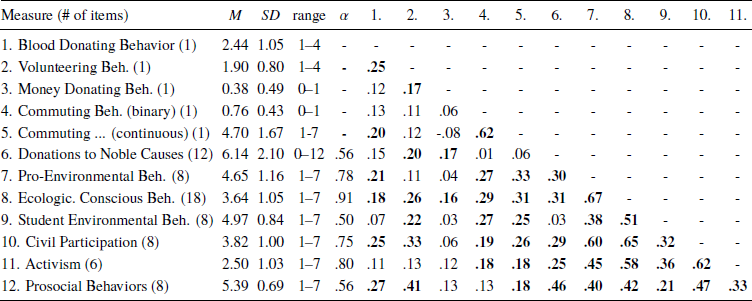
Many prior studies on the external validity of mixed-motive games included only one particular type of prosocial behavior. In order to cover a broad spectrum of everyday forms of prosocial behavior, we included a wide range of such measures in our study. First of all, we included several measures that model these real-life decisions as closely as possible. In addition to these ‘close-to-real’ measures, we also included various scale measures that probe the extent in which participants have acted in a prosocial manner in the past (i.e., self-reports of past behavior) and the extent to which they are willing to act in a prosocial manner when being confronted with various conflicting situations (i.e., self-reports of behavioral intentions). In this light, we also made a distinction between more proximal and more distal scale measures. Proximal measures are closely connected to the conflict between self and others (such as various forms of ecological behavior), while distal measures are more distantly related to this conflict (such as civil participation and activism). The means, standard deviations, Cronbach’s alphas, and correlations among these measures are included in Table 2. A full overview of these measures can be found in Appendix E.
Table 2: Descriptive statistics of and correlations (Pearson’s r) among the twelve prosocial behavior measures. Significant correlations (p < .05) are indicated in bold.
2.4.1 Close-to-Real Prosocial Behavior Measures
Blood donating behavior.
To probe whether participants are willing to donate blood, we used a measure developed by Reference De Groot and StegDe Groot and Steg (2009; Study 5). More specifically, we informed participants that the Flanders Red Cross was looking for new blood donors, and asked them if they wanted to register as a blood donor. They could indicate any of the following: (1) “No,” (2) “Maybe, I want to think about it,” (3) “I think so, please send me more information,” and (4) “Yes, please provide this foundation my name and address.” Most participants (33.7%) selected the third option, followed by the first option (25.3%), the second option (23.0%), and the fourth option (18.0%). Similar to De Groot and Steg, those who selected the third or the fourth option were asked to fill in their name and address. Participants were ensured that this information would be treated carefully.
Volunteering behavior.
In order to measure participants’ willingness to become a volunteer, we used a self-developed item that is based on the blood donation item of Reference De Groot and StegDe Groot and Steg (2009). More specifically, participants were told that the Public Centre for Social Welfare was looking for new volunteers, and asked whether they wanted to register as a volunteer. Here, we used the exact same response options as in the blood giving item. Most participants (46.1%) selected the second option, followed by the first option (33.7%), the third option (16.9%), and the fourth option (3.4%).
Money donating behavior.
To measure whether participants are willing to donate money to a charity, we told participants that the Public Centre for Social Welfare is currently also looking for financial donations. Participants were asked if they wanted to donate money to this organization (binary choice: no/yes): 38.2% of the participants did not want give any money to this charity, and the other 61.8% indicated that they want to give amounts varying between 2 and 200 euro; with the most often chosen amount being 5 euro (M = 17.81, SD = 27.81). To retain a consistent sample, we included only the dichotomous answers (and not the provided amounts) in our reported analyses.
Commuting behavior.
In addition to these ‘close-to-real’ measures, we also included a hypothetical behavioral measure. More specifically, to probe participants’ preference to commute by car or by public transport we used a hypothetical scenario that is based on the commuting scenario developed by Reference Van Vugt, Van Lange and MeertensVan Vugt, Van Lange and Meertens (1995). Respondents were asked to imagine that they were living in a suburb 40 kilometers from their work. They could cover this distance by car or by train. There was a highway near home, and a train station at a three-minute walk. In order to create a situation in which there is a conflict between concern for self and others, participants were told that commuting by train is better for the environment but that commuting by car is the quicker option. Once the commuting situation was explained, participants were asked to imagine that it is a weekday morning and that they had to make a choice between the two alternatives (car/train): 23.6% selected the car-option, the remaining 76.4% selected the train-option. Similar to Van Vugt and colleagues, participants were additionally also asked to indicate their preferences for commuting by car or by train on a response scale ranging from (1) very strong preference for car to (7) very strong preference for train.
2.4.2 Proximal Scale Measures
Donations to noble causes.
Participants’ past donations to noble causes were measured with the donation questionnaire of Reference Van Lange, Bekkers, Schuyt and VugtVan Lange and colleagues (2007). This scale consists of 12 items, which each focus on a specific donation act. This scale captures a great variety of ways in which people can make donations. For each item, participants were asked to indicate if they engaged in that particular act of donation in the past year (no/yes). A sample item is: “Did you donate in the past year money or goods through alternative means of giving (e.g., donating used clothes in clothes containers).” Similar to Van Lange et al., we counted the total number of donation acts (out of 12) that participants reported to engage in during the past year.
Ecological behaviors.
We used three scales to probe various forms of ecological behavior. The items of these three measures were all scored on seven-point Likert scales ranging from (1) strongly disagree to (7) strongly agree. To provide a first measure of ecological behavior, we employed the eight-item Pro-Environmental Behavior Scale (Reference Schultz and ZeleznySchultz & Zelezny, 1998; Reference Schultz, Zelezny and DalrympleSchultz, Zelezny & Dalrymple, 2000). A sample item is: “I look for ways to reuse things.” In addition, to measure ecological conscious consumer behavior we selected 18 items of the Ecologically Conscious Consumer Behavior (ECCB) Scale (Reference RobertsRoberts, 1996; also see Reference Tilikidou and DelistavrouTilikidou & Delistavrou, 2005). We only incorporated items that did not overlap in content with the items of the prior scale. A sample item is: “I have purchased a household appliance because it uses less electricity than other brands.” Finally, we also employed eight items of the Student Environmental Behavior Scale (SEBS; Reference Markowitz, Goldberg, Ashton and LeeMarkowitz, Goldberg, Ashton & Lee, 2012), an instrument designed specifically for use with college students (living on or off campus). Again, we selected only those items that did not overlap in content with the items of the two previous scales. A sample item is: “I use reusable shopping bags.”
2.4.3 Distal Scale Measures
Participatory behaviors.
We also measured two participatory behaviors, namely civil participation and activism, which can be seen as more distal measures of prosocial behavior. Civil participation was measured with the eight-item Civil Participation subscale and activism was measured with the six-item Activism subscale of the Participatory Behaviours Scale (PBS; Reference Talò and MannariniTalò & Mannarini, 2015). The following introductory statement preceded both scales: “The following list includes a list of behaviors characterizing civic and political engagement. Can you indicate to what extent you recognize these behaviors as your behaviors?” (1 = not at all, 7 = very much so). A sample item of the Civil Participation subscale is: “Adopting a lifestyle with a clear social orientation (e.g., vegetarianism, anti-consumerism, punk subculture, etc.).” A sample item of the Activism subscale is: “Boycotting products (for ethical or ideological reasons).”
Prosocial behaviors.
Finally, to capture the broad spectrum of prosocial behaviors in a single measure, we also employed the Prosocial Behavior subscale of the General Ecological Behavior measure (GEB; Reference Kaiser, Wolfing and FuhrerKaiser, Wölfing & Fuhrer, 1999). This scale consists of eight items, each measuring a different type of prosocial behavior. A sample item is: “If an elderly or disabled person enters a crowded bus or subway, I offer him or her my seat” (1 = strongly disagree, 7 = strongly agree).
3 Results
The data file of the present study is available at https://osf.io/gzb4j.
3.1 Internal Consistency of the Aggregated Measures
Before turning to the empirical test of our research questions, we first created aggregated measures of the game behaviors and the real-life prosocial behaviors, and we investigated the internal consistency of these aggregated measures. We created an index score for each of the three mixed-motive games by aggregating participants’ standardized scores in the eight game trials. Estimates of internal consistency showed that the three game indices were all highly reliable: The Cronbach’s alpha of the Prisoner’s Dilemma index was .80, the alpha of the Commons Dilemma index was .93, and the alpha of the Public Goods Dilemma index was .96. Because the real-life prosocial behaviors were not all measured with the same response format, it is not possible to calculate an arithmetic mean of these behaviors. Therefore, we aggregated the twelve prosocial behavior measures into one general indicator by conducted an exploratory factor analysis using Principal Axis Factoring (PAF). The composite reliability of this factor was .81. However, because the results of the factor analysis (Appendix F) revealed that the twelve prosocial behavior measures did not contribute equally to the total scale score, we additionally also estimated the omega coefficient to assess this factor’s internal consistency (Reference McNeishMcNeish, 2017). The omega of this factor was .85, which reflects a 3.6% relative increase of reliability.
3.2 Single vs. Aggregate Game Behavior in Relationship with Specific Prosocial Behavior
For each of the three mixed-motive games, we first examined how the eight individual game trials as well as the game’s index score (which reflects the aggregate of the eight game trials) correlated with each of the twelve individual prosocial behavior measures. The resulting correlation matrices can be found in Tables 3 to 5. In line with the recent guidelines of Reference Funder and OzerFunder and Ozer (2019), correlations of .05, .10, .20, and .30 are considered very small, small, moderate, and large, respectively.
Table 3: Correlations (Pearson’s r) between game behavior in the Prisoner’s Dilemma and self-reported prosocial behavior. The game index was created by aggregating the standardized scores of the eight Prisoner’s Dilemma game trials. The indicator of prosocial behavior reflects the aggregate of the twelve prosocial behavior measures. Significant correlations (p < .05) are indicated in bold.
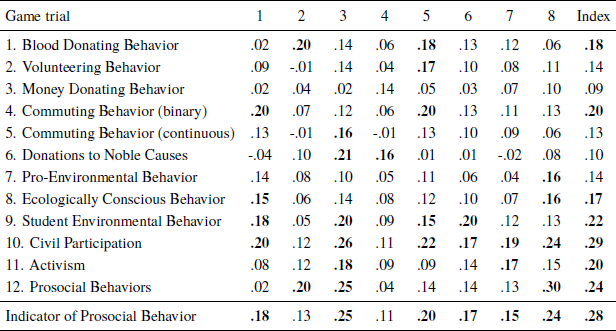
Table 4: Correlations (Pearson’s r) between game behavior in the Commons Dilemma and self-reported prosocial behavior. The game index was created by aggregating the standardized scores of the eight Commons Dilemma game trials. The indicator of prosocial behavior reflects the aggregate of the twelve prosocial behavior measures. The signs of the correlations were reversed. Significant correlations (p < .05) are indicated in bold.
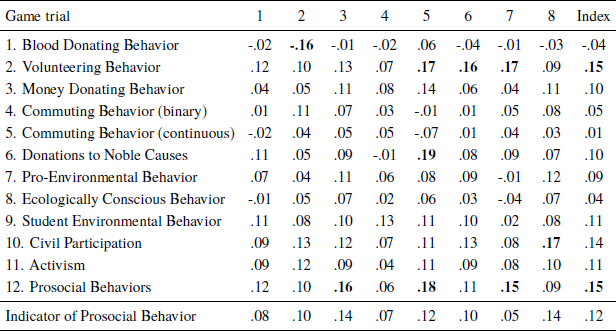
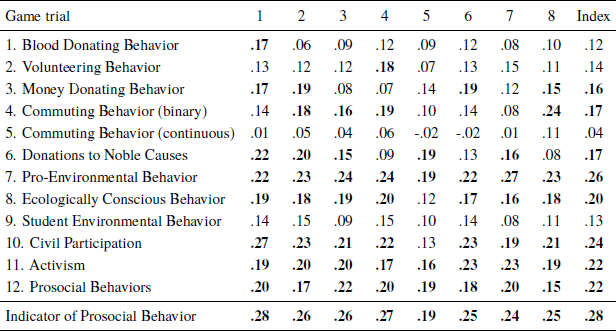
Table 5: Correlations (Pearson’s r) between game behavior in the Public Goods Dilemma and self-reported prosocial behavior. The game index was created by aggregating the standardized scores of the eight Public Goods Dilemma game trials. The indicator of prosocial behavior reflects the aggregate of the twelve prosocial behavior measures. Significant correlations (p < .05) are indicated in bold.
3.2.1 Prisoners Dilemma
As shown in Table 3, responses in the eight trials of the Prisoner’s Dilemma displayed very small to large associations with the twelve prosocial behavior measures (|.01| < r < |.30|), with only 26 out of the 96 correlations (27%) being significant at the 5% level. We subsequently calculated the average of these 96 correlations, using the psychometric software developed by Wiernik (2017). This analysis showed a small to medium average correlation (mean r = .11, 95% CI [.10, .13]). Next, we computed the correlations between the index score of the Prisoner’s Dilemma and each of the twelve prosocial behavior measures. This game index displayed very small to large associations with the twelve prosocial behavior measures (.09 < r < .29), with 7 out of the 12 correlations (58%) being significant (last column of Table 3). Here, we also calculated the average of these 12 correlations. This analysis showed a small to medium average correlation (mean r = .17, 95% CI [.14, .21]). The 95% confidence interval of the 96 separate correlations did not overlap with the confidence interval of the aggregated index score. The aggregated game score yielded a stronger relationship with the separate prosocial behavior measures than the individual game behaviors.
3.2.2 Commons Dilemma
We conducted similar correlation analyses for the Commons Dilemma. Here, the signs of the correlations were reversed, so that the game behaviors reflect cooperation (i.e., resources not taken from the common pool). Responses in the eight trials of the Commons Dilemma showed very small to medium correlations with the twelve prosocial behavior measures (|.01| < r < |.19|), with only 9 out of the 96 correlations (9%) being significant (Table 4). Based on these 96 correlations, we again calculated the average correlation. This analysis showed a very small to small average correlation (mean r = .07, 95% CI [.06, .08]). The index score of the Commons Dilemma displayed very small to medium associations with each of the twelve prosocial behavior measures (|.01| < r < |.15|). Here, only 2 out of the 12 correlations (17%) were significant (last column of Table 4). The average of these 12 correlations can also be labeled as very small to small (mean r = .08, 95% CI [.05, .12]). The 95% confidence interval of the individual game behaviors and the aggregated index measure overlap, thus suggesting that differences were small.
3.2.3 Public Goods Dilemma
As shown in Table 5, participants’ responses in the eight trials of the Public Goods Dilemma showed very small to large correlations with the twelve prosocial behavior measures (|.01| < r < |.27|). Here, 53 of the 96 correlations (55%) reached statistical significance. The average of these 96 correlations can be labelled as small to medium (mean r = .15, 95% CI [.14, .17]). Here too, we subsequently computed correlations between the index score of this game and each of the twelve prosocial behavior measures. The last column of Table 5 shows that the index score of the Public Goods Dilemma displayed very small to large associations with each of the twelve prosocial behavior measures (.04 < r < .26), with 8 out of the 12 correlations (67%) being significant. The average of these 12 correlations can be labeled as small to medium (mean r = .17, 95% CI [.14, .21]). The 95% confidence interval of the individual game behaviors and the aggregated index measure overlap, thus suggesting no substantial differences.
3.3 Single vs. Aggregate Game Behavior in Relationship with Aggregate Prosocial Behavior
We subsequently tested, for each mixed-motive game, whether game behavior measured with multiple game trials is more strongly related to the aggregate measure of prosocial behavior than game behavior measured with a single game trial. In order to proceed with these comparisons, we used the prosocial behavior indicator as the criterion variable. This indicator was extracted from the twelve prosocial behavior measures (see Appendix F for the results of this factor analysis). In other words, we now aggregated not only the game behaviors, but also the prosocial behaviors.
3.3.1 Prisoner’s Dilemma
The last row of Table 3 shows that the eight individual game trials showed small to large associations with the prosocial behavior factor (.11 < r < .25), with 6 out of the 8 correlations (75%) being significant. The average of these eight correlations can be labeled small to medium (mean r = .18, 95% [.15, .21]).Footnote 5 Table 3 furthermore reveals that the aggregated index score of this game showed a medium to large correlation with the general indicator of prosocial behavior (r = .28, p < .001). This latter correlation clearly lies outside the 95% confidence interval of the individual games scores. Next, for each of the eight individual game trials, we statistically tested if its correlation with the prosocial behavior factor significantly differed in magnitude from the correlation between the aggregated game index and the prosocial behavior factor, by calculating the difference between these two correlation coefficients using the function for dependent correlations in the cocor package of Reference Carpenter and SekiDiedenhofen and Musch (2015). The results of these analyses are included in Table 6. This table shows that four of the eight game trials (i.e., game trials 2, 4, 6, and 7) correlated significantly less strongly with the prosocial behavior factor than the game index did.
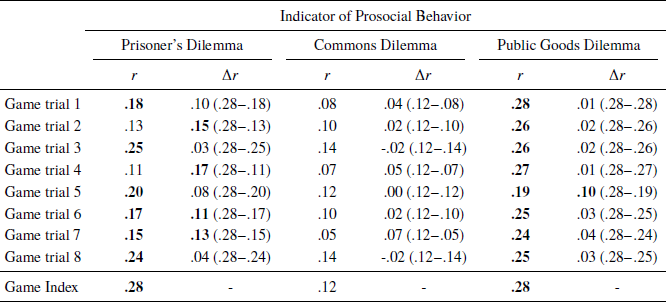
Table 6: Correlations (Pearson’s r) between the indicator of prosocial behavior on the one hand and the eight game trials and the game index on the other hand, separately for the three mixed-motive games. For each of the eight game trials, we asked whether the correlation between that trial and the indicator of prosocial behavior significantly differed in magnitude from the correlation between the game index and the indicator of prosocial behavior. The game indices were created by aggregating the standardized scores of the eight game trials. The indicator of prosocial behavior reflects the aggregate of the twelve prosocial behavior measures. For the Commons Dilemma, the signs of the correlations were reversed so that all game behaviors point in the direction of cooperation. Significant correlations and significant differences between correlations (p < .05) are indicated in bold. Minor discrepancies are due to rounding.
3.3.2 Commons Dilemma
The results presented in the last row of Table 4 show that none of the eight trials were significantly (all ps > .07) correlated with the prosocial behavior factor (05. < r < .14). The average of these eight correlations can be labeled small (mean r = .10, 95% CI [.08, .12]). As shown in Table 4, the correlation between the index score of the Commons Dilemma and the prosocial behavior factor was also non-significant (r = 12, p = .109). The latter correlation lay within the 95% confidence interval of the individual game scores. These findings illustrate that the Commons Dilemma is only weakly associated with the aggregate indicator of prosocial behavior, regardless of whether this game is measured with a single trial or with an aggregate of multiple trials. This conclusion is corroborated by the non-significant differences between the correlation coefficients of the individual game trials and the prosocial behavior factor on the one hand, and the correlation coefficient of the aggregated game index and the prosocial behavior factor on the other hand (see Table 6).
3.3.3 Public Goods Dilemma
The last row of Table 5 shows that for the Public Goods Dilemma, the eight game trials were all significantly (all ps < .02) associated with the prosocial behavior factor (.19 < r < .28). The average of these eight correlations can be labelled medium to large (mean r = .25, 90% CI [.23, .27]).Footnote 6 This game’s index score also showed a medium to large correlation with the prosocial behavior factor (r = 28, p < .001; see Table 5), which just fell outside the 95% confidence interval of the individual games scores. Table 6 illustrates that only one of the eight game trials (i.e., game trial 5) correlated significantly less strongly with the prosocial behavior factor than the aggregated game index. The seven other game trials were all about equally strongly correlated with the prosocial behavior factor. It is remarkable, however, that none of these correlations was stronger than the one between the aggregated games and the aggregated prosocial behaviors. It can be concluded that for the Public Goods Dilemma the benefits of aggregation are most evident on the side of the prosocial behaviors, and that aggregation on the side of the games only leads to small improvements in the magnitude of the correlations.
3.4 Social Value Orientation in Relationship with Specific and Aggregate Prosocial Behavior
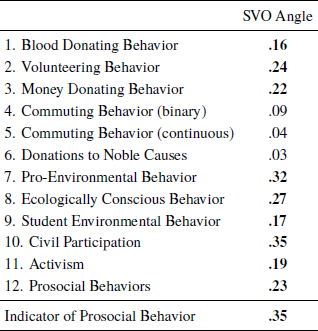
Finally, we also calculated correlations between social value orientation and participants’ self-reported real-life prosocial behavior. As shown in Table 7, participants’ SVO angle – which was constructed based on participants’ choices in six hypothetical distribution decisions – showed very small to large correlations with the twelve prosocial behavior measures (.03 < r < .35). Here, 9 of the 12 correlations (75%) reached statistical significance. The average of these 12 correlations can be labelled as medium (mean r = .20, 95% CI [.14, .27]). The last row of Table 7 shows that participants’ SVO angle was strongly associated with the prosocial behavior factor (r = .35, p < .001), which clearly fell outside the 95% confidence interval of the individual prosocial behaviors. These findings illustrate that social value orientation is also more strongly related to prosocial behavior when aggregated (instead of single) measures of prosocial behavior are used.
Table 7: Correlations (Pearson’s r) between Social Value Orientation and self-reported prosocial behavior. The SVO angle is constructed based on participants’ preferred allocations in six hypothetical games. The indicator of prosocial behavior reflects the aggregate of the twelve prosocial behavior measures. Significant correlations (p < .05) are indicated in bold.
4 Discussion
Mixed-motive games have been used extensively in many disciplines to model human behavior in a variety of social contexts. Yet, surprisingly little work has been done to systematically investigate the generalizability of these games’ relationship with prosocial behavior in more natural settings, which the games are expected to represent on a more abstract level. What is critical, however, is that most prior studies in this domain measured game behavior with only one single game trial and/or included only one specific type of prosocial behavior. We addressed this limitation by measuring game behavior with multiple trials with different payoff structures, and by also including a wide set of self-reported prosocial behaviors.
4.1 Main Findings
The present study provides evidence for the operation of the aggregation principle in the relationship between game behavior and self-reported prosocial behavior in mundane settings. In other words, our results indicate that the use of a multiple instances of game behavior and prosocial behavior is generally preferred above the use of only a single measurement.
In case of the Prisoner’s Dilemma, the mean correlation between single instances of behavior was rather modest, r = .11, but it became stronger when aggregation on the side of the games was introduced, r = .17, and it became even stronger if further aggregation on the side of the prosocial behaviors was also implemented, r = .28. Moreover, each of these (mean) correlations were located outside the 95% confidence interval of the lower aggregation level, thereby suggesting that is better to use an aggregate of multiple trials instead of only one single trial to measure the Prisoner’s Dilemma, and to also use multiple instances of prosocial behavior.
For the Public Goods Dilemma, the aggregated game index slightly outperformed the single game trials. Across the levels of aggregation, the (mean) correlations steadily increased with r = .15 at the lowest level and r = .17 after aggregation of the game behaviors, which fell in the 95% confidence interval of the lower level. However, this relationship became stronger, r = .28, after additional aggregation of the prosocial behaviors, and the latter correlation fell outside the 95% confidence level of the second round of aggregation. These findings show that for the Public Goods Dilemma the benefits of aggregation are most evident on the side of the prosocial behaviors.
However, the Commons Dilemma was only weakly correlated with prosocial behavior, regardless of whether game behavior was measured with a single or with multiple game trials and regardless of whether the prosocial behaviors were aggregated or not. These findings show that aggregation does not help when the relationship with the individual behaviors is too weak and/or inconsistent.
Moreover, our results showed that social value orientation was also rather strongly related with real-life prosocial behavior – a result that mirrors previous findings, such as those of Reference Manesi, Van Lange, Van Doesum and PolletManesi, Van Lange, Van Doesum and Pollet (2019) and Reference Van Lange, Schippers and BallietVan Lange, Schippers and Balliet (2011). A possible explanation for why social value orientation has been found to be such a strong predictor of real-life prosocial behavior may lie in the fact that social value orientation also relies on repeated measurement in (different variations of) allocation games, and thus also capitalizes on the aggregation principle. In the present study, we further ask whether social value orientation is better able to predict prosocial behavior when aggregation is applied on the measurement of prosocial behavior as well. Our results revealed that this is indeed the case: the (mean) correlation between social value orientation and prosocial behavior increased from r = .20 (when using single measurements of prosocial behavior) to r = .35 (when using the aggregated measurement of prosocial behavior).
Besides these main findings, several other interesting findings emerged. In the remainder of the discussion, we first elaborate on the inconsistent results that were obtained in prior research on the relationship between game behavior and mundane prosocial behavior. Next, we provide an explanation for why the use of multiple game trials is almost an obligation in case of the Prisoner’s Dilemma, whereas this should also be preferred for the Public Goods Dilemma. Finally, we focus on the weak relationships that were presently obtained for the Commons Dilemma.
4.2 Why Did So Many Prior Studies Fail to Obtain Significant Correlations?
Prior research on the external validity of mixed-motive games revealed rather mixed results. Specifically, some studies have reported significant correlations, whereas others have found no such correlations (see Reference Galizzi and Navarro-MartínezGalizzi & Navarro-Martinez, 2019, for an overview). When we look at the presently obtained associations between the eight individual game trials and the twelve specific prosocial behavior measures, we can similarly conclude that some correlations were statistically significant, whereas others failed to reach statistical significance. In fact, the majority of these relationships turned out to be non-significant, and this even proved to be the case with the two games that have shown the strongest relationships. Specifically, in the Prisoner’s Dilemma we found that only about 27% of the correlations between single instances of behavior were significant (73% non-significant), while in the Public Goods Dilemma approximately 55% of these correlations were significant (45% non-significant). Taken together, 59% of the single game behaviors turned out to be non-significantly related to the single prosocial behaviors. Note that these findings are reminiscent to the results of Galizzi and Navarro-Martinez, whose recent meta-analysis revealed that only 40% of the reported lab-field correlations obtained a statistically significant association between game behavior and prosocial behavior in real-life.
The fact that most prior studies on the external validity of mixed-motive games investigated these behaviors in a piecemeal fashion – by only measuring game behavior one singe time and/or by including only one instance of prosocial behavior – can help to explain the inconsistent results reported in prior research. Indeed, our findings pertaining to the two aforementioned games (Prisoner’s Dilemma and Public Goods Dilemma) revealed that after aggregation of the individual game variants, 15 out of 24 relationships were significant (63% significant, 37% non-significant). And, after aggregation of the prosocial behaviors, 14 out of 16 relationships were significant (88% significant, 22% non-significant). In other words, part of the explanation of the weak statistical relationships observed in prior research might reside in failures to aggregate – both at the side of the game behaviors as well as at the side of the real-life prosocial behaviors.
4.3 Why are Multiple Prisoner’s Dilemma Trials More Strongly Related to Prosocial Behavior?
Another notable finding of our research is that aggregation on the side of prosocial behavior was beneficial for both the Prisoner’s Dilemma and the Public Goods Dilemma, whereas aggregation on the side of game behavior had a stronger beneficial effect for the Prisoner’s Dilemma than for the Public Goods Dilemma. A possible explanation for this latter difference might reside in the way in which these two mixed-motive games were measured. Specifically, the use of only two response options in the Prisoner’s Dilemma strongly reduced the points of distinction, by either placing participants in the group of cooperators or in the group of defectors. As a result of this loss of precision, the single game trials might have missed the fine-grained differences that exist between people in their preferences for either cooperative or defective alternatives. Because of the coarseness of these options, loss of information may reduce the probability of detecting significant associations with prosocial behavior (Reference Vergauwe, Wille, Hofmans, Kaiser and FruytVergauwe, Wille, Hofmans, Kaiser & De Fruyt, 2017). Therefore, we urge researchers to always use multiple-trials – with different payoff structures — to measure the Prisoner’s Dilemma.
Conversely, in the eight Public Goods Dilemma trials, participants had to indicate on a continuous scale (that ranged from 0 to 20 in the low endowment trials and from 0 to 40 in the high endowment trials) how much of their individually owned resources they wanted to donate to the collective. It can reasonably be expected that such a continuous (more accurately, graduated) response format is better able to capture differences in cooperation and defection than a dichotomous choice format (see Reference Clark and WatsonClark & Watson, 1995; Reference CohenCohen, 1983, for detailed discussions on the (dis)advantages of dichotomous vs. continuous choice formats). Yet, because our results showed that the aggregated index of the Public Goods Dilemma still slightly outperformed the single game trials (although in a non-significant way), for this game the use of multiple game trials should also be preferred.
4.4 Why is the Commons Dilemma So Weakly Related to Prosocial Behavior?
A final noteworthy finding of our research is that the Commons Dilemma was only weakly associated with prosocial behavior, both when being measured with single and multiple game trials. In the Commons Dilemma, participants have to decide how many resources they want to harvest from a collectively owned resource pool. At the start of this game, players have no means. They can only gain resources during the game itself. Prior researchers have argued that such a gain frame might activate a strong focus on acquiring resources (see Reference Balliet, Parks and JoiremanBalliet, Parks & Joireman, 2009; Reference De Dreu and McCuskerDe Dreu & McCusker, 1997).
What is particularly interesting in this regard, however, is that participants in our sample acted very cooperatively. Cooperation rates were somewhat curbed for the Prisoner’s Dilemma and the Public Goods Dilemma, but were especially elevated in case of the Commons Dilemma. The results presented in Table 1 show that, across the eight Commons Dilemma trials, participants harvested on average only 76 resources from the group resource, thereby leaving 164 of the 240 resources (68%) in the common pool. A possibile explanation for these weak results, therefore, is that our sample was just too cooperative in this particular game. It is thus possible that in more competitive samples the Commons Dilemma would be better able to predict real-life prosocial behavior. To verify this claim, future research is needed in which cooperative samples (e.g., predominantly female, psychology students) are directly compared with more competitive samples (e.g., predominantly male, economics students).
Another explanation for the weak relationships that we obtained for the Commons Dilemma might be that many real-life examples of this game exist, and that participants easily understood the problems that taking behavior might bring. Some well-known examples of the Commons Dilemma in the modern world are overfishing, air pollution, depleting groundwater aquifers, and various other practices that are harmful to the environment. If the costs of exploitation of resources are highly internalized because such dilemmas are well-known, such behaviors might be avoided. A closer inspection of Table 1 also reveals that our manipulation of the multiplier factor had a rather small influence on the amount of resources that participants took in the different game trials (i.e., only the low multiplier condition differed significantly from the three other multiplier conditions). To acquire more insights in the predictive value of the Commons Dilemma, relative to other mixed-motive games, we encourage researchers to further investigate this particular game.
4.5 Concluding Remarks
Prior research has questioned the external validity of mixed-motive games for explaining prosocial behavior outside the lab. For instance, Reference Voors, Turley, Kontoleon, Bulte and ListVoors et al. (2012, p. 310) argued that “play in lab experiments has no predictive power for behavior in naturally occurring settings.” Along similar lines, Reference Galizzi and Navarro-MartínezGalizzi and Navarro-Martinez (2019, p. 987) recently stated that “games do a poor job explaining both the self-report measures and the field behaviors.” On the basis of the present findings, we conclude that these opinions are too pessimistic when the focus is shifted from using single measurements to aggregated measures of both game behavior and prosocial behavior. Seemingly, generalized game behavior can effectively capture generalized prosocial behavior in everyday life. We therefore recommend that future research focus on such aggregated dimensions. However, we aware that it is not always possible to measure game behavior with multiple game trials. Our results indicate that, under such circumstances, instruments that that measure outcome preferences in multiple hypothetical games (as most SVO measures do) might be an effective substitute for laboratory games.


 Open access