


1. Introduction
Classical biometrical methods have had great success in providing estimates of the amounts of genetic variation in quantitative traits in artificial and natural populations of plants and animals, as well as human populations (Falconer & Mackay, Reference Falconer and Mackay1996; Kearsey & Pooni, Reference Kearsey and Pooni1996; Lynch & Walsh, Reference Lynch and Walsh1998). These can be used to predict the outcome of programmes of artificial selection (Falconer & Mackay, Reference Falconer and Mackay1996; Lynch & Walsh, Reference Lynch and Walsh1998), and the response of natural populations to novel selection pressures (Roff, Reference Roff1997; Grant & Grant, Reference Grant and Grant2002). In addition, there is a wealth of data documenting the existence and amount of inbreeding depression (Wright, Reference Wright1977; Falconer & Mackay, Reference Falconer and Mackay1996; Lynch & Walsh, Reference Lynch and Walsh1998; Charlesworth & Charlesworth, Reference Charlesworth and Charlesworth1999), with an accumulation of recent evidence on natural populations (Keller & Waller, Reference Keller and Waller2002).
Despite this wealth of knowledge, our understanding of quantitative genetic variation is largely limited to statistical descriptions of the magnitudes of the different sources of genetic variation. Even though efforts that have been put into characterizing quantitative trait loci in human, laboratory and natural populations (Mackay, Reference Mackay2004; Valdar et al., Reference Valdar2006), there is little information on the numbers of loci that contribute to variability in traits in these populations, and almost no information on what forces maintain this variation (Barton & Keightley, Reference Barton and Keightley2002; Johnson & Barton, Reference Johnson and Barton2005). It is still unclear to what extent genetic variation in quantitative traits reflects variability maintained by the balance between mutation and selection against deleterious alleles, versus variability maintained by various forms of balancing selection (Lynch et al., Reference Lynch, Blanchard, Houle, Kibota, Schultz, Vassilieva and Willis1999; Charlesworth & Hughes, Reference Charlesworth, Hughes, Singh and Krimbas2000; Kelly, Reference Kelly2003; Johnson & Barton, Reference Johnson and Barton2005). The same applies to inbreeding depression (Wright, Reference Wright1977; Charlesworth & Charlesworth, Reference Charlesworth and Charlesworth1999).
Mutational hypotheses predict a predominance of loci with low-frequency alleles, whereas a major contribution from balancing selection implies the effects of loci with intermediate-frequency alleles. The question of their relative importance is obviously relevant to strategies for identifying quantitative trait loci (QTLs) by mapping procedures, or by screening populations for associations of trait variation with variants at candidate genes; success is likely to be greater if there is a relatively small number of loci with alleles at intermediate frequencies, compared with a large number of loci with variants at low frequencies. Currently, we have very little direct evidence concerning the frequencies of alleles at QTLs that have been identified at the molecular level. Evidence from QTL mapping and association studies may in any case be biased towards intermediate-frequency alleles with relatively large effects (Barton & Keightley, Reference Barton and Keightley2002; Johnson & Barton, Reference Johnson and Barton2005; Valdar et al., Reference Valdar2006).
There is, therefore, still scope for biometrical approaches to these questions, despite the fact that they can only provide information on the collective effects of QTLs on variability. While such information will clearly always be very incomplete, it provides important background knowledge for more detailed studies by much more expensive, marker-based techniques. There have recently been advances in methodology in this area, which provide ways of relating estimates of quantitative genetic parameters to the underlying population genetic mechanisms (Deng & Lynch, Reference Deng and Lynch1996; Charlesworth & Hughes, Reference Charlesworth, Hughes, Singh and Krimbas2000; Deng et al., Reference Deng, Gao and Li2002; Kelly, Reference Kelly1999, Reference Kelly2003).
In particular, Kelly (Reference Kelly1999) showed that the effects of a few generations of artificial selection on the outbred mean, and on the effect of inbreeding on trait mean as measured by the ‘directional dominance’ (the difference between inbred and outbred means, divided by the inbreeding coefficient, f, of the inbreds), provide an indicator of the extent to which partially recessive alleles at low frequencies contribute to genetic variability. If the ratio of the change in directional dominance to the change in mean (R) is >1, it is likely that trait variation is mostly due to rare, partially recessive alleles that reduce trait value. If we find R<1, there is likely to be a major contribution from loci with intermediate-frequency alleles.
The intuitive reason for this result is that rare, partially recessive alleles reducing trait value experience an increase in frequencies if selection is practised downwards, and a decrease with upwards selection. Increases in their frequencies cause a reduction in the means of both outbred and inbred populations, with the opposite effect for decreases in frequencies. The alleles are present in the homozygous state in the inbreds, but predominantly as heterozygotes in the outbreds, so that there is a disproportionate effect of a given change in allele frequencies on the inbred mean. For low allele frequencies, the change in inbred mean is equal to the product of the change in outbred mean and 2(1−f)+(f/h), where h is the dominance coefficient, which measures the reduction in trait mean in heterozygotes as a fraction of the reduction in homozygotes (Kelly, Reference Kelly1999). With h≪0·5, as is required for the existence of substantial inbreeding depression by this mechanism (Charlesworth & Charlesworth, Reference Charlesworth and Charlesworth1999), the change in directional dominance will be larger in magnitude, although of the same sign, as the change in outbred mean.
The method seems robust to the underlying assumptions (Kelly, Reference Kelly1999), but has been applied only once, to floral size in the monkeyflower Mimulus guttatus. This experiment yielded evidence for intermediate-frequency alleles at the underlying QTL (Kelly & Willis, Reference Kelly and Willis2001). The method is particularly useful for components of fitness, such as viability and fecundity, since these usually show inbreeding depression. This requires either partially recessive effects of alleles with deleterious effects on the trait (if variation is due solely to mutation–selection balance, or to alleles maintained at intermediate frequencies by antagonistic pleiotropy), or overdominance (Wright, Reference Wright1977; Charlesworth & Charlesworth, Reference Charlesworth and Charlesworth1999). There is therefore an a priori expectation of a predominance of non-additive allelic effects.
2. Materials and methods
(i) Rearing and scoring procedures
Flies were reared on Lewis' medium at 25±1°C. A protocol was developed for assaying the 24-hour egg lay of 3- to 3·5-day-old females, creating conditions in which more than 100 eggs could be laid by an outbred female. This involved collecting emerging flies from Monday morning to the following Tuesday morning, storing virgin females in vials until Wednesday morning, and then mating them individually with single males from our long-maintained, outbred laboratory stock, IV. This was constructed to be free of chromosomal inversions and has been maintained at a relatively large population size since 1975 (Rose & Charlesworth, Reference Rose and Charlesworth1981a; Charlesworth & Charlesworth, Reference Charlesworth and Charlesworth1985).
Mating vials were maintained for 24 hours, and mated pairs knocked over into plastic assay vials, made up with a standard quantity of Lewis medium coloured with green food colouring. These vials had been treated the previous day, by spreading a live yeast suspension in 1% acetic acid solution onto the surface of the medium. These were kept for a further 24 hours, and the flies were then discarded. Vials were kept in a coldroom at 4°C for up to 5 days before counting; the top section of each vial, down to a few millimetres above the surface of the medium, was removed with an electric soldering iron before eggs were counted under a stereomicroscope. A small fraction of outbred females failed to breed at all, and a further small fraction produced low numbers of eggs; these were omitted from the analyses of the counts (see below for details).
(ii) Selection procedures
Two replicate sets of selection lines (E1 and E2) were set up, each involving an up line (U), a down line (D) and a control (C). The base populations came from the IV stock. The selection procedure for each line involved setting up about 120 crosses in each generation, between single pairs of males and females. In the U lines, vials from crosses with the highest fecundities were chosen, and 3 single-pair matings from each (with males from different parental vials) were set up. Females with fecundities of fewer than 5 eggs were disregarded when practising selection, and estimating line means. Care was taken to ensure that males and females always had parents from different vials. A similar procedure was followed for the D lines, except that the females with the lowest fecundities were chosen. The same scheme, but with no choice of mother with respect to egg-lay, was used for the C lines.
Approximately 50% of the approximately 60 females whose egg counts were scored in each line were used for breeding. This resulted in a breeding population for each line of around 60 individuals, so that the expected inbreeding coefficient by the end of the experiment was about 16%. The U, C and D lines for E1 were managed and scored by H. B. and B. C., respectively, and both of the U, C and D lines for E2 were managed and scored by T. M.
(iii) Determination of the effects of selection
The selection experiments were carried out for 20 generations, taking just under a full year. At the end of this period, the lines were maintained for four generations without selection, using the protocol for the C lines for all of them. In each of these generations, fecundity measurements were made on outbred females, in the same way as in the selection experiment, except that a more rigorous cut-off at least 11 eggs was used for inclusion in the analyses. The reason for this more rigorous procedure was to produce a closer approximation to a continuous distribution of fecundities for the quantitative genetic analyses, and to avoid artefacts due to females dying after starting to lay eggs (many of the very low-fecundity vials had dead females in them). In addition, full-sibs were mated together to produce inbred progeny. This provided four successive blocks for simultaneously scoring the means of outbred and inbred individuals (the latter had expected inbreeding coefficient of f=0·25) for E1 and E2, from the two sets of U, C and D lines, with replication within each block (note, however, that the blocks for E1 and E2 were done in alternate weeks, so they cannot be considered to have been exposed to identical conditions).
In addition, a set of inbred lines was established by four generations of brother–sister matings from the E1 and E2 lines (expected f=0·594). Intercrosses between these lines were used to produce outbred individuals; this allowed estimation of the inbreeding effects from flies with a higher degree of inbreeding than in the first set of experiments. Once again, the E1 and E2 results were obtained at different times, approximately a month apart.
Fecundities in block 1 of the f=0·25 experiment were scored partly by B. C. and partly by H. B.; the remaining fecundities were all scored by B. C. In all cases, vials were coded so that the investigator had no knowledge of whether the progeny were inbred or outbred. All fecundity assays were carried out using females mated to males from the IV base stock. The crossing procedures were shared among all three investigators. Selection responses (DM) were calculated as the differences between selection line means and control means. In both series of experiments, the values of the inbreeding effects (I) were calculated as the differences between outbred and inbred means, divided by f (note that I is equal to minus the directional dominance in Kelly's (Reference Kelly1999) formulation), in line with conventional measures of inbreeding depression (Wright, Reference Wright1977; Charlesworth & Charlesworth, Reference Charlesworth and Charlesworth1999). For the multi-generation inbreeding coefficient, I may have been slightly underestimated by this procedure, if there was some purging of deleterious mutations affecting fecundity during the course of inbreeding (Crnokrak & Barrett, Reference Crnokrak and Barrett2002). In the experiment with four blocks, there were large block effects, so that unweighted means over blocks were used to estimate the line means. The statistical noise in the data was substantial (the coefficient of variation of the trait is around 30%), and there was a strong negative skew in the trait distribution. For this reason, bootstrapping among replicates (within blocks, where relevant) was used to assess statistical accuracy (Efron & Tibshirani, Reference Efron and Tibshirani1993).
3. Results and discussion
(i) Responses to selection
Fig. 1 shows the means and standard deviations of the selection lines for each generation for which selection was practised (the control lines were not scored). Table 1 shows the means, standard deviations and numbers of observations for the outbred and sib-mated progenies of the selection and control lines, for each of the four successive blocks of the first pair of experiments used to determine the outcome of selection (see Section 2). Large block effects are evident, reflecting the sensitivity of egg laying to environmental conditions. Table 2 shows the same statistics for the second pair of experiments, where only single blocks were used. Here, the E1 and E2 lines were subject to four generations of sib-mating, after which the fecundities of females produced by outcrosses between lines were compared with the fecundities of females produced by mating within inbred lines, as described in Section 2(iii).
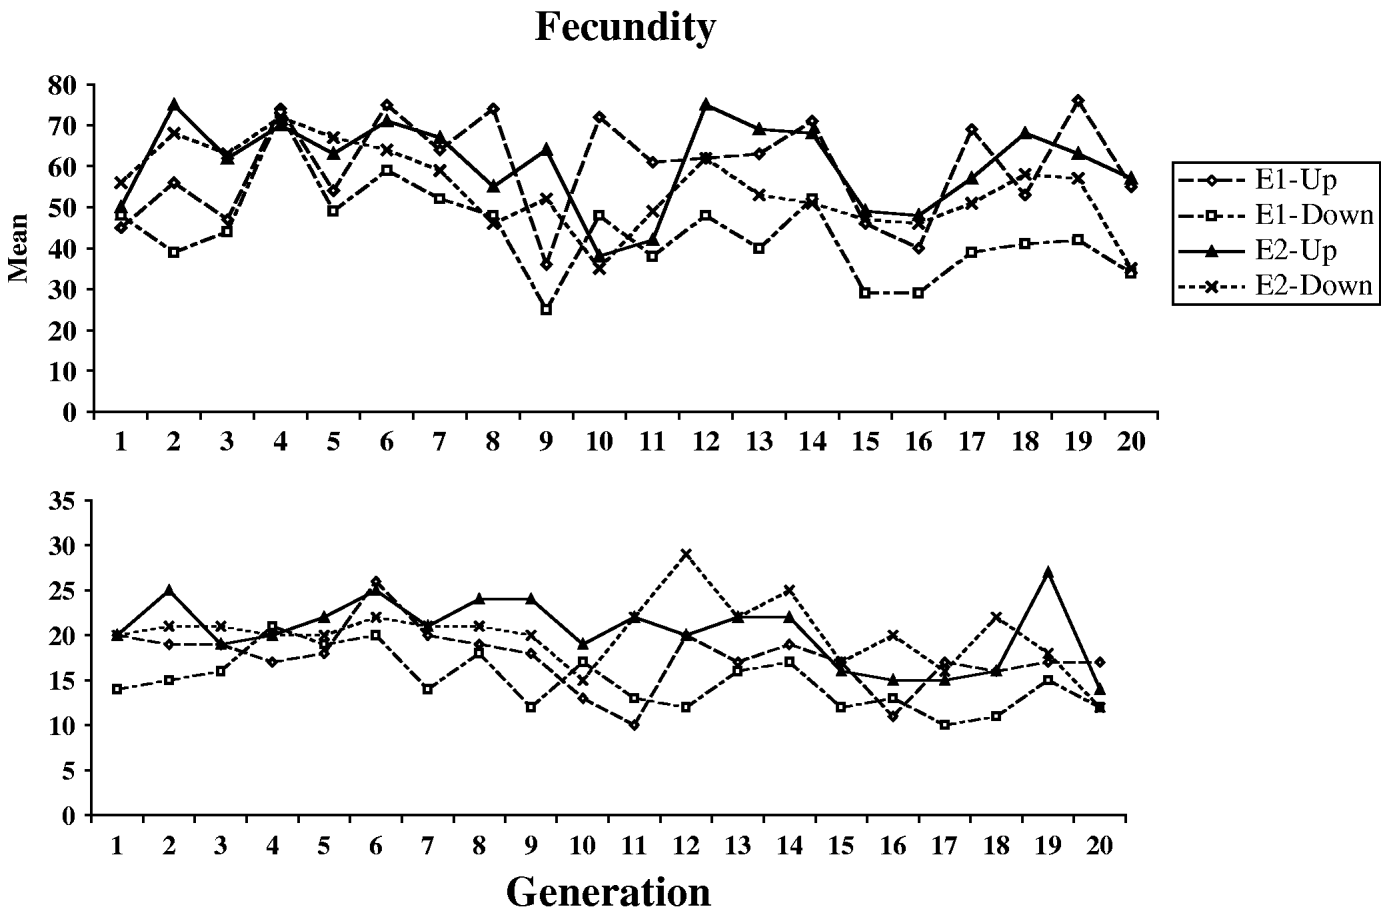
Fig. 1. The courses of change in mean (upper panel) and standard deviation (lower panel) for the four selection lines.
Table 1. Fecundity statistics for outbred and sib-mating derived females from the selection line and controls
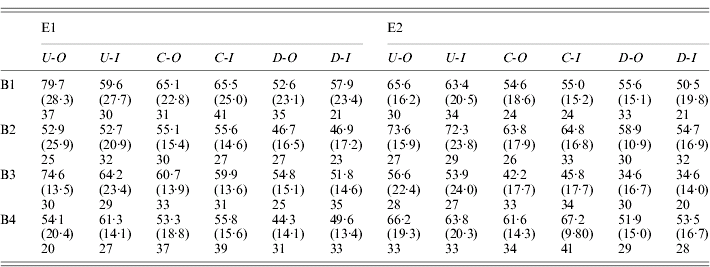
E1 and E2 are the two replicate selection experiments; B1–B4 are the four successive blocks over which measurements are taken; U, C and D indicate up-selection, control and down-selection lines, respectively; -O and -I indicate outbred and inbred matings, respectively.
The upper entries in each row are the relevant means, the quantities in parentheses are the standard deviations, and the entries below are the numbers of matings with more than 10 eggs in a vial (only these were used for scoring).
Table 2 Fecundity statistics for outbred and multi-generation sib-mated females from the selection lines and controls
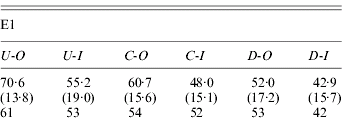
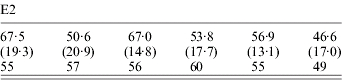
Explanation as for Table 1.
Over all experiments, the mean of the outbred control lines was 58·5 eggs per day. The variability within lines was substantial, with a mean coefficient of variation for the control lines of 29·6%. The distribution is also negatively skewed, with a mean skewness of −0·577. It is clear that selection was effective in changing the means of the populations in the direction of selection. Table 1 shows no evidence for significant asymmetry in selection response, so that the best estimate of the overall selection response, DM, is one-half of the difference between the means of the outbred U and I lines: the mean of this over all experiments was 7·48 with 95% confidence interval (6·11/8·93), based on bootstrapping of replicates within blocks. The DM estimates were fairly consistent across all four experiments (7·71, 7·62, 9·27 and 5·31, respectively).
The cumulative selection differentials for the four selection lines from the block means were as follows: 238 (E1-U), −240 (E1-D), 282 (E2-U) and −334 (E2-D). If the differences between the up and down lines for each experiments are used as joint estimates of the differentials and responses, the data in Table 1 (for the blocked measurements of line means) yield realized heritabilities of (15·42/478)=0·032 and (15·25/616)=0·025 for experiments E1 and E2, respectively, taking into account the fact that selection was practised only on females. Their mean is 0·028; using the mean phenotypic standard deviation for the control populations (17·0), this implies an additive standard deviation of 2·84, and additive coefficient of variation of 4·8%. This is considerably lower than the value of 12·5% for early fecundity estimated by Rose & Charlesworth (Reference Rose and Charlesworth1981a), perhaps reflecting a loss of genetic variability over time due to limited effective population size. There is little evidence from Fig. 1 and Tables 1 and 2 for any major differences in the standard deviations, either between the selection lines and the controls, or between inbred and outbred genotypes.
(ii) Inbreeding effects
The measure of the effect of inbreeding for a given line was the difference between outbred and inbred mean, divided by the inbreeding coefficient of the latter (Section 2.iii), denoted by I. Not surprisingly, the higher level of inbreeding associated with the experiments summarized in Table 2 showed the clearest evidence for inbreeding depression, with control I values of 21·4 (11·9/31·6) and 22·1 (11·6/32·2) for E1 and E2, respectively, whereas the experiments shown in Table 1 yielded non-significantly negative control I values of −2·64 (19·5/13·7) and −10·5 (−27·6/6·91), respectively. The experiment-wide value, obtained as the mean of I for the controls over all four experiments, is only 7·60 (0·585/14·5), probably reflecting the fact that the low inbreeding coefficient with one generation of sib-mating makes it difficult to detect inbreeding effects on a trait with a high level of non-genetic variability. The value from the multi-generation experiment is probably the most reliable estimate of the true effect of inbreeding, and suggests a reduction in fecundity for a fully inbred fly of about 40% of the outbred mean. This is consistent with data on the effects of homozygosity for the third chromosome alone (Charlesworth and Borthwick, in preparation).
(iii) Effects of selection on means and inbreeding effects
Table 3 shows the estimates of DM and changes in I (DI) for the up and down lines for each of the experiments, together with the test statistic, R=–DI/DM, described in Section 1. Overall, there is little evidence for the large, positive values of R expected if variation in fecundity were caused primarily by low-frequency, recessive or partially recessive deleterious variants (Kelly, Reference Kelly1999); only one of the eight estimates of R in Table 3 is positive. On a simple sign test, there is a probability of 0·035 of obtaining this number or more of negative deviations, on the null hypothesis of equal frequencies of positive and negative values. The DI values for the U and D lines are negatively correlated with each other, so that the true probability of this pattern on the null hypothesis is substantially lower than this.
Table 3. Selection responses and changes in inbreeding effects for all four experiments
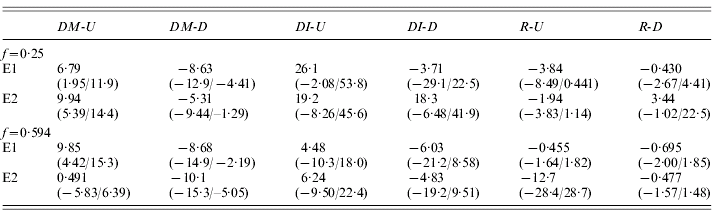
See text for detailed explanation; the quantities in parentheses are the 95% bootstrap confidence intervals for the estimates in the line above.
An experiment-wide estimate of DI is provided by the means over the experiments of half the difference between up and down values of outbred and inbred means, similar to the experiment-wide estimate of DM described above; this was 6·54 (0·88/12·3), with a lower bound to its 99% confidence interval of −0·49. The corresponding R value is −0·875 (−1·51/−0·136), with an upper bound to its 99% confidence interval of 0·075. This shows that, overall, an increase in mean fecundity is probably associated with an increase in the effect of inbreeding; at most, there can only have been a very small decrease relative to the trait mean.
(iv) Conclusions
The theoretical results of Kelly (Reference Kelly1999) suggest that R should be at least as large as 1 under a model where variation is predominantly maintained by partially recessive, deleterious mutations. A selection experiment on flower size in Mimulus guttatus gave negative R values that were significantly less than 1 for three replicate selection lines (Kelly & Willis, Reference Kelly and Willis2001). Owing to the high environmental variance of fecundity in Drosophila, our estimates of DM and DI are much noisier than those of Kelly & Willis (Reference Kelly and Willis2001). Nonetheless, the combined estimate of R is highly significantly less than 1 in our experiment.
This result suggests quite strongly that alleles at intermediate frequencies contribute substantially to genetic variance in early fecundity in the IV population. This is consistent with results from a diallel analysis of the contribution of chromosome 3 to variation in early fecundity (Charlesworth and Borthwick, in preparation), which yielded a relatively high value of the coefficient of additive variation compared with the coefficient of variation among homozygous lines, as well as evidence for significant dominance variance, contrary to expectations under the mutational model of variability (Charlesworth & Hughes, Reference Charlesworth, Hughes, Singh and Krimbas2000). The evidence for antagonistic pleiotropic effects on early fecundity from experiments where selection was practised for late-life fitness is also consistent with this conclusion (Rose & Charlesworth, Reference Rose and Charlesworth1981a, Reference Rose and Charlesworthb; Zwaan, Reference Zwaan1999). This suggests that there may be opportunities to identify at least some of the variants contributing to natural variation in this important component of fitness by techniques such as association mapping, since these are most powerful when applied to common variants. The major difficulty in doing this is the low heritability of the trait.
There may be two concerns about the robustness of this conclusion. One is that the experiments were conducted on a long-standing laboratory population, not a natural population. Given the lack of environmental heterogeneity in such a population, it might be expected that there would, if anything, be a smaller contribution to genetic variability from alleles maintained by balancing selection, so that our conclusions are likely to err on the side of overestimating the extent of contributions from mutation–selection balance.
The other caveat is that the theoretical basis for the analyses assumes no interactions between loci. The possible contributions of epistatic effects to the apparent additive genetic variance under mutation–selection balance have been discussed by Charlesworth & Hughes (Reference Charlesworth, Hughes, Singh and Krimbas2000), who concluded that they are likely to be of minor importance. Since we are using the realized response to selection, to which epistasis does not contribute after selection is relaxed (Bulmer, Reference Bulmer1985, chapter 9), there should in any case be little or no effect of epistasis on the change in outbred mean. The effects on I of synergistic or diminishing-returns epistasis among deleterious mutations were modelled by Charlesworth (Reference Charlesworth1998). His equations (2) show that the deviation caused by epistasis is proportional to the product of the coefficient measuring the strength of epistasis (β) and (1−4h 2), where h is the dominance coefficient (see Section 1). This is positive in sign with synergistic epistasis, but negative with diminishing-returns effects. There are no data on epistatic contributions to inbreeding depression in fecundity; the data on viability in Drosophila reviewed by Charlesworth (Reference Charlesworth1998) suggested that the interaction effects were positive in sign (i.e. there was some synergistic epistasis). If the same applies to fecundity, contributions from mutation–selection balance to inbreeding depression would be expected to lead to a higher value of R than predicted by the additive model, making our conclusions conservative.
We thank Helen Cowan for media preparation, and the BBSRC for financial support. B. C. is supported by the Royal Society. We also thank two anonymous referees for their comments on the manuscript.


