


For the past several decades, the study of herbicide drift has been a focal point of agriculture weed research. Mueller (Reference Mueller2015) pointed out that the number of journal articles found using the search terms “herbicide” and “drift” has more than tripled between 1991 and 2012. This is because herbicide drift onto adjacent, susceptible crops results in millions in economic losses per year for growers. While numerous researchers have investigated the off-target movement of herbicides, the vast majority have used diluted herbicide solutions at constant carrier volumes to simulate drift (Al-Khatib and Peterson Reference Al-Khatib and Peterson1999; Auch and Arnold Reference Auch and Arnold1978; Bailey and Kapusta Reference Bailey and Kapusta1993; Bond et al. Reference Bond, Griffin, Ellis, Linscome and Williams2006; Everitt and Keeling Reference Everitt and Keeling2009; Hurst Reference Hurst1982; Johnson et al. Reference Johnson, Fisher, Jordan, Edmisten, Stewart and York2012; Marple et al. Reference Marple, Al-Khatib, Peterson and Claassen2007, Reference Marple, Al-Khatib and Peterson2008; Schroeder et al. Reference Schroeder, Cole and Dexter1983; Smith and Wiese Reference Smith and Wiese1972; Snipes et al. Reference Snipes, Street and Mueller1991, Reference Snipes, Street and Mueller1992; Wall Reference Wall1994).
Banks and Schroeder (Reference Banks and Schroeder2002) were the first researchers to show that constant carrier volumes should not be used to simulate drift injury because the highly diluted herbicide concentrations did not represent real-world drift situations. They compared the effects of constant carrier volumes and variable carrier volumes and showed that using constant carrier volumes could underestimate the amount of injury observed in the crop. They explained that in order to accurately simulate drift, the carrier volume must be proportionally reduced, or variable with the herbicide rate, so the herbicide concentration of the solution remains the same for all drift applications. Banks and Schroeder (Reference Banks and Schroeder2002) observed a significant decrease in sweet corn (Zea mays L.) fresh weights and marketable ears as a result of using variable carrier volumes to represent drift instead of constant carrier volumes with the same herbicide rate. Their findings were a critical turning point in our understanding of how herbicide drift research should be conducted, and it is important that this method be used to determine the effects of herbicide drift on susceptible crop species.
The evolution of glyphosate-resistant weed species has led to the commercial development of new herbicide-resistant crop cultivars that are resistant to dicamba and 2,4-D (Dill et al. Reference Dill, CaJacob and Padgette2008). These broadleaf herbicides will be an essential tool for growers to prevent the spread of glyphosate-resistant weed species around the country (Behrens et al. Reference Behrens, Mutlu, Chakraborty, Dumitru, Jiang, LaVallee, Herman, Clemente and Weeks2007). As adoption of the new technology increases, there will be an exponential increase in cropland hectares being sprayed with dicamba and 2,4-D. Due to a substantial number of crop species being sensitive, drift of dicamba and 2,4-D will be a major concern due to their volatility and the increased potential for fine particle movement from increased applications (Behrens and Lueschen Reference Behrens and Lueschen1979; Hemphill and Montgomery Reference Hemphill and Montgomery1981; Johnson et al Reference Johnson, Fisher, Jordan, Edmisten, Stewart and York2012). Herbicide manufacturers are developing formulations to reduce volatility, but particle drift of these herbicides to off-target sites is still a possibility.
There are numerous publications that investigate the impact of dicamba and 2,4-D drift on cotton at multiple growth stages, but the vast majority of this work was done using a series of herbicide rates at a constant carrier volume for application (Egan et al. Reference Egan, Barlow and Mortensen2014). To explain, using a constant carrier volume to simulate drift means a series of diminishing herbicide rates, all diluted in the same volume of water per acre. Marple et al. (Reference Marple, Al-Khatib and Peterson2008) applied 1/400 (1.4 g ae ha−1) of the recommended rate of dicamba to cotton, but the application was made at 373 L ha−1, vastly diluting the herbicide concentration. Everitt and Keeling (Reference Everitt and Keeling2009) evaluated dicamba and 2,4-D drift on cotton, but all applications were made at 94 L ha−1. Egan et al. (Reference Egan, Barlow and Mortensen2014) developed a dose-response curve to predict yield losses from dicamba and 2,4-D drift on cotton, but the equations were constructed from a meta-analysis of previous drift research using constant carrier volumes. Considering that the qconcentration of herbicide within the spray droplet directly influences herbicide movement across the cuticular membrane (Devine et al. Reference Devine, Duke and Fedtke1993), it is possible that this previous research could be underestimating the impact of dicamba and 2,4-D drift due to the constant carrier volumes used for the convenience of application.
It should be noted that some researchers have made proportional reductions to carrier volumes when conducting drift research. However, this method is limited by complications that arise when applications are made with a tractor-mounted sprayer at relatively high speeds using low flow-rate nozzles (Ellis et all Reference Ellis, Griffin and Jones2002; Hensley et al. Reference Hensley, Webster, Blouin, Harrell and Bond2012; Ramsdale et al. Reference Ramsdale, Messersmith and Nalewaja2003; Roider et al. Reference Roider, Griffin, Harrison and Jones2008). In order to reduce carrier volume per hectare, tractor speeds are increased, which can also increase wind shear and the possibility for off-target movement of the application. Of this work, Ellis et al. (Reference Ellis, Griffin and Jones2002) published research using the lowest carrier volume–proportioned drift rates by applying glyphosate and glufosinate at 15 L ha−1. However, this rate would still represent a relatively high volume of herbicide drift. It is important to find a sprayer that will deliver controlled, consistent low volume application of droplets smaller than 200 μm to accurately simulate particle drift.
Controlled droplet applicator sprayers have certain advantages over conventional flat-fan nozzles for drift research (Clayton et al. Reference Clayton, Bals and Povey1993). The Ulva+® is a handheld, spinning-disc, controlled droplet applicator sprayer used for ultra-low volume pesticide applications. Operating at 5,300 revolutions per minute, droplet sizes from this applicator were reported between 75 and 150 μm, with an average of 113 μm (Buhler and Burnside Reference Buhler and Burnside1987; Clayton et al. Reference Clayton, Bals and Povey1993). This is critical to generate lower carrier volumes with smaller droplets and precisely simulate a real-world drift situation. Previous research has indicated that flat-fan nozzles produce droplets with an average volume 30 to 90 times greater than controlled droplet applicators (Clayton et al. Reference Clayton, Bals and Povey1993; Nuyttens et al. Reference Nuyttens, Baetens, De Schampheleire and Sonck2007). The larger droplets produced by flat-fan nozzles do not mimic drift particles and can affect leaf absorption by diluting the herbicide, potentially decreasing the injury symptoms observed in the plant (Price Reference Price1982).
With the likely increase in synthetic auxin herbicide applications to control glyphosate-resistant weeds, it is important to have a comprehensive understanding of the impact of drift onto susceptible cotton cultivars. The approach used in previous drift research suggests that plant injury could have been underestimated by applying diluted herbicide rates to simulate drift (Banks and Schroeder Reference Banks and Schroeder2002). The objective of this study was to compare cotton injury and yield development with dicamba and 2,4-D drift applications at variable and constant carrier volumes.
Material and Methods
Study Site
Field experiments were conducted in 2014 and 2015 at the University of Florida, Plant Science Research and Education Unit in Citra, FL on an Arredondo fine sand (loamy, siliceous, semiactive, hyperthermic Grossarenic Paleudult) soil consisting of 97% sand, 1% silt, and 2% clay with less than 0.5% organic matter. The trial was replicated at the Jones Farm in Tifton, GA, on a Tifton loamy sand (fine-loamy, kaolinitic, thermic Plinthic Kandiudult) consisting of 87% sand, 6% silt, and 7% clay with 1% organic matter. Cotton cultivar ‘DeltaPine 1050’ was planted April 29, 2014 and April 30, 2015 at Citra, and cultivar ‘Phytogen 499’ was planted on May 8, 2014 and May 20, 2015 at Tifton. Both cultivars were glyphosate-resistant, but sensitive to synthetic auxin herbicides. Herbicides and hand-weeding were used as needed to keep the plots weed-free throughout the growing season. Irrigation, fertility, and pest management were applied based on local management practices to ensure optimum cotton growth.
Experimental Design
The experimental design was a randomized complete block in a factorial arrangement with four replications at each site. Carrier volume, herbicide rate, and crop stage were the main factors, while location and year were considered random effects. Plots were 4 rows wide and 7.6 m long with 91-cm spacing between rows. Dicamba (Clarity® 480 g ae L−1, BASF Corporation, 26 Davis Drive, Research Triangle Park, NC) and 2,4-D (Weedar® 64, 456 g ae L−1, Nufarm Incorporated, 150 Harvester Drive, Burr Ridge, IL) drift rates were based on a consistent herbicide rate (561 g ae ha−1) and carrier volume (140 L ha−1). Glyphosate (Roundup Weathermax®, 540 g ae L−1, Monsanto Company, 800 N. Lindberg Boulevard, St. Louis, MO) at 1,262 g ae ha−1 was used for each drift application, as this will be common in herbicide management programs. Carrier volumes used in the study were either variable (proportionally reduced with herbicide rate) or constant (standard carrier volume, 140 L ha−1). For the variable carrier volumes, herbicide rates were 18.7 and 37.4 g ae ha−1 applied at 4.7 and 9.4 L ha−1 carrier volumes, respectively. Variable carrier volumes were proportionally reduced with herbicide rate so that the herbicide concentration remained the same for all applications. For cotton injury comparison, the same herbicide rates (18.7 and 37.4 gaeha−1) were applied at a constant carrier volume of 140 L ha−1. Drift applications were made at the sixth true leaf and first square growth stages.
Carrier Volume
Variable carrier volume drift applications were made using a controlled droplet applicator sprayer (Ulva+®, Micron Sprayers, Bromyard, Herefordshire, UK). Exchangeable tips with differing orifice diameters were used to alter sprayer output. Calibration of the sprayer was performed by measuring the output of water onto dry paper towels of known dimensions, which were weighed prior to and immediately after each application. The change in weight due to the application was back-calculated to volume of water per hectare. Consistency of this method was confirmed through repeated application and the use of multiple spray tips of differing sizes. Constant carrier volume drift applications were made with a CO2-pressurized backpack sprayer using a single flat-fan nozzle 11002 VS (TeeJet®, Spray Systems Co., Wheaton, IL 60139) calibrated to deliver 140 L ha−1 at 175 kPa.
Application
All drift applications were made to a single middle row in each four-row plot. This provided a 3-row buffer between plots to prevent unintended off-target movement of the application into adjacent plots, which was necessary because droplet size was reported to be less than 200 μm (Clayton et al. Reference Clayton, Bals and Povey1993). All applications were made at 5:00 AM, with strict restrictions on spraying when wind speeds were greater than 0.5 km h−1. The early application times were also chosen to prevent off-target movement of droplets caused by convective lifting from soils that were hotter than ambient air temperature at midday. After cotton symptoms developed, evaluation of the untreated buffers indicated that no off-target movement occurred from the drift applications.
Data Collection
Visual estimates of cotton injury were assessed weekly for three weeks and leaf/stem malformation was compared to the non-treated control (NTC) plots. Injury was rated on a 0 to 100 scale, with 0 indicating no injury and 100 indicating plant death. Cotton seed yield was determined by machine harvest of the single treated row in each plot. Additional data collection included the number of harvestable bolls, the node of the first harvestable boll, and the number of unopened bolls per plant. These data were determined by removing 5 consecutive plants per plot at harvest. A “harvestable boll” was defined as one that was mature, completely open, and harvestable by a mechanical reaper. These data were collected to determine if the effect of drift impacted boll initiation or maturity compared to the NTC. Herbicides were analyzed separately, while locations and years were combined. Data were subjected to ANOVA and analyzed in R Studio© (version 0.98.1028) using Fisher’s protected LSD with a P≤0.05. Results were then compared to a meta-analysis of previous drift research at constant carrier volumes constructed by Egan et al. (Reference Egan, Barlow and Mortensen2014). The meta-analysis model was designed to estimate cotton injury relative to herbicide, rate, and crop stage. By comparing our data to the predicted values of the model, it is possible to see if cotton injury has been underestimated by previous drift research.
Results and Discussion
Cotton Injury
There was no effect of year or location on cotton injury, so data were combined for analysis. Cotton injury increased for dicamba applied at variable versus constant carrier volumes at both growth stages (Table 1). At 14 d after treatment (DAT), dicamba drift applied at sixth leaf with variable carrier volumes increased foliar injury at least 23% compared to the same herbicide rates applied with constant carrier volumes. This trend continued at the first square stage, in which cotton injury from dicamba ranged from 16% to 24% for variable carrier volumes, and from 3% to 11% for constant carrier volumes. Drift applications of 2,4-D displayed a similar response to the effects of carrier volume. At 14 DAT, cotton injury increased with 2,4-D drift applied with variable carrier volumes at both growth stages and herbicide rates. For 2,4-D applied at first square, cotton injury ranged from 39% to 60% for variable carrier volumes and from 19% to 36% for constant carrier volumes. Banks and Schroeder (Reference Banks and Schroeder2002) observed a similar response as variable carrier volumes increased 2,4-D cotton injury compared to drift at constant carrier volumes. Cotton injury was highest for both herbicides in drift applications made at the sixth leaf stage. It is possible that cotton sensitivity to 2,4-D could be enhanced at the early growth stage due to reduced plant vigor and the lack of a fully developed cuticle (Wyrill and Burnside Reference Wyrill and Burnside1976). A more developed cuticle can slow the passive diffusion of 2,4-D into the leaf, delaying the rate of translocation and development of injury symptoms (Wyrill and Burnside Reference Wyrill and Burnside1976). In our results, cotton injury from dicamba drift began to decrease 21 DAT, while 2,4-D injury increased or remained the same up to 28 DAT.
Table 1 Cotton injury in response to dicamba and 2,4-D drift applications at different carrier volumes.

a Data are averaged across years (2014 and 2015) and locations (Citra, FL and Tifton, GA) with four replications (n=204). Different letters indicate a significant difference between the treatment means (Fisher’s protected LSD, P-value≤0.05).
Everitt and Keeling (Reference Everitt and Keeling2009) observed 48% cotton injury 7 DAT with 2,4-D (28 g ae ha−1) applied at the first leaf stage, but we recorded a higher injury level, 74%, with a lower 2,4-D rate (18.7 g ae ha−1) and carrier volume. The variations in cotton injury could be attributed to the different carrier volumes used in the drift treatments. Dilution of the herbicide with consistent carrier volumes could potentially underestimate the impact of the drift treatment on yield (Ellis et al. Reference Ellis, Griffin and Jones2002). For this experiment, carrier volumes were proportionally reduced with the intended herbicide drift rate. This enabled the concentration of the drift solution to remain consistent with the herbicide application rate. We believe that the variable carrier volumes used in this study displayed injury that was more indicative of a real-world drift situation compared to diluted herbicide rates at constant carrier volumes.
Cotton Height
There was no effect of year, location, or herbicide rate in cotton height reduction as percent of NTC, so data were combined for analysis. Cotton heights were reduced in all drift applications using variable carrier volumes compared to the same herbicide rates applied using constant carrier volumes (Table 2). The response of carrier volume was observed at both growth stages and all rating dates for dicamba and 2,4-D drift applications. At 21 DAT, variable carrier volumes of dicamba applied at the first square stage reduced cotton heights 8% (compared to NTC), but there was no difference in height when the same herbicide rates were applied using constant carrier volumes. Cotton was much more sensitive to 2,4-D but the effect of carrier volume was still present. Again, 21 DAT, 2,4-D drift applied at first square with variable carrier volumes decreased cotton heights by 18% (compared to NTC), while drift applied with constant carrier volumes decreased cotton heights by 2% (compared to NTC). At the three rating dates of first square application, variable rate carrier volumes of 2,4-D resulted in an average decrease in cotton heights of 17% compared to the same herbicide rates applied with constant carrier volumes. To our knowledge, there has not been any other research examining at the effect of drift carrier volume on plant height reduction, but it is clear that carrier volume plays a significant role in plant injury. This evidence further strengthens the idea that previous drift research could have underestimated the impact of synthetic auxin drift on cotton.
Table 2 Influence of simulated drift, applied at low carrier volumes (variable) and high carrier volumes (constant), on percent reduction in cotton height compared to non-treated check (NTC).
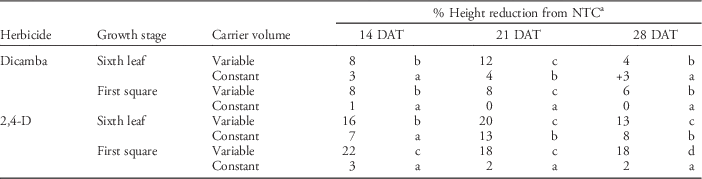
a Data are averaged across years (2014 and 2015), locations (Citra, FL and Tifton, GA), and herbicide rates (18.7 and 37.4 g ae ha−1) with four replications (n = 612). Different letters indicate a significant difference between the treatment means (Fisher’s protected LSD, P-value≤0.05).
Harvestable Bolls
There was no effect of year, location, or herbicide rate in the reduction of harvestable bolls compared to NTC, so data were combined for analysis. The number of harvestable bolls for NTC averaged 7.3 bolls per plant, and treatment data were analyzed by the reduction of bolls compared to NTC. There was no effect of carrier volume on the reduction of harvestable bolls for dicamba drift applications (Table 3). While variable carrier volumes did reduce the number of harvestable bolls, because of variation in the data the results were not significantly different than those for drift at constant carrier volumes. At the first square stage, variable carrier volumes of dicamba reduced boll production by 2.2 bolls per plant compared to a 0.7 boll decrease for constant carrier volumes. In 2,4-D drift applications, the effect of carrier volume on the reduction of harvestable bolls was significant. Variable–carrier volume 2,4-D drift applied at first square reduced boll production by 5.1 bolls per plant compared to a 3.3 boll reduction for 2,4-D drift applied with constant carrier volume. A significant effect of growth stage was present for 2,4-D drift applications. 2,4-D applied at first square resulted in a significant reduction of harvestable bolls compared to the same rates applied at sixth leaf. This significant effect of growth stage at application has been observed in previous drift research. Snipes et al. (Reference Snipes, Street and Mueller1992) and Jacoby et al. (Reference Jacoby, Meadors and Clark1990) recorded significant reductions in cotton yield when synthetic auxin drift was applied at pinhead-square or pre-bloom growth stages. It is probable that the yield reductions observed due to squares having been aborted as a response to drift application at flowering, which caused a reduction of productive bolls at harvest.
Table 3 Influence of simulated drift, applied at low carrier volumes (variable) and high carrier volumes (constant), on number of mature, harvestable bolls per plant at harvest compared to average of non-treated check (NTC).

a Data are averaged across years (2014 and 2015), locations (Citra, FL and Tifton, GA), and herbicide rates (18.7 and 37.4 g ae ha−1) with four replications (n=1,020). Different letters indicate a significant difference between treatment means (Fisher’s protected LSD, P-value≤0.05).
First Fruiting Node
To establish if drift delayed boll production, cotton nodes were counted to identify the first productive fruiting node, and this would indicate the position of the first harvestable boll. It was determined that the effects of year, location, and herbicide rate were not significant for the position of the first fruiting node compared to NTC. There was no significant effect of carrier volume on dicamba or 2,4-D drift applied at the sixth leaf growth stage, but a significant effect was present for both herbicides at first square. Cotton boll production was significantly delayed by 1.3 nodes (compared to NTC) for variable carrier volume dicamba applications made at first square, compared to a 0.7 node delay for constant carrier volumes (Table 4). Similar results were observed with 2,4-D, as variable carrier volume delayed boll production 4.3 nodes compared to a 1.7 node delay for constant carrier volume. This effect of growth stage is likely due to the physiological mechanisms of the cotton plant associated with flowering. Previous research has shown that drift applications made during square formation result in yield reductions at harvest (Everitt and Keeling Reference Everitt and Keeling2009; Jacoby et al. Reference Jacoby, Meadors and Clark1990; Snipes et al. Reference Snipes, Street and Mueller1991; Snipes et al. Reference Snipes, Street and Mueller1992). As a stress response, cotton will abort flowering structures, resulting in boll production occurring at nodes further up the plant (Guinn Reference Guinn1982).
Table 4 Influence of simulated drift, applied at low carrier volumes (variable) and high carrier volumes (constant), on cotton node position of the first harvestable boll compared to non-treated check (NTC).

a Data are averaged across years (2014 and 2015), locations (Citra, FL and Tifton, GA), and herbicide rates (18.7 and 37.4 g ae ha−1) with four replications (n=1,020). Different letters indicate a significant difference between treatment means (Fisher’s protected LSD, P-value≤0.05).
Cotton Yield
There was no effect of year, location, or herbicide rate when cotton seed yield data were analyzed as a percent of NTC yield. However, there was a significant effect of herbicide, growth stage, and carrier volume, so data are presented accordingly. For both herbicides, simulated drift applied with variable carrier volumes resulted in a significant reduction in cotton yield compared tothe same herbicide rate applied with constant carrier volumes (Table 5). With dicamba, the effect was observed at both growth stages: variable carrier volumes decreased cotton yields by 17% and 22% more at sixth leaf and first square, respectively, compared to dicamba applied at constant carrier volumes. Hamilton and Arle (Reference Hamilton and Arle1979) observed a 13% yield reduction when dicamba (32 g ha−1) was applied to squaring cotton, compared to the 41% yield reduction we found at similar rates (18.7 to 37.4 g ae ha−1) and growth stage. Again, this large difference in cotton response may be the result of Hamilton and Arle (Reference Hamilton and Arle1979) diluting the herbicide to 374 Lha−1 while the current study diluted to 4.7 to 9.4 L ha−1.
Table 5 Influence of simulated drift, applied at low carrier volumes (variable) and high carrier volumes (constant), on cotton yield as percent of non-treated check (NTC).Footnote a

a Data are averaged across years (2014 and 2015), locations (Citra, FL and Tifton, GA), and herbicide rates (18.7 and 37.4 g ae ha−1) with four replications (n=204). Different letters indicate a significant difference between treatment means (Fisher’s protected LSD, P-value≤0.05).
Compared to dicamba, 2,4-D drift resulted in lower cotton yield in all applications. This outcome is similar to previous literature that also investigated drift of synthetic auxin herbicides on cotton (Everitt and Keeling Reference Everitt and Keeling2009; Marple et al. Reference Marple, Al-Khatib, Peterson and Claassen2007, Reference Marple, Al-Khatib and Peterson2008). A significant effect of carrier volume was present for 2,4-D drift applied at the sixth leaf stage, but not at first square. When applied at sixth leaf, the variable carrier volume application resulted in a cotton yield of 19% of NTC, while the constant volume application provided a cotton yield of 32% of NTC. Cotton yields were lowest in 2,4-D drift applied at first square; it is likely that the high sensitivity of cotton to the herbicide at this stage masked any significant effect of carrier volume. Previous research has shown that cotton is most sensitive to 2,4-D damage at the initiation of flowering (Everitt and Keeling Reference Everitt and Keeling2009; Smith and Wiese Reference Smith and Wiese1972). Everitt and Keeling (Reference Everitt and Keeling2009) observed much higher cotton yields in 2,4-D applied at similar rates and growth stages. In the current study, 2,4-D (18.7 to 37.4 g ae ha−1) applied with variable carrier volumes at sixth leaf and first square stages resulted in 19% and 3% the yield of NTC, respectively. Everitt and Keeling (Reference Everitt and Keeling2009) applied 2,4-D (28 g ae ha−1) drift to cotton and recovered 56% and 31% of NTC yields at similar growth stages. The distinct differences in yield between the studies can conceivably be attributed to many factors, including rainfall, fertility, and other environmental factors. However, the yield differences between the current study and those reported by Everitt and Keeling (Reference Everitt and Keeling2009) are so vast that we believe the effect of carrier volumes must be considered. Our experiment used variable carrier volumes of 4.7 and 9.4 L ha−1, while Everitt and Keeling (Reference Everitt and Keeling2009) used 94 L ha−1. This 10-fold reduction in carrier volume (or increase of herbicide concentration) would dramatically increase the diffusion dynamics of the herbicide across the cuticle, resulting in more herbicide loading in the leaf and therefore a greater herbicidal effect.
In order to explore the relationship between carrier volume and cotton yield, we decided to compare our data with a meta-analysis model constructed from previous drift literature. Egan et al. (Reference Egan, Barlow and Mortensen2014) developed a dose-response curve for predicting cotton yield losses based on data collected from 21 previous dicamba and 2,4-D drift studies that used constant carrier volumes. Accounting for herbicide rate and growth stage, the dose-response curve provides an estimate of yield reductions from drift treatment as a percentage of NTC. Again, it should be noted that all of the studies in the meta-analysis dataset used constant carrier volumes ranging from 90 to 370 L ha−1 to apply the drift, while this study used carrier volumes of 4 to 9 L ha−1. By entering our herbicide rates into the model, we could compare the expected yield losses at constant carrier volumes to the actual yield data collected using proportionally reduced (variable) carrier volumes. In our study, yield data was averaged across all drift rates at each growth stage, and this procedure was also applied to the model analysis.
In our study, at variable carrier volumes, dicamba drift reduced cotton yields to 70% and 59% of NTC at the vegetative (sixth leaf) and squaring growth stages, respectively, compared to 75% and 71% predicted by the meta-analysis model. It is possible that the tolerance of cotton to dicamba could decease the impact of variable carrier volumes on cotton yield reductions. While the observed and predicted data were similar, there was still a 12% difference in yield for dicamba applied at the squaring stage. This suggests that variable carrier volumes can increase the impact of dicamba drift on boll formation and yield at later growth stages. Using variable carrier volumes, 2,4-D applied at the vegetative and squaring stages reduced cotton yields to 19% and 3% of NTC, respectively, compared to 53% and 46% predicted by the model. It is likely that the sensitivity of cotton to 2,4-D may explain the yield differences observed. It is possible that previous drift research has been underestimating the impact of 2,4-D drift on cotton, although, this may not be the case for dicamba.


