


Introduction
The islands of Japan are home to diverse fauna and flora and are designated as a biodiversity hotspot (Conservation International, 2005). One of the most important areas lies between the Tokara and Kerama Straits (Fig. 1), where the largest number of threatened endemic species of vertebrates occur (Ito et al., Reference Ito, Miyagi and Ota2000; Sugimura et al., Reference Sugimura, Yamada and Miyamoto2003). In 2006, in an effort to have the Amami and Okinawa Islands recognized as Natural World Heritage Sites, the Japanese Ministry of the Environment started a project to control the introduced small Indian mongoose Herpestes auropunctatus and to monitor the abundance of three of the most threatened species on these islands: the Amami rabbit Pentalagus furnessi, the Amami woodcock Scolopax mira and the Amami thrush Zoothera dauma amami (Japanese Ministry of the Environment, unpubl. data).
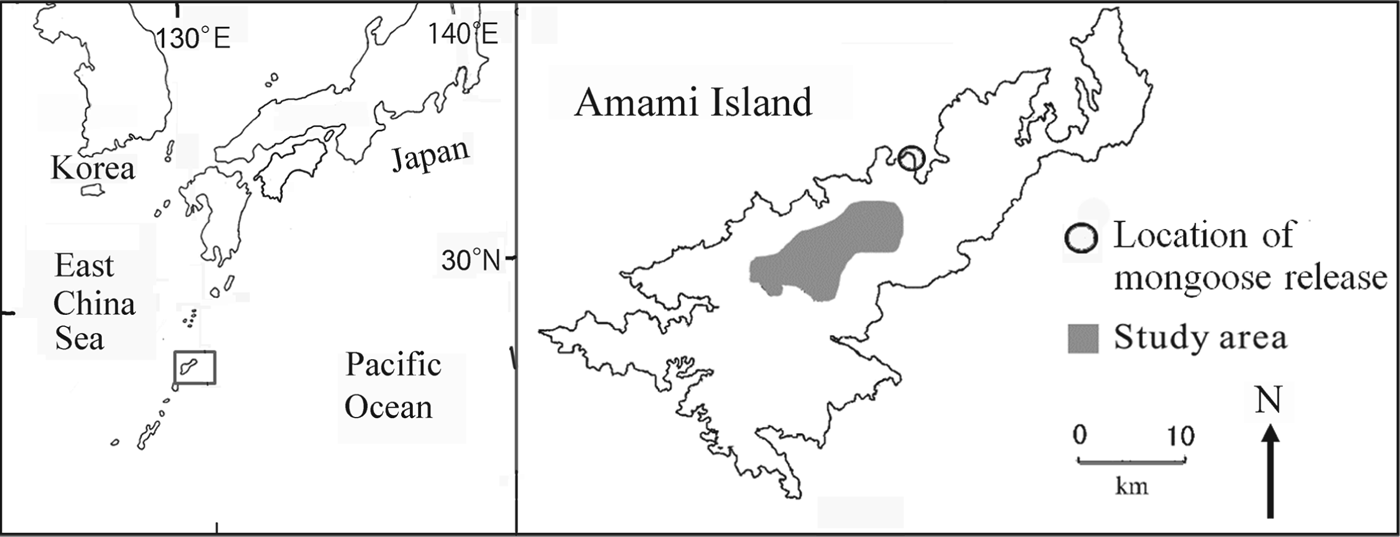
Fig. 1 The study area on Amami Island, Japan. The rectangle on the inset shows the location of Amami Island in the Pacific Ocean.
To investigate the effects of the mongoose invasion and forestry practices on native species, and to examine conservation needs, we investigated the performance of the Living Planet Index in comparison with a species-by-species approach for tracking population changes. The Living Planet Index assesses the rate of change in each population of a species and then averages the rates for that species over time (Loh et al., Reference Loh, Green, Ricketts, Lamoreux, Jenkins, Kapos and Randers2005; Collen et al., Reference Collen, Loh, Whitmee, McRae, Amin and Baillie2008). It is particularly useful where abundance has been measured in different ways for different species (e.g. frequency of observation, trapping, field signs). The species-by-species approach has been used to inspect species individually and identify similar patterns among species (Condit et al., Reference Condit, Hubbell and Foster1996; Lichstein et al., Reference Lichstein, Simons and Franzreb2002; Møller & Mousseau, Reference Møller and Mousseau2007; Pillay et al., Reference Pillay, Johnsingh, Raghunath and Madhusudan2011).
To apply the Living Planet Index, species are usually grouped according to a biological perspective such as taxonomy, guild or habitat type (Buckland et al., Reference Buckland, Magurran, Green and Fewster2005; De Heer et al., Reference De Heer, Kapos and ten Brink2005; Mineau et al., Reference Mineau, Downes, Kirk, Bayne and Csizy2005; Scholes & Biggs, Reference Scholes and Biggs2005; Collen et al., Reference Collen, Loh, Whitmee, McRae, Amin and Baillie2008; Yamaura et al., Reference Yamaura, Amano, Koizumi, Mitsuda, Taki and Okabe2009). However, groups may contain species that differ in terms of conservation value; e.g. threatened species, pollinators and insect pest controllers. Furthermore, groups may contain species that are vulnerable to a certain habitat change and those that are not. We grouped species according to conservation value (e.g. rare species) and factors that affect population abundance. This approach may have greater local relevance and be more useful than approaches that group species by taxonomy or ecological guild (Obrist & Duelli, Reference Obrist and Duelli2010).
Specifically, we (1) investigated changes in abundance of each species, and any implications, (2) examined how the Living Planet Index performs when species are grouped as indigenous, rare and insectivorous species, and species that are negatively affected by forest clear-cutting and mongoose invasion, and (3) discuss what conservation policies should be implemented based on these two techniques.
Study area
Amami Island (719 km2) is the seventh largest island in Japan (Fig. 1) and 85% of its land area is forested. The Island is home to a large number of endemic species as a result of its separation from mainland Japan and Taiwan 10–1.5 million years ago, long before the other islands of Japan were separated from the continent (Otsuka & Takahashi, Reference Otsuka and Takahashi2000; Sugimura et al., Reference Sugimura, Yamada and Miyamoto2003).
Changes in forest cover and introduced predators are the major threats to species endemic to the island. The Island was once dominated by mature broad-leafed evergreen forests, in particular Castanopsis sieboldii and Schima wallichii, and all endemic species of fauna were dependent on these forests. Prior to 1945 the forests were selectively cut, with only the largest trees removed. With the introduction of subsidies in 1954 the national government encouraged forest clear-cutting. Annual timber production on Amami Island peaked at 251,000 m3 in 1963 and at 284,000 m3 in 1972 (Kagoshima-ken, 1964, 1973; Sugimura, Reference Sugimura1988), after which it declined abruptly, falling to 5,000 m3 in 2000 (Kagoshima-ken, 2001). The endemic fauna was also negatively affected by the introduction of the small Indian mongoose in 1979 to control the venomous snake Protobothrops flavoviridis. The mongoose preyed on other species (Abe et al., Reference Abe, Handa, Abe, Takatsuki, Nigi, Rodda, Sawai, Chiszar and Tanaka1999; Watari et al., Reference Watari, Takatsuki and Miyashita2008) and its population grew and spread rapidly during the 1990s (Yamada & Sugimura, Reference Sugimura and Yamada2004). The study area is central Amami Island (Fig. 1), where wildlife populations were monitored during 1985–2010.
Methods
Monitoring species abundance
We selected the five mammal and 20 bird species for which sufficient data were available for analysis of trends in abundance (Table 1). Five mammal and five bird species that live mainly in forests (Sugimura et al., Reference Sugimura, Yamada and Miyamoto2003; Japan Wildlife Research Center, 2008; Amami Ornithologists’ Club, 2009) were not included in this study because there were not sufficient data for analysis, even though eight of these are listed on the IUCN Red List (Biodiversity Center of Japan, 2007); five of them are cavity nesters, which would be negatively affected by forest clear-cutting (Sugimura, Reference Sugimura1987; Sugimura et al., Reference Sugimura, Yamada and Miyamoto2003; Japan Wildlife Research Center, 2008) and two of them are likely to be at risk of predation by the small Indian Mongoose (Japanese Ministry of the Environment, unpubl. data). All the species are native to Amami Island except the small Indian mongoose and the black rat Rattus rattus.
Table 1 Species monitored and survey efforts in each monitoring period. The four points in time used to examine population trends are shaded. Sources: Sugimura (Reference Sugimura1987), Abe et al. (Reference Abe, Takatsuki, Handa and Nigi1991), Japan Wildlife Research Center (1995), Sugimura (Reference Sugimura2002), Ishida (Reference Ishida, Takashi, Saito and Usami2003a), Amami Ornithologists’ Club (2011), K. Ishida (unpubl. data), Japanese Ministry of the Environment (unpubl. data)

1 (p), number of points; (d), distance in km; (t), number of traps set; (td), number of trap-days or trap-nights; (h), number of hunters and trappers responsible for reporting to the local government when they caught a boar
2 Conducted in January and February as well as December of the previous year
3 Conducted in 1992
4 Sum of the distance surveyed for two years
As we focused on long-term changes and did not monitor species abundance every year, we selected points in time for comparing changes in the abundance, based on the periods of the bird surveys, which began in 1985 (Sugimura, Reference Sugimura1988; Table 1). All but two of the 20 selected bird species were recorded using the sample count method (Bond, Reference Bond1957) at stations along forest roads. The same species were surveyed at the same locations at 8-year intervals until February 2010. The area of each location depended on topography and species as well as song and call; we aimed to record each bird once only. One of the bird species, Z. dauma amami, has only been surveyed since 1990 (Table 1), and therefore we estimated the abundance of this species in 1985 based on Sugimura (Reference Sugimura1995), in which the species abundance was assumed to be positively correlated with the area of mature forest. The woodcock S. mira is nocturnal and the number observed along roads was recorded in 1985 by Sugimura (Reference Sugimura1987) and later by the Amami Ornithologists’ Club (Ishida et al., Reference Ishida, Takashi, Saito and Usami2003a; K. Ishida, unpubl. data). We assumed that the change in woodcock abundance was small from 1992 to 1993 and used the counts conducted in 1992 for the estimates of 1993–1994, as there had not been a large difference between 1985 and 1992.
The droppings of the rabbit P. furnessi were counted along streams and forest roads across the whole study area (Sugimura et al., Reference Sugimura, Sato, Yamada, Abe, Handa and Hirakawa2000; Sugimura & Yamada, Reference Sugimura and Yamada2004; Japanese Ministry of the Environment, unpubl. data). All the droppings were counted once except during 1985–1986, when all the droppings were removed and counts were conducted three or four times at 3-day intervals. Estimates for 1985–1986 were made using a regression analysis between the number of droppings counted every 3 days and the total number of pellets found along a census route (Sugimura & Yamada, Reference Sugimura and Yamada2004).
Pigs Sus scrofa have been hunted for both recreation and meat, and recently for pest control. Every year, hunters report the number of pigs killed to the municipal authorities, and we used the reported number as the measurement of abundance for the study area. Only approximate estimates of abundance were obtained for the spiny rat Tokudaia osimensis, black rat and small Indian mongoose because of a lack of quantitative surveys during the study years, and differences in trap types.
Estimates of the abundance of the two species of rats were based on the number of individuals caught in cage traps designed for R. rattus in 2004 (Table 1). For 2009–2010 the abundance of the spiny rat was estimated from the frequency of catch in larger cages set for the small Indian mongoose and the difference in trapping efficiency between the two types of traps (i.e. for R. rattus and the mongoose) in a survey conducted in 2004. T. osimensis was released after the catch and R. rattus was removed. Estimates of abundance for the earlier time points were based on data from Sugimura (Reference Sugimura1987) and the Japan Wildlife Research Center (1995).
Following the introduction of the small Indian mongoose in 1979 (see Fig. 1 for the location of the release) its abundance and distribution expanded rapidly (Abe et al., Reference Abe, Takatsuki, Handa and Nigi1991) and continued to expand during 1993–2002 (Ishii, Reference Ishii2003). Abundance for 1985–1986 was estimated using the data of Abe et al. (Reference Abe, Takatsuki, Handa and Nigi1991). We assumed an exponential increase until 1990 and a constant increase in the capture rate during 1990–2002 (Ishii, Reference Ishii2003).
Aggregating species for tracking population trends
Mammal and bird species are often considered separately when calculating the Living Planet Index but rather than disaggregating them we grouped species according to their perceived conservation value (Sugimura, Reference Sugimura1987; Table 1): rare species (R) that are listed in the Japanese Red Data Book and/or are endemic to Amami Island and insectivorous birds (I). Insectivorous birds were grouped because they are vulnerable to habitat changes and play an important role in pest control (Dickson et al., Reference Dickson, Connor, Fleet, Jackson and Kroll1979; Thiollay, Reference Thiollay1997; Sipura, Reference Sipura1999; Sekercioglu, Reference Sekercioglu2006; Table 1). We labelled species adversely affected by forest clear-cutting (F) and mongoose predation (M), based on data in Sugimura (Reference Sugimura1987) and Ishida et al. (Reference Ishida, Miyashita and Yamada2003b). We examined whether the abundance of F species changed after the forests recovered from clear-cutting, and how the abundance of M species was affected by the mongoose. Some species were in more than one group, which allowed us to compare how the Living Planet Index performed when a species was included in a group and when it was not.
The wildlife on Amami Island has been monitored by researchers from various disciplines, employing a variety of methods (e.g. Sugimura, Reference Sugimura2002; Ishida, Reference Ishida, Takashi, Saito and Usami2003a; Watari et al., Reference Watari, Takatsuki and Miyashita2008). This makes it difficult to compare population numbers between species. We therefore estimated the rates of population change and calculated the Living Planet Index according to Loh et al. (Reference Loh, Green, Ricketts, Lamoreux, Jenkins, Kapos and Randers2005) to compare the following groups: (1) indigenous species, (2) groups R and I, and (3) groups F and M.
The rate of population change, d t , was calculated as
 $$d_t = \log (N_t /N_{t - 8} )$$
where N is the population index at four time points 8 years apart. We assumed that changes between each 8-year period were greater than the range of variation during each period. When N was zero at any time point, i.e. 1985–1986, 1993–1994, 2001–2002 or 2009–2010, the mean of N was calculated (Table 2), and 1% of this mean was added to every N according to the method employed by Loh et al. (Reference Loh, Green, Ricketts, Lamoreux, Jenkins, Kapos and Randers2005). Then, given d it for the value of d t for species i for all n t species in a group, we calculated
 $$\overline {d}_t = \displaystyle{1 \over {n_t}} \sum\limits_{i = 1}^{n_t} {d_{it}} $$
Table 2 Abundance changes for each species from 1985–1986 to 2009–2010, the groups to which the species belong, the pattern of change, and the abundance measurement used. The values for 1985–1986 (in parentheses) are derived from various surveys. Values for the other time points are relative to the 1985–1986 levels, and negative values indicate a decrease in abundance from the previous period. Shaded cells indicate that abundance decreased from the previous time point.
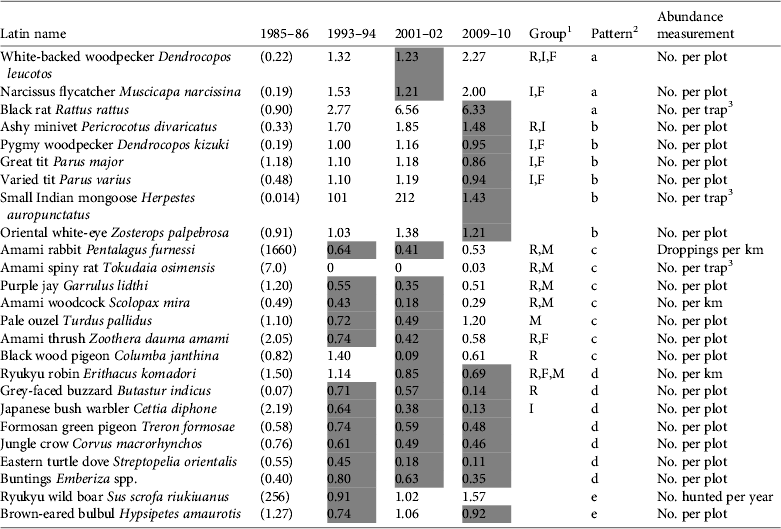
1 R, species categorized as Rare in the Japanese Red Data Book (Biodiversity Center of Japan, 2007) and/or endemic to the Amami Islands; M, species likely to be at risk of predation by the small Indian mongoose; F, species negatively affected by forest clear-cutting (Sugimura, Reference Sugimura1987; Sugimura, Reference Sugimura2002); I, insectivorous birds (determined according to the description of food habits in Kiyosu, Reference Kiyosu1978, and Nakamura & Nakamura, Reference Nakamura and Nakamura1995)
2 a, Abundance increased from the first to the last period by more than 100%; b, abundance increased in all periods except for 2009–2010; c, abundance decreased to < 50% from 1985–1986 to 2001–2002 but increased in 2009–2010; d, abundance decreased in all census periods, except for the robin in 1993–1994; e, no obvious pattern
3 Indicates the number of individuals captured per 100 trap-nights
The Living Planet Index in a standard year t was then calculated, setting I 1985–1986 to 1, as
 $$I_t = I_{t - 8} 10^{\overline {d}_t} $$
Confidence intervals for I t were calculated using a bootstrap method (Loh et al., Reference Loh, Green, Ricketts, Lamoreux, Jenkins, Kapos and Randers2005) in which a sample of n t species-specific values of d t was selected at random, with the procedure repeated 1,000 times. To calculate the confidence intervals N t–8 in [1] was replaced with N t–16 for 2001–2002 and with N t–24 for 2009–2010.
Results
Abundance of species
Changes in the pattern of abundance of each species are shown in Table 2. We used the same technique throughout the four time points for each species but the estimation processes were more complicated for the two species of rats. In 2004 the rat traps caught a mean of 0.741 T. osimensis individuals every 100 trap-nights and the mongoose traps caught a mean of 0.0768 T. osimensis. Therefore, we used 9.65 (= 0.741/0.0768) as a correction factor and multiplied it by the number of T. osimensis caught in mongoose traps in 2010. They were caught 16 times in total but the range was limited to the western part of the study area and the population level was lower than that of 1985–1986 (Table 2).
The number of R. rattus that we caught per 100 trap-nights increased from 0.90 in 1985–1986 to 1.85 in 2003, 9.88 in 2004 and 5.72 in 2008. In 1994 mongoose traps were employed (Japan Wildlife Research Center, 1995) and therefore we used the same correction factor as above for the abundance value in 1993–1994 (Table 2). R. rattus distribution was limited to the northernmost part of the study area in 1985–1986 but had expanded to near the western border of the area by 2004. The records suggest that the population had not only expanded its distribution area but also increased in density. We therefore assumed that the population had increased exponentially between 1985–1986 and 1993–1994, with the growth rate determined by the average catch frequency in 2003 and 2004, and that the increase had halted by 2004 (Table 2).
Using the species-by-species approach, i.e. inspecting species individually, we identified four main patterns of abundance change: (a) an increase of > 100% from the first to the last census period, (b) an increase in all periods except 2009–2010, when abundance decreased, (c) a decrease to < 50% from 1985–1986 to 2001–2002 but an increase in 2009–2010, and (d) a decrease in all census periods. Changes in the abundance of the Ryukyu wild boar Sus scrofa riukiuanus and brown-eared bulbul Hypsipetes amaurotis did not fit any of these general patterns. The species with pattern d are supposed to be the most critical in terms of decreasing trends. However, some species in this group, e.g. the Ryukyu robin Erithacus komadori, were observed more frequently than many other species (Table 2). Therefore attention should also be paid to any sharp rate of decline such as that of the Amami spiny rat from 1985–1986 to 1983–1984 or the Amami woodcock from 1985–1986 to 2001–2002.
We observed certain relationships between the patterns a to d and the groups aggregated in terms of conservation value or vulnerability to habitat change. Rare species (R) generally declined (pattern c or d) and insectivorous birds (I) increased (a or b; Table 2). Most species adversely affected by forest-clearing (F) increased (a or b), and every species adversely affected by mongoose (M) declined (c or d). Thus, most of the species within the same group (R, I, F or M) exhibited a similar pattern of increase or decrease but the annual variations between species make it difficult to evaluate the magnitude of changes for each group.
Patterns in Living Planet Index
The Living Planet Index for Amami's indigenous species changed at four time points from 1985–1986 to 2009–2010 (Fig. 2). It fell by 47% from 1985–1986 to 2001–2002 and recovered by 16% of its 2001–2002 value by 2009–2010, based on a mean value estimated by bootstrapping. Although the trends are not as marked, this pattern is similar to that for rare species, which showed 71% decline and 57% recovery (Fig. 3a), and species affected by the mongoose, which showed 81% decline and 95% recovery (Fig. 4b). More than half of the rare species followed pattern c, and the Living Planet Index indicates the degree of decline and the subsequent recovery of the whole group. By contrast, the Living Planet Index for insectivores increased by 26% between 1993–1994 and 1985–1986, but later declines were not evident because of the great variation caused by a significant decline in the Japanese bush warbler Cettia diphone (Fig. 3b; Table 2). Excluding the bush warbler, the Living Planet Index for group I increased by a mean of 38% in 1993–1994 and 2001–2002 and by 53% in 2009–2010 compared to 1985–1986.
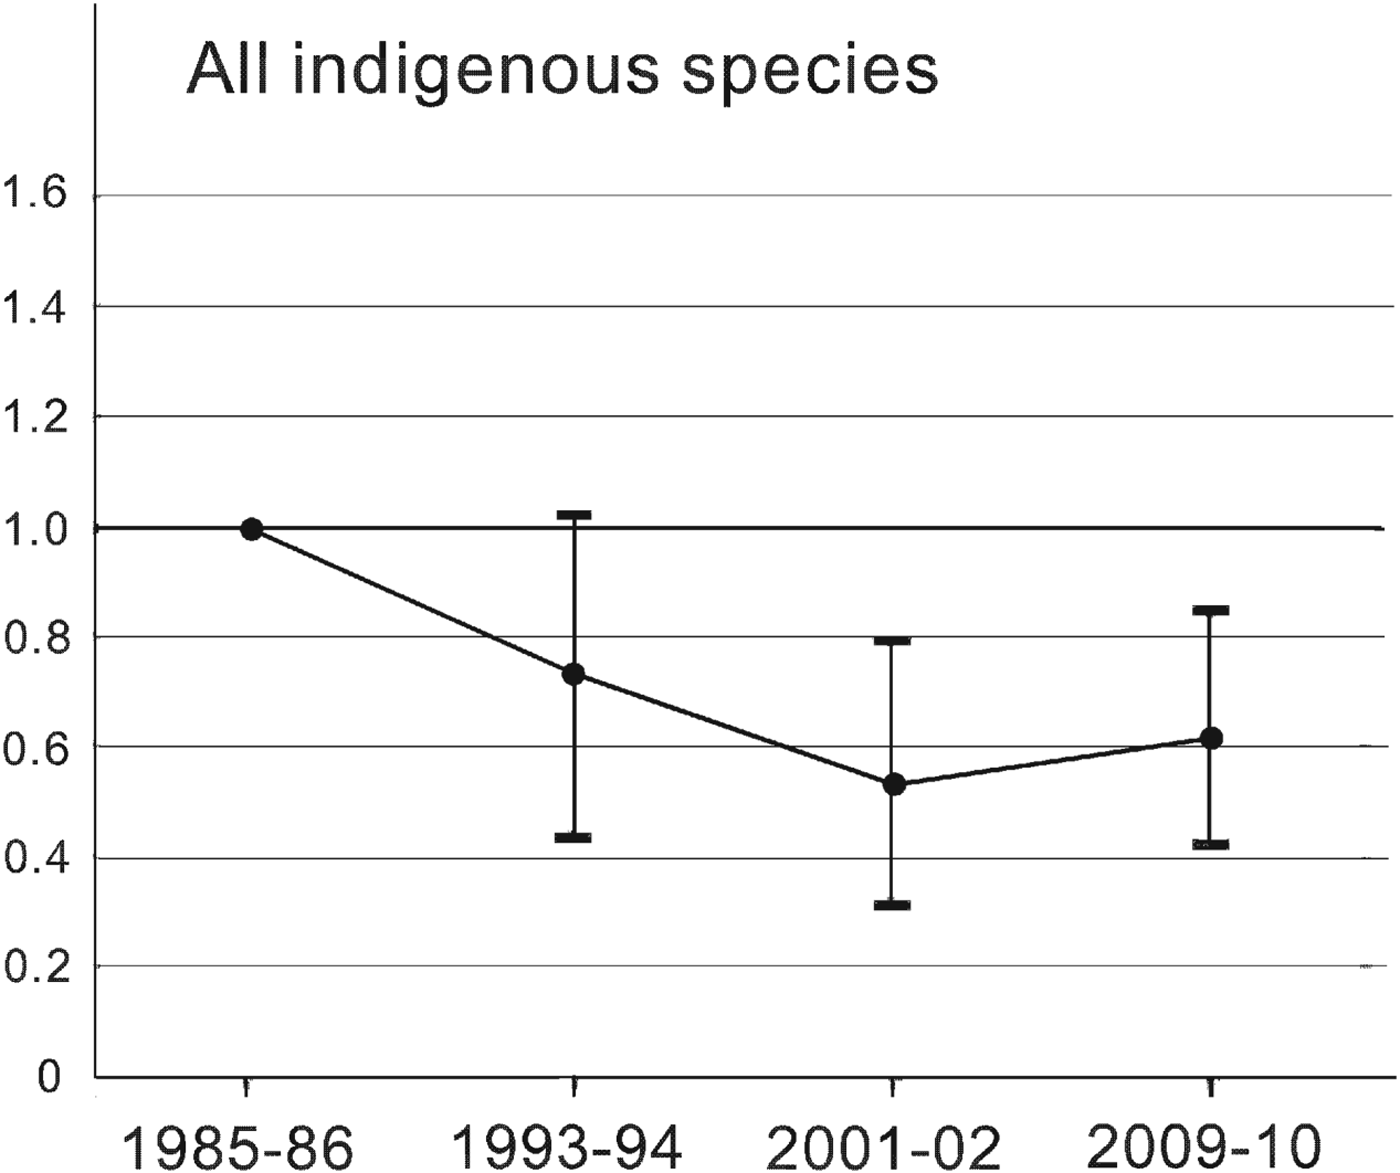
Fig. 2 The Living Planet Index for 23 indigenous species (i.e. all species except Herpestes auropunctatus and Rattus rattus) on Amami Island (Fig. 1), indicating the population level relative to that of 1985–1986. Values < 1.0 indicate that the population was below the 1985–1986 level. The vertical bars indicate the 95% confidence interval from bootstrapping.

Fig. 3 The Living Planet Index for (a) rare species and (b) insectivorous species on Amami Island (Fig. 1), relative to 1985–1986 levels.
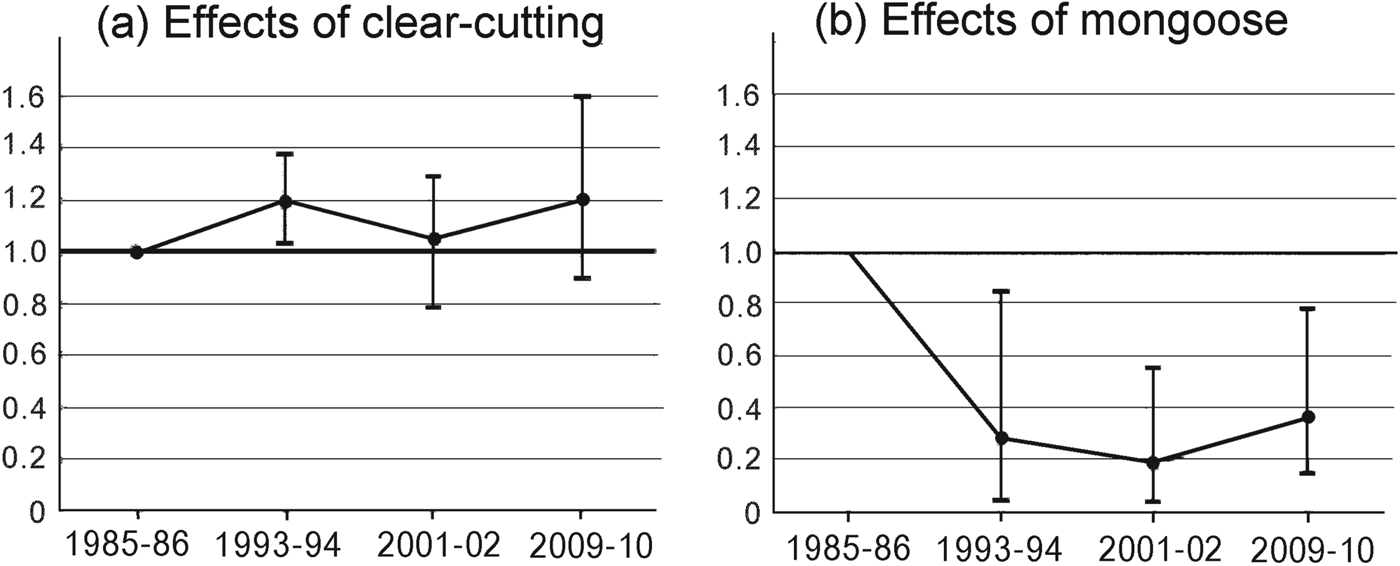
Fig. 4 The Living Planet Index for species negatively affected by (a) forest clear-cutting and (b) mongoose invasion on Amami Island (Fig. 1), relative to 1985–1986 levels.
Groups F and M responded differently and independently to forest clear-cutting and mongoose invasion (Fig. 4). The Living Planet Index in 1993–1994 changed in opposite directions from its 1985–1986 level for the two groups (Fig. 4). After 2001–2002 the mean Living Planet Index for group F was > 1.0 and for group M was < 0.4. Group F species exhibited mean population increases from 1985–1986 to 1993–1994 of 19% and thereafter remained relatively constant. Although most species in this group showed a gradual increase (Table 2), populations of the robin E. komadori and the thrush Z. dauma decreased by 25% and 43%, respectively, from 1993–1994 to 2001–2002, resulting in a decline in the Living Planet Index during this period. In contrast, the Living Planet Index indicates that the abundance for the group M species in general dropped to c. 19% of its 2001–2002 level and then increased to 36% of that level by 2009–2010.
Discussion
An important issue in this type of analysis is whether diversity should be represented by presence–absence or abundance data. Reliable information on abundance is often difficult to obtain and, in many cases, presence–absence data can be as powerful as count data, or even more so (Pollock, Reference Pollock2006). Therefore, presence–absence data are often a more appropriate measure of diversity than abundance under data scarcity. Nevertheless, we used abundance for several reasons. Firstly, most of the data in the Amami Island bird database are point counts. Secondly, the presence–absence data for T. osimensis and R. rattus are insufficient for analysis even though it is apparent that T. osimensis decreased in abundance and R. rattus increased. Thirdly, the rabbit P. furnessi, one of the species of greatest concern, declined in number rather than in the area of its range (Sugimura & Yamada, Reference Sugimura and Yamada2004).
The species-by-species approach identifies four patterns of decline and increase, among which pattern d can be regarded as the most critical. However, it is not practical to set a conservation target based on such patterns, for example that the abundance of every species with pattern d be recovered to the 1985–1986 level, for the following reasons. Firstly, some species with pattern d, e.g. E. komadori, were observed more frequently than other species with patterns a and b. Secondly, although there was a dominant pattern within each group, the variation in the population change was large (Table 2): pattern c dominated group R but contrasted with the significant change in abundance of the woodpecker Dendrocopos leucotos, and the decline of the warbler C. diphone was significant and in contrast to the dominant trend in group I. Thirdly, changes in the populations of the M species were the most consistent of the five groups but it is difficult to show that the mongoose control was effective during the period between 2001–2002 and 2009–2010 based on the species-by-species approach. Alternatively, the Living Planet Index, such as seen for M species, indicates that conservation efforts are needed urgently, and a target may be set to recover the Index to its 1985–1986 level, i.e. 1 (Fig. 4). If the habitat has been destroyed by forest clear-cutting the target should be to increase the lower range of the Living Planet Index for species in group F to > 1.
Nevertheless, it remains difficult to identify trends for group I, in which the decline of C. diphone caused a decline of the Living Planet Index. Therefore, when the Living Planet Index is used it is necessary to examine whether any individual species has experienced a marked population change compared to other species in the group.
Previous studies based on the Living Planet Index have used taxonomic groups for comparison (Loh et al., Reference Loh, Green, Ricketts, Lamoreux, Jenkins, Kapos and Randers2005; McRae et al., 2007; Collen et al., Reference Collen, Loh, Whitmee, McRae, Amin and Baillie2008). However, species in the same taxonomic group, either mammals or birds, living in the same forest habitat showed a variety of abundance changes in this study. Clear conservation implications emerge when the Living Planet Index is based on groups disaggregated according to criteria other than taxonomy or habitat type. The difference in the Living Planet Index between indigenous and rare species suggests that the latter are more affected by habitat change and/or predation pressure than the former, and that insectivorous species are not the highest conservation priority.
The Living Planet Index is useful when groups are aggregated according to vulnerability to forest clear-cutting or mongoose predation. Although extensive logging on Amami Island almost halted during the early 1990s, the recovery of group F was not as strong as might be expected (Sugimura, Reference Sugimura1995; Kagoshima-ken, 2007, 2010). Although local foresters claim that species have not gone extinct as a result of logging, several species have been negatively affected by clear-cutting (Sugimura, Reference Sugimura1987). As wood production has been increasing again since 2007 (Kagoshima-ken, 2010) the effects of forestry activity on F species need to be monitored and the Living Planet Index may be an appropriate tool for this. Sugimura (Reference Sugimura1987) suggested that populations would recover faster after selective logging than clear-cutting. However, government subsidies facilitate clear-cutting and plantation forestry (Sugimura, Reference Sugimura1988; Sugimura & Howard, Reference Sugimura and Howard2008).
Although the Convention on Biological Diversity acknowledges that the Living Planet Index is one of the most well-developed global indicators of biodiversity (Jones et al., Reference Jones, Collen, Atkinson, Baxter, Bubb and Ilian2010), it has not been widely used (Loh et al., Reference Loh, Green, Ricketts, Lamoreux, Jenkins, Kapos and Randers2005; Collen et al., Reference Collen, Loh, Whitmee, McRae, Amin and Baillie2008; Yamaura et al., Reference Yamaura, Amano, Koizumi, Mitsuda, Taki and Okabe2009). This may be because of the difficulty in collecting quantitative data on populations over long periods. Although a relatively large amount of data is available on changes in species abundance on Amami Island, data were difficult to obtain for some species. For instance, the spiny rat T. osimensis experienced a sharp population decline between 1985–1986 and 1993–1994 (Table 2), which may be attributable to predation by mongoose (Watari et al., Reference Watari, Takatsuki and Miyashita2008) and/or a decrease in the area of mature forests (Sugimura, Reference Sugimura1987). However, the precise magnitude of the decline is not known because we did not set as many traps to catch the rat during 1993–1994 as during 1985–1986. If the spiny rat were removed from the analysis because of this uncertainty the Living Planet Index would indicate a much lower level of importance of protecting rare species and controlling the mongoose population.
If the objective is to identify the overall population trend among wildlife living in forests, the number of species considered in the analysis should be as large as possible. However, that the Living Planet Index can be disaggregated into meaningful subsets is one of its greatest strengths (Collen et al., Reference Collen, Loh, Whitmee, McRae, Amin and Baillie2008). The Living Planet Index for R species showed greater decline than that for indigenous species, which suggests that protecting R species is more urgent than protecting other species as a whole and that the index for group R is more useful than that for the indigenous species group, even though the number of species is smaller in group R. Also, the difference in the Living Planet Index for M species and F species indicates that mongoose control is a higher priority than controlling forest clear-cutting. Thus, a target group for conservation became more evident by selecting R species or M species from all indigenous species and using a smaller group for the Living Planet Index. However, excluding species for which there is insufficient information decreases the representativeness of a group and is problematic if some of these species have significant effects on the Living Planet Index.
Overall our study suggests that aggregating groups into R or M from a conservation perspective (e.g. rare species or species affected by mongoose predation rather than species living in forests) is a useful approach for directing attention towards conservation needs. It is often difficult to monitor species of concern over a long period. Although our surveys were conducted infrequently we identified large population changes, and at least two contributory factors, in some species. Thus, when species are grouped appropriately a clear conservation message emerges.
Acknowledgements
A number of people supported our surveys for more than 24 years: Dr S. Hattori provided research equipment and practical advice; Amami Wildlife Center, Amami Ornithologists’ Club and Japan Wildlife Research Center provided valuable information on species abundance; T. Morosawa assisted with the estimation of spiny rat abundance; Y. Abe, Y. Handa, Y. Takatsuki, H. Kawaguchi, H. Nagaoka, H. Saito and A. Miyamoto, Amami Ornithologists’ Club and students from Kagoshima University and Kanagawa University took part in our field surveys. We thank the Japanese Ministry of the Environment, the Nippon Life Institute Foundation, the Sumitomo Foundation and the World Wildlife Fund Japan for financial support. We also thank the national and local forest offices for approving forest use and the local office of the Ministry of the Environment for approving the publication of this study. Finally, we thank Dr M. Fisher and anonymous reviewers for their comments.
Biographical sketches
Ken Sugimura's research focuses on forestry and wildlife, and he has worked on the Amami rabbit conservation project in cooperation with Fumio Yamada. Shintaro Abe and his colleagues on Amami Island initiated a survey, in 1990, on the distribution, abundance and food habits of the mongoose. In the same year Ken Ishida and the Amami Ornithologists’ Club started the Amami thrush monitoring programme, followed by other bird studies. The Japan Wildlife Research Center has been actively involved in monitoring species populations on Amami since 1992, with financial support from the Japanese Ministry of the Environment and technical assistance from the groups mentioned above. Throughout these activities the authors have been exchanging monitoring data in an effort to identify causes of species population changes and inform conservation policy.


