


Introduction
Malaria is a life-threatening disease caused by Plasmodium parasites, which is transmitted among people through the bites of infected female Anopheles mosquitoes [1]. Among the five Plasmodium species known to be infectious for humans [Reference Figtree2], Plasmodium falciparum and Plasmodium vivax are the two main species of parasites that pose the greatest threat worldwide [1, 3]. Malaria is usually an acute febrile illness with symptoms such as fever, headache and chills typically appearing 10–15 days after the individual has been infected. If not treated within 24 h, cases of P. falciparum malaria can progress to severe illness and even death [1, 3].
In 2016, the World Health Organization (WHO) indicated that nearly half of the world's population was at risk of malaria [1], and there were an estimated 216 (196–263, 95% confidence interval (CI)) million cases of malaria in 91 countries. It was estimated that 435 000 deaths from malaria had occurred in 2017 globally [4]. Despite being preventable and treatable, malaria continues to have a devastating impact on human health around the world [5]. China has a long history of struggling with infectious diseases, and historically, malaria had been widespread in China, especially in the early 1970s. Over the past decades, China has adopted comprehensive intervention policies and strategies [Reference Cao6, Reference Hu7].
The vision of the WHO and the global malaria community is a world free of malaria [5]. In 1955, the WHO launched the Global Malaria Eradication Programme (GMEP), which was an ambitious plan to eradicate malaria worldwide [3]. As of 2000, eight countries had eliminated malaria, and many other countries had reduced the transmission to low levels (<100 indigenous malaria cases per year) [5]. In 2016, China was identified as one of the 21 countries that had the potential to eliminate malaria by 2020 [3]. To meet the certification criteria for malaria elimination, a country must prove that the chain of indigenous malaria transmission by Anopheles mosquitoes has been interrupted nationwide (i.e., reducing the rate of malaria cases to zero) for at least three consecutive years. Continued measures are required to prevent the re-establishment of transmission [3, 8].
To summarise the long-term disease burden of malaria across China and evaluate the probability of achieving the eradication goal. This study characterised the incidence and mortality patterns of malaria from 1950 to 2016 and carried out the epidemic trends, the results of which are valuable for disease surveillance and prevention. To understand the epidemiological characteristics of malaria among Chinese population, the sex-, age- and spatial-specific distributions were also reviewed.
Methods
Data sources and extraction
The Chinese government established a routine reporting system for infectious diseases in the 1950s [Reference Wang9]. The system was operated through administrative grading responsibility and territorial management, which was coordinated by the Chinese Centers for Disease Control and Prevention (China CDC). Data were collected from monthly paper-based reports between 1950 and 1985, and then progressed to digital monthly reports between 1985 and 2003. In response to the 2003 severe acute respiratory syndrome (SARS) epidemic, the Chinese government resolved to improve its public health disease surveillance system and build the Internet-based China Information System for Disease Control and Prevention (CISDCP), which was a real-time reporting system covering all 31 provinces and areas in mainland China [Reference Wang9, Reference Long-De10].
All notifiable diseases are divided into three categories (class A, B and C) according to the outbreak, prevalence and degree of harm [11]. Clinicians must complete a standard case report card and report to the CISDCP when they identify any probable, clinical or laboratory-confirmed case of notifiable infectious disease within a specified timeframe. Malaria is categorised as a class B notifiable infectious disease, and diagnosed cases should be reporting within one day, case investigation within three days, and focuses investigation and action within seven days [5]. Blood smear microscopic examination was the main method for malaria diagnosis, and immunological examination (2006) and polymerase chain reaction (2015) were recommended.
Data on malaria included in this study was extracted from the CISDCP system, which was established by the China CDC with open access from the Chinese Public Health Science Data Center [12]. The period included in the data was from January 1950 to December 2016. Population data for mainland China were extracted from the national data [13]. Province-specific population data were extracted from the China Compendium of Statistics (1950–1999) [14] and the national data (2000–2016) [13]. Sex- and age-specific population data (data of 2010 were not available and were replaced by the intermediate value of 2009 and 2011) were also extracted from the national data [13]. Sex-, age- and type-specific data for malaria were available between 2004 and 2013. The number of indigenous malaria cases and deaths between 2017 and 2020 was estimated, from the annual per cent change (APC) values of indigenous malaria data between 2011 and 2016. No ethical approval for this study was required since the included data were publicly available and de-identified.
Statistical analysis
The incidence (cases per 100 000 population) was defined as the annual number of cases divided by the population of the year. The mortality (deaths per 1 000 000 population) was defined as the annual number of deaths attributed to malaria divided by the population of the year. The average annual per cent change (AAPC) and APC for incidence and mortality of malaria were selected to evaluate the burden trends of disease, and estimates were calculated by the Joinpoint Regression Program version 4.6.0.0. April, 2018 (Information Management Services, Inc., Calverton, MD, USA). All average numbers are presented with the corresponding 95% confidence interval (95% CI) in brackets. The 95% CI of incidence and mortality at the national level were estimated by the Poisson regression model using SAS 9.4 software (SAS Institute Inc., Cary, NC, USA). SAS 9.4 and Origin 2017 software (Microcal Software Inc., Northampton, MA, USA) were used to draw the figures. The significance level for the hypothesis tests was set at 0.05.
Results
Between 1950 and 2016, there were 227 668 374 cases of malaria reported in China, with an annualised average incidence of 337.024 (336.980−337.068) per 100 000 population (Supplementary Table S1). Overall, the incidence of malaria decreased with an AAPC of −11.4% (−16.6 to −6.0). The highest incidence occurred in 1970, which was 2905.704 per 100 000 (Fig. 1). Since the 1970s, the incidence of malaria has decreased rapidly with an APC of −23.9% (t = −18.4, P < 0.05). A total of 36 085 deaths attributed to malaria were reported during the observational period (1950–2016), with an annualised average deaths of 530 (525–536). Most cases of death occurred in the 1950s, and the highest mortality was observed in 1955 (8.994 per 1 000 000). Since 1980, the annual number of malaria deaths has been under 100, and the mortality rate has been under 0.1 per 1 000 000. The overall trend of mortality decreased from 1950 to 2016 (AAPC: −8.7%, −13.7 to −3.4), and the reduction continued over the last 50 years (APC: −6.9%, −8.4 to −5.4).
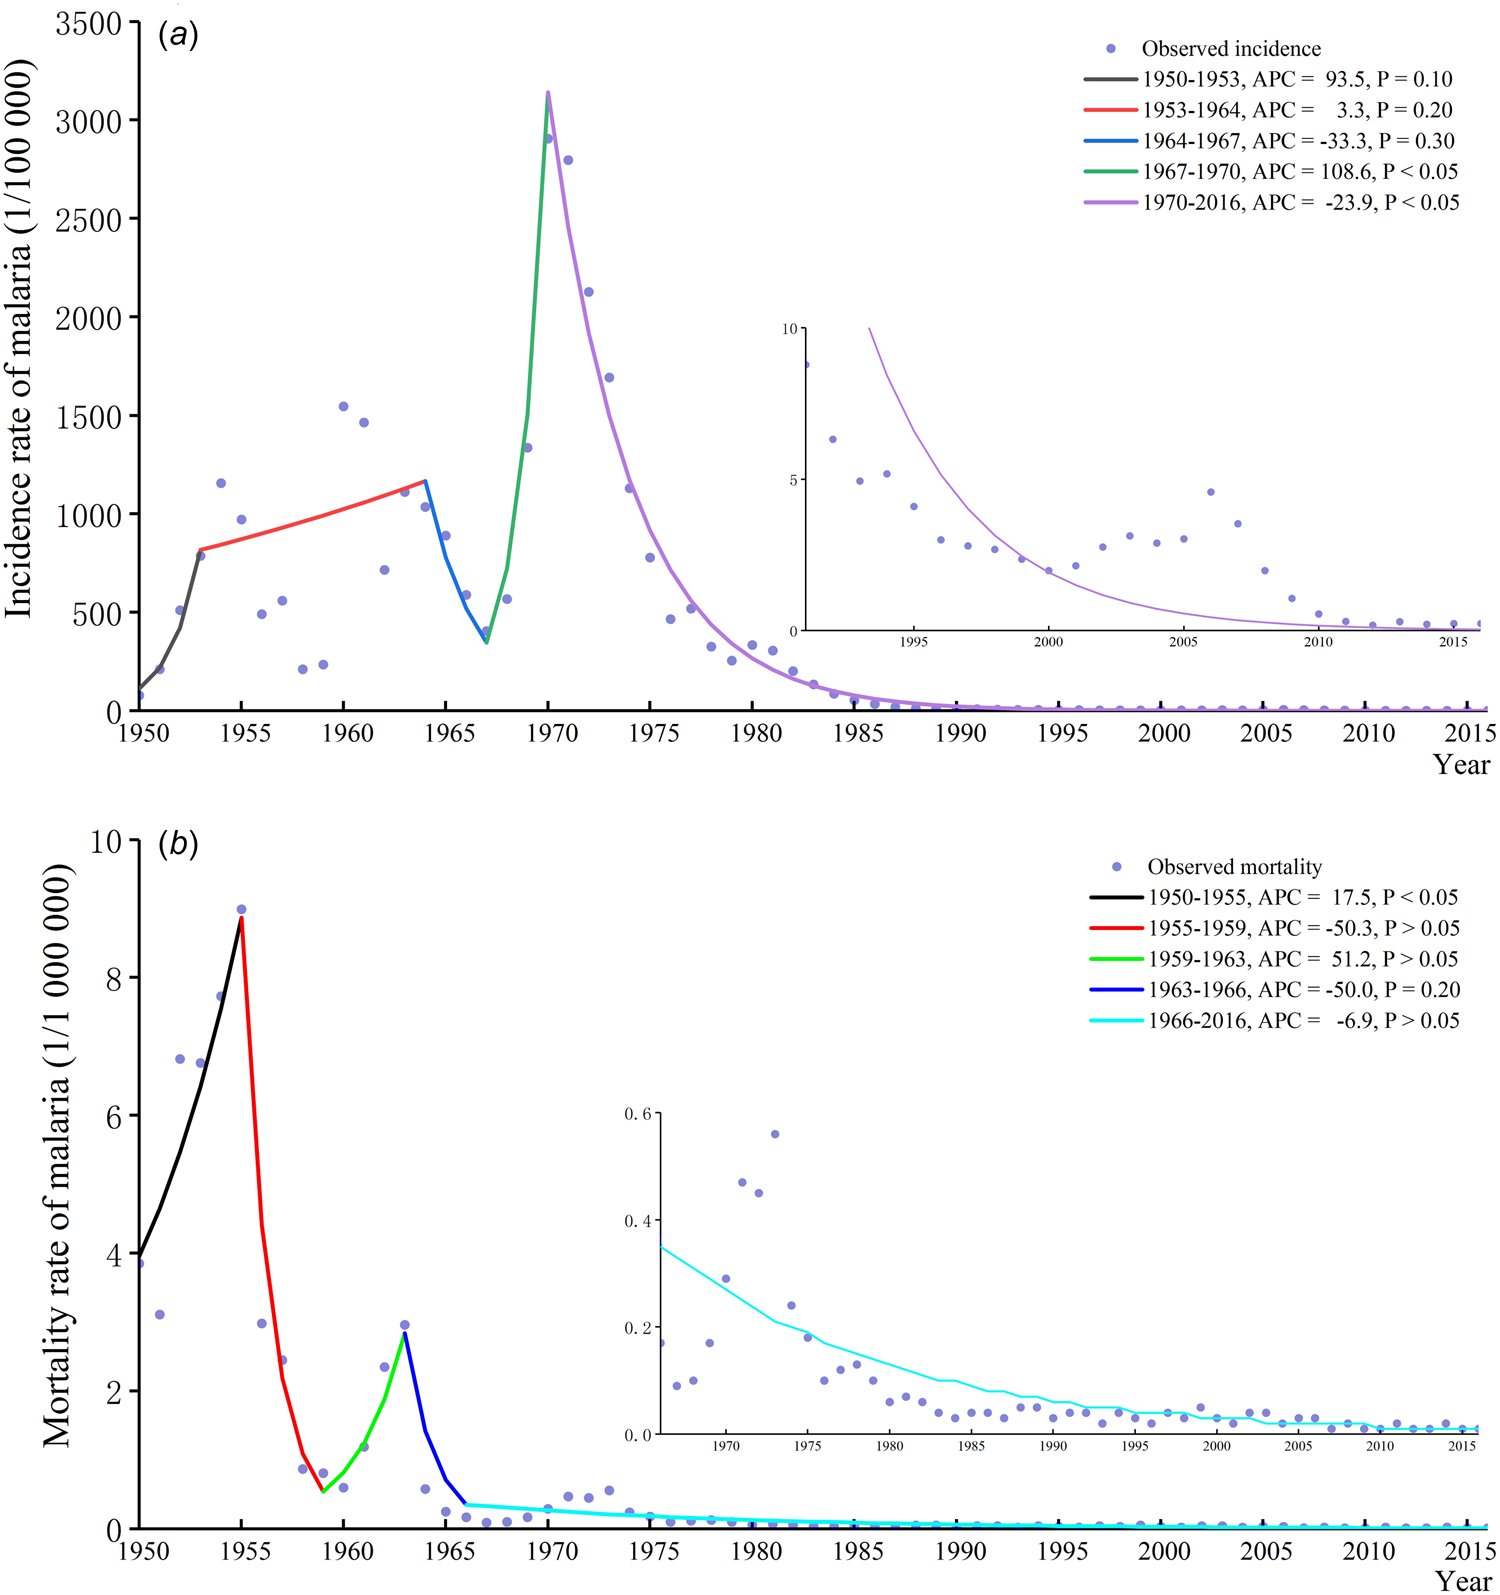
Fig. 1. Malaria epidemic trend in China from 1950 to 2016. Panel a: Incidence trend of malaria in China from 1950 to 2016; panel b: Mortality trend of malaria in China from 1950 to 2016.
The annualised average incidence rates were more than 500 per 100 000 in provinces such as Henan, Anhui, Jiangsu and Hubei. The rates were under 1 per 100 000 in Chongqing, Neimenggu, Ningxia, Heilongjiang, Qinghai and Jilin (Table 1). Epidemics of malaria were disproportionate in different provinces and areas, and overall, districts in southern China suffered more disease burden than did other areas. The incidence rates in most provinces and areas decreased, and the AAPC values were significant (P < 0.05) (Fig. 2 and Table 1). The annualised average mortality rate in Yunnan was the highest (3.466 per 1 000 000), and the rates in some districts, such as Guizhou, Zhejiang, Guangxi and Guangdong, were more than 1 per 1 000 000 (Table 1). Mortality cases were concentrated in southern China in the 1950s. The mortality rates have been under 1 per 1 000 000 approximately since the 1970s across China (Supplementary Fig. S1). Along with the incidence of malaria, the mortality rates decreased in most provinces and areas (Table 1 and Supplementary Fig. S1).

Fig. 2. Geographical distribution of malaria incidence in China.
Table 1. Changes of incidence and mortality of malaria in each province or area in China from 1950 to 2016
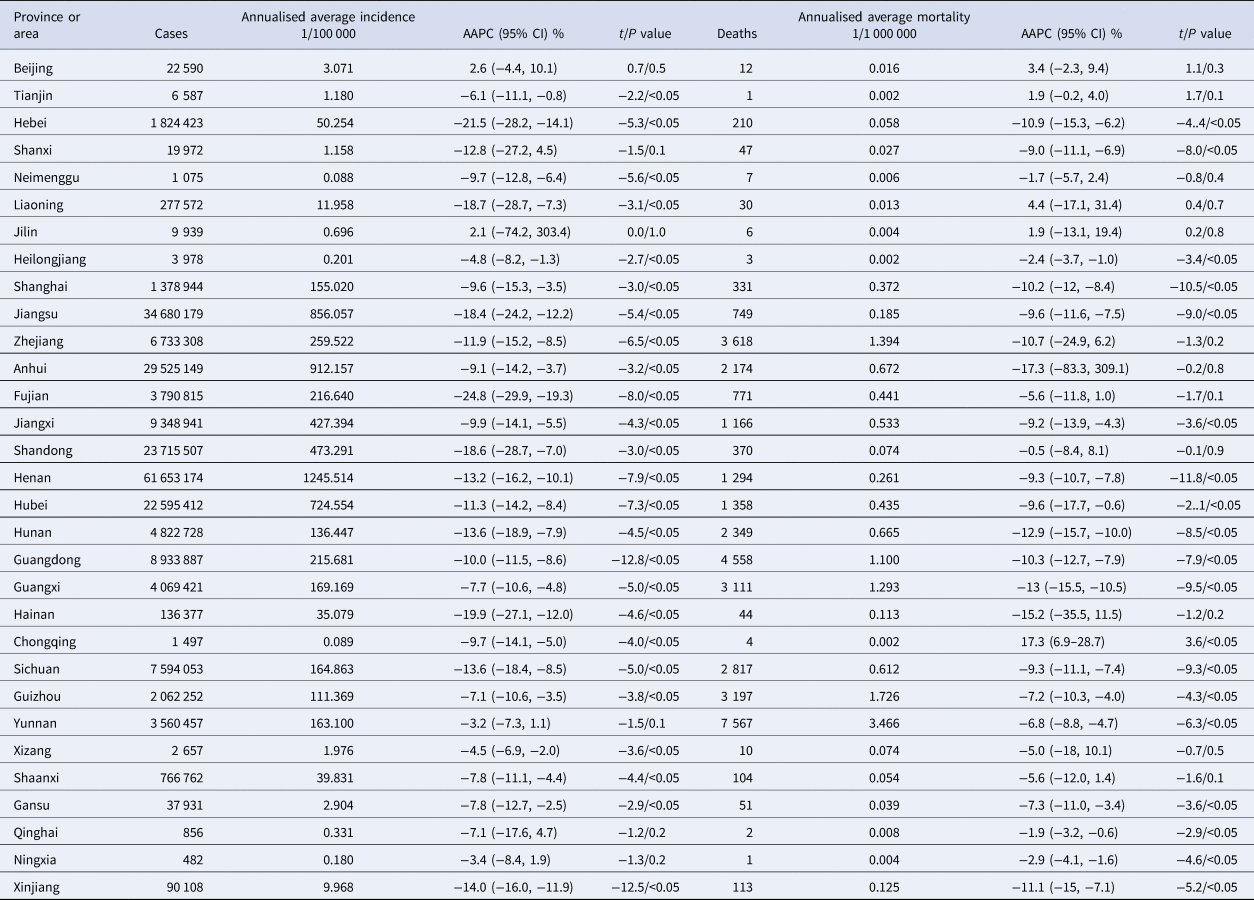
AAPC, average annual percent change; 95% CI, 95% confidence interval.
The incidence and mortality of malaria appeared in surges in different seasons, and the rates showed decreasing trends by each season (Fig. 3). During the year, the incidence rates were higher in the period from July to September than in other months. During the observational period, three peaks of incidence rates occurred in 1955, the 1960s and the 1970s. Mortality rates were higher in August through October than in other months from 1950 to 1980 and peaked in approximately 1955 and 1963. In total, 57.0% of malaria cases occurred in July through September compared to 4.1% in December through February. Additionally, 50.5% of malaria deaths occurred in August through October compared to 10.2% in January through March (Supplementary Fig. S2).

Fig. 3. Seasonal distribution of malaria incidence and mortality in China. Panel a: Seasonal distribution of malaria incidence from 1950 to 2016; panel b: Seasonal distribution of malaria mortality from 1950 to 2016.
Malaria incidence rates were higher among males compared to females from 2004 to 2013, with the lowest male-to-female ratio of 1.63. The highest incidence rates among males (5.728 per 100 000) and females (3.358 per 100 000) were observed in 2006 (Supplementary Fig. S3). The distribution of malaria incidence rates among all age groups was similar during the same period. The incidence rates peaked in 2006 in all age groups. The rate was more than 6 per 100 000 in the 70–74 age group in 2006 (Supplementary Fig. S4). The incidence rates decreased among all age groups and remained continuously low in recent years (under 1 per 100 000). Since mortality rates stayed at low levels between 2004 and 2013 (236 malaria deaths reported), the sex- and age-specific rates were not reviewed.
Table 2 lists the reported malaria cases and deaths in China from 2011 to 2016 and the predicted cases from 2017 to 2020. There were no significant decreases in malaria incidence (APC: −4.2%, −15.5 to 8.7) or mortality (APC:−8.6%, −22.4 to 7.8), which indicated that the malaria epidemic was stable. This situation was mainly attributed to the imported cases, since the number of imported cases increased from 2011 to 2016 (APC: 11.4%, −16.3 to 47.6) and occupied the majority. The predicted number of malaria cases and deaths will decrease from 3 638 and 27 in 2011 to 2 562 and 10 in 2020, respectively. The incidence rate of indigenous cases decreased (APC: −78.1%, −89.3 to −55.4). Prediction showed that no indigenous malaria case would be reported during 2016 and 2020.
Table 2. Reported and predicted malaria cases and deaths in China from 2011 to 2020
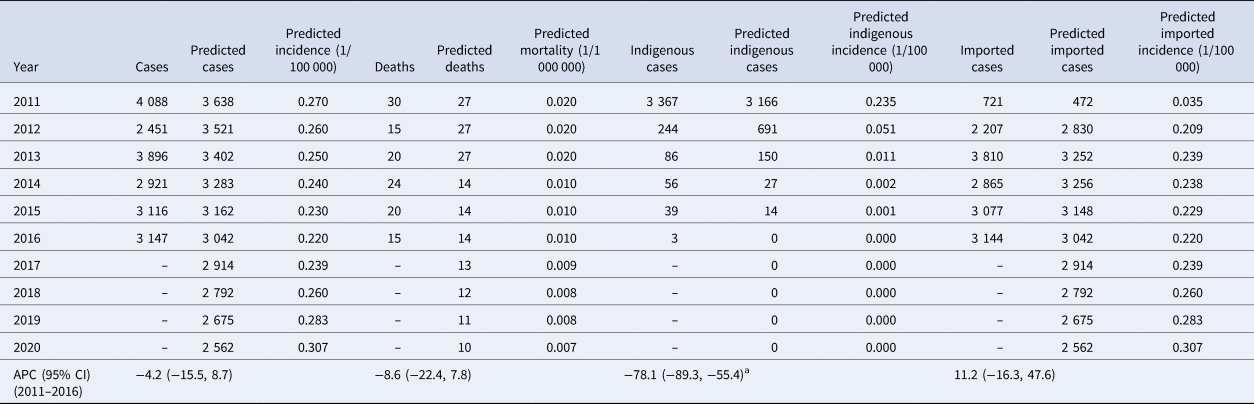
APC, annual percent change; 95% CI, 95% confidence interval.
a Significant at 0.05 level; number of predicted cases from 2017 to 2020 was based on the population in 2016.
Discussion
The trend of malaria in China between 1950 and 2016 was summarised. The incidence and mortality of malaria fluctuated during some periods. In general, the burden of malaria among the Chinese population was dramatically reduced. Consistent with this trend, the global incidence rate of malaria was estimated to have decreased by 18% between 2010 and 2017, and the WHO South-east Asia region recorded the largest decline (59%) [4]. These achievements may largely be attributed to the economic development and the improvement of disease management.
Most malaria cases (92%) were in the WHO African region [4]. The geographical distribution of malaria was also unbalanced within China. The high-incidence areas were mainly concentrated in central and southern areas of China (Henan, Anhui, Jiangsu, Hubei, Sichuan, Yunnan, Guangdong and Guangxi), while relatively low in northern areas. A previous study reported that the number of malaria cases in Anhui, Yunnan and Hainan provinces accounted for 77.48% of the total cases from 2006 to 2010 and concluded that provinces with high incidence rates were concentrated in central and southwestern China and Hainan [Reference Ya-Nan15]. Furthermore, the geographical distribution of malaria tended to concentrate as time progressed from this study. It was also revealed that the spatiotemporal distribution of malaria in China changed from relatively scattered (2004–2009) to relatively clustered (2010–2014) [Reference Huang16]. This mainly resulted from imported cases, since these imported ones from trade activities and international workers would directly increase the number of cases which were not attributed to local climate conditions or mosquitoes density. For mortality, the rates were relatively high in southern China in the 1950s, and the disparity between areas was not obvious and remained at low levels since the 1970s. Seasonal patterns of malaria in China were obvious with the incidence rate peaked in July through September and mortality peaked in August through October. Another study also showed that malaria cases were mostly concentrated in the second half of the year, particularly in July through October [Reference Ya-Nan15].
The seasonal and geographical distribution of malaria observed might be associated with the seasonal dynamic of Anopheles mosquito vectors and human population distributions. National surveillance of mosquitoes showed that the mosquito density in the areas south of the Yangtze River was higher than that in other areas, and this corresponded to areas of higher malaria incidences. The density of Anopheles mosquitoes was peaked during June through August [Reference Wu17]. Natural and climatic conditions in summer are more suitable for mosquitoes compared to those in winter. Additionally, the distribution of the population was regional (mainly concentrated in the southeast and central regions), which was also associated with factors such as river network density, temperature and the warming index [Reference Fang18]. The susceptible population was consistent with that of mosquitoes, and these conditions were conducive to the occurrence of the malaria epidemic.
Males suffered more disease burden of malaria than females from this study, males accounted for 64.8%–87.0% of malaria cases in previous studies [Reference Ya-Nan15, Reference Kong19]. This may be associated with the work activities, for example, farmers (mostly males) were more likely to be exposed to the environment of Anopheles mosquitoes. It has been observed that all age groups were at risk of malaria [Reference Kong19]. Another study between 2006 and 2010 reported the lowest incidence rates in those under 5 years of age (1.32 per 100 000) and highest rates in those over 60 years (3.41 per 100 000) [Reference Ya-Nan15]. The WHO concluded that children under 5 years of age and pregnant women were particularly susceptible to infection, illness and death, especially in high transmission areas [1]. The susceptibility to malaria among the population was mostly related with the types of transmission (continuous, seasonal or short time). In permanent transmission areas (most African regions), adults developed the immunity and children were more susceptible. While in seasonal transmission areas, the level of exposure was not enough to build a consistent natural immunisation in adults, so the whole population expressed comparable susceptibility. In China, all age groups showed a similar susceptibility to malaria (Supplementary Fig. S4) and population at highest risk was exposed to risk factors related to work activities and location of residence [Reference Wang20].
P. vivax is the dominant malaria parasite in most countries outside of sub-Saharan Africa and that P. falciparum is responsible for most malaria-related deaths globally [1, 3]. In China, P. vivax accounted for 76.3% (185 013 cases) of malaria incidence cases and 8.5% (207 701 cases) by P. falciparum between 2004 and 2013. The proportion of malaria deaths attributed to P. falciparum was 87.7% and 6.8% by P. vivax. These results were consistent with other reports [Reference Kong19, Reference Lin21–Reference Xiao-Dong23].
China has initiated many efforts to prevent malaria and reduce the disease burden. Case reporting from the private sector was mandatory in the 1950s. Since then, many policies and strategies for intervention, diagnosis, treatment and surveillance have been adopted [24]. The global fund to fight AIDS, tuberculosis and malaria has supported China between 2003 and 2012 [Reference Hu7]. The Chinese government has covered the investment gaps since 2012 [Reference Wang20]. The national malaria elimination action was initiated in 2010 [25]. The successful control of malaria in China was mainly attributed to the country leadership efforts (national elimination strategy, community mobilisation, case-based surveillance and reference laboratory systems) and the country-led efforts (regional and inter-sectoral collaboration, sustained financial support) [Reference Feng26]. The technical ‘1–3–7' strategy, which specifies case reporting within one day, case investigation within three days and focuses investigation and action within seven days, was also rolled out and widely disseminated [Reference Cao6]. The timeliness of the implementation of malaria surveillance and response largely improved after the strategy was integrated into the CISDCP system. Other countries with high malaria burden could learn that elimination of disease should involve country leadership and multi-sectoral cooperation.
China is listed as one of the countries that were on course for malaria elimination by 2020 [4, 8]. The number of malaria cases and deaths between actual and prediction were very close. In 2017, there were 2 697 malaria cases reported, among which six patients died [27]. The predicted number of malaria cases was 2 914 for 2017 and 2 562 for 2020. The predicted number of deaths would decrease from 13 in 2017 to 10 in 2020. Among those cases, most of which were imported cases and became the major source of disease burden. There will be none indigenous cases during 2016 and 2020 by the prediction compared to the actual three indigenous cases from areas bordering Yunnan and Tibet in 2016, and zero in 2017 [8]. In short, the goal of eliminating malaria by 2020 will be highly probable in China.
Along with the vector controlling (insecticide-treated mosquito nets and indoor residual spraying) nationwide [1], China should give more attention to cross-border areas and imported malaria cases recently [Reference Feng28]. Yunnan and the Tibet Autonomous Region were the only regions that reported locally acquired malaria cases in 2014 [Reference Hu7]. Several high-risk counties in the long international land border still face a persistent risk of malaria introduction and transmission [Reference Zhang22]. The imported malaria cases are the key challenges to achieve malaria elimination in China [Reference Lai29]. Since the majority of malaria infections are asymptomatic, active case detection methods in community should also be conducted to overcome the limitations of passive surveillance [Reference Sturrock30]. A recent study revealed that African ape parasites in the wild are 10-fold more diverse than human P. vivax and exhibit no evidence of species specificity, which means that P. vivax will never be eradicated unless to eliminate malaria from apes, or it can cross the border at any time and cause new malaria outbreaks [Reference Loy31]. Resurgence of malaria may occur if control and surveillance measures are scaled back too early [Reference Lai32]. Historically, a marked increase in malaria incidence worldwide occurred as the funding was cut further [3]. For China, a practical strategy should focus on the investigation and disposal of malaria case and foci in the specific areas and among the high-risk population [Reference Yang and Zhou33].
Limitation
This study has several limitations. First, though long-term and wide-covered data were included in this study, the results may be underestimated since the data were passively reported. Second, epidemic characters of other types of Plasmodium, such as P. ovale, P. malariae and P. knowlesi were not involved. Third, data in the early periods are insufficient and may be less reliable than those in the later years (variations in surveillance system, data standards of collection, diagnostic levels and so on).
Conclusions
The results of this study showed that the burden of malaria among the population in China fell drastically from 1950 to 2016. The geographical distribution of malaria was unbalanced, and a seasonal pattern was obvious. Increased attention should be paid to imported malaria cases because these cases were the major threat in recent years. Overall, the goal of malaria elimination by 2020 is a realistic aim for China.
Supplementary material
The supplementary material for this paper can be found at https://doi.org/10.1017/S0950268820000333.
Acknowledgements
We acknowledge the Chinese Center for Disease Control and Prevention for opening and sharing the data through the Public Health Science Data Center. The funders had no role in the study design, data collection, data analysis or writing of the manuscript. The corresponding author had full access to all the data and had the final responsibility for the decision to submit for publication.
Author contributions
SY, LL and CD conceived and designed the study; CD, CH, YZ, XF, XL, JW and MD extracted, cleaned, analysed the data and interpreted the results; CD wrote the first draft; CD and CH contributed to figures and manuscript preparation; all authors critically revised the manuscript and accessed the final approval for publication.
Financial support
This work was supported by the National Natural Science Foundation of China (S.Y., grant numbers 81672005, 81001271) and the key joint project for data centre of the National Natural Science Foundation of China and Guangdong Provincial Government (S.Y., grant number U1611264) and the Mega-Project of National Science and Technology of China (S.Y., grant numbers 2018ZX10715014, 2013ZX10004904, 2014ZX10004008, 2013ZX10004901) and the Fundamental Research Funds for the Central Universities.
Conflict of interest
None.
Ethical standards
Anonymous (de-personalised) aggregated data were used for which no ethical approval is required.


 Open access