


It has often been observed that many individuals are reluctant to admit engaging in social comparisons (e.g., Helgeson & Taylor, Reference Helgeson and Taylor1993). For example, in a series of studies, Wilson and Ross (Reference Wilson and Ross2000) found that in open-ended descriptions, social comparisons were much less frequently used to characterize one-self than were comparisons with one’s own self in the past. In fact, social comparisons are often considered inappropriate, especially when they result in socially undesirable emotions, such as envy and Schadenfreude (Buckley, Reference Buckley, van Dijk and Ouwerkerk2014). However, according to Gilbert, Price, and Allan (Reference Gilbert, Price and Allan1995) social comparison activity is phylogenetically very old, and can be recognized in many species. Gilbert et al. suggested that the process of social comparison stems from the need to assess one’s power and strength compared to that of one’s competitors. In the course of evolution, this tendency to compare oneself with others has undoubtedly become very important and elaborate for humans as they developed a complex social life. As suggested by Beach and Tesser (Reference Beach, Tesser, Wheeler and Suls2000), as Homo sapiens began to emerge as a distinct species, there was a shift toward more specialization within groups, and this required the ability to assess the domains in which one could specialize in order to enhance one’s status and reproductive opportunities. Social comparison facilitates such an assessment. Also, in modern society the importance of social comparison for human activity cannot be overstated, and may even be higher than ever before. Due to modern technology, such as the Internet, mobile phones and television, individuals are more than ever confronted with information about others, offering them not only the opportunity to communicate with each other whenever they want, but also the opportunity to compare themselves more frequently and with a broader range of individuals than, for instance, half a century ago (Nesi & Prinstein, Reference Nesi and Prinstein2015).
It was Festinger (Reference Festinger1954) who in his classic paper introduced the term social comparison into social psychology. According to Festinger, people have a fundamental desire to evaluate their opinions and abilities through comparison with others when objective information is unavailable. As noted by Buunk and Gibbons (Reference Buunk, Gibbons and Guimond2006), while Festinger’s original theory on social comparison had a restricted focus on the comparison of abilities and opinions, over the past decades work on social comparison has undergone numerous transitions and reformulations, and has developed into a lively, varied and complex area of research. This research encompasses many different paradigms, approaches, and applications (e.g., Suls & Wheeler, Reference Suls and Wheeler2000), and has shown the importance of social comparison processes for human functioning with regard to, for instance, well-being, achievements, interpersonal relationships and work (e.g., Buunk & Dijkstra, Reference Buunk, Dijkstra, Michael, Robinson and Eid2017).
Social Comparison Orientation: English and Dutch Versions of the INCOM
Although social comparison is a basic social process, it has often been observed that individuals may differ in their disposition to compare themselves with others. For instance, Diener and Fujita (Reference Diener, Fujita, Buunk and Gibbons1997) suggested, “… making any comparisons at all, may often be a function of one’s personality.” (p. 349). According to Gibbons and Buunk (Reference Gibbons and Buunk1999), the extent to which and the frequency with which people compare themselves with others varies indeed from one individual to the next, and this reflects an individual difference variable that was labeled social comparison orientation (SCO). In order to measure SCO, Gibbons and Buunk (Reference Gibbons and Buunk1999) developed simultaneously a Dutch and English version of the Iowa-Netherlands Comparison Orientation Measure (INCOM), an 11-item scale including items such as ‘I always like to know what others in a similar situation would do’ and ‘I often compare myself with others with respect to what I have accomplished in life’. The reliability and validity of the INCOM was examined in 22 studies in The Netherlands and the United States, showing that, in these countries, the INCOM is a valid and reliable measure of SCO (α´s ranging from .77 – .85). In an initial series of studies it was found that, relative to individuals with a low SCO, individuals with a high SCO were higher in public and private self-consciousness, higher in interpersonal orientation, somewhat higher in neuroticism, and somewhat lower in self-esteem. In addition, they tended to seek out more comparisons, spend more time engaging in comparisons, and experience stronger feelings from comparing themselves with others (Gibbons & Buunk, Reference Gibbons and Buunk1999). On the basis on these and subsequent studies, Buunk and Gibbons (Reference Buunk, Gibbons and Guimond2006) concluded over a decade ago that those with a high SCO (i.e., those who score high on the INCOM) are characterized by a combination of a high accessibility and awareness of the self, an interest in what others feel and think, and some degree of negative affectivity and self-uncertainty. Various more recent studies have substantiated these conclusions (e.g., Neff & Vonk, Reference Neff and Vonk2009). For example, Vogel, Rose, Okdie, Eckles, and Franz (Reference Vogel, Rose, Okdie, Eckles and Franz2015) found that individuals with a high SCO exhibited heavier Facebook use than those low in SCO, and showed lower self-esteem, poorer self-perceptions, and more negative affect than individuals with a low SCO after engaging in brief social comparisons on Facebook.
In addition, numerous studies in the past decades have shown that SCO as measured with the INCOM is an important moderator variable because those high in SCO are – often in complex ways - more and differently affected by upward and downward comparisons than those low in SCO. These moderating effects have been observed in many different domains, including the evaluation of one´s attractiveness, the quality of life of patients, marital satisfaction, depression and the perception of health risks (Buunk & Gibbons, Reference Buunk, Gibbons and Guimond2006; see for a review Buunk, Gibbons, Dijkstra, & Zlatan, Reference Buunk, Gibbons, Dijkstra, Krizan, Suls, Collins and Wheelerin press). To give just a few examples, Gibbons and his colleagues found in various studies that only students high in SCO were in their risk perceptions and risky behavior affected by information about how others behaved (e.g., Gibbons, Lane, Gerrard, Pomery, & Lautrup, Reference Gibbons, Lane, Gerrard, Pomery and Lautrup2002; Stock, Gibbons, Beekman, & Gerrard, Reference Stock, Gibbons, Beekman and Gerrard2015). In a similar vein, with increasing levels of SCO, the quality of life of cancer patients improved over a period of three month as a consequence of being exposed to a tape with patients who showed good coping, but not in response to other tapes (Buunk et al., Reference Buunk, Bennenbroek, Stiegelis, van den Bergh, Sanderman and Hagedoorn2011).
The INCOM-E as a Spanish version of the INCOM
Over a decade ago, Buunk, Belmonte, Peiró, Zurriaga, and Gibbons (Reference Buunk, Zurriaga, Peiró, Nauta and Gosalvez2005) reported the results of a psychometric evaluation of the INCOM-E, the Spanish language version of the INCOM. In two studies (among 212 students and 782 employees from primary health care centers), the reliability of the INCOM-E was found to be good (α = .80). The INCOM-E did not correlate with social desirability at all (r = .04, p = ns; Buunk et al., Reference Buunk, Belmonte, Peiró, Zurriaga and Gibbons2005), and the correlations with other variables were very similar to those found by Gibbons and Buunk (Reference Gibbons and Buunk1999). Individuals with a high SCO were higher in public and private self-consciousness, higher in interpersonal orientation, somewhat higher in neuroticism, although not lower in self-esteem. Particularly relevant for the present paper, moderating effects of SCO have also been observed in a number of studies in Spanish speaking countries, particularly in organizational settings. For example, in a study among Spanish nurses, Buunk, Zurriaga, and Peíro (Reference Buunk, aan ’t Goor and Solano2010) found that especially among individuals with a high SCO, the frequency of social comparisons was a predictor of burnout nine to ten months later. Another study in Spain showed that especially among students high in SCO students in their final year of study exposed to a fictitious interview with a new graduate experienced more inspiration and proactive career behavior after exposure to fictitious interview with a former student who was successful in the job market (Buunk, Peiró, & Griffioen, Reference Buunk, Peiró and Griffioen2007). A study among Spanish physicians showed that these individuals tended to interpret social comparisons at work in a more negative way as they were higher in SCO (Buunk, Zurriaga, Peíró, Nauta, & Gosalvez, Reference Buunk, Belmonte, Peiró, Zurriaga and Gibbons2005). In Argentina, it has been found that in work settings those high in SCO respond with more jealousy in response to a colleague who has a close relationship with one´s supervisor (Buunk, Aan ‘t Goor, & Solano, Reference Buunk, aan ’t Goor and Solano2010). In addition, though not a moderating effect, a study in Chile showed that SCO decreases with age (Urzúa, Zúñiga, & Buunk, Reference Urzúa, Zúñiga and Buunk2012). All these findings illustrate that as in The Netherlands and the US, also in Spanish speaking countries SCO is a relevant construct that is in meaningful ways related to other variables.
The Psychometric Structure of the INCOM and INCOM-E
In the original studies on the INCOM and INCOM-E, similar factor structures were obtained. By means of exploratory principal components analyses, Gibbons and Buunk (Reference Gibbons and Buunk1999) found two factors underlying the 11-item scale: One they labeled ‘ability comparisons’ and one they labeled ‘opinion comparisons’. Confirmatory analyses indicated that the INCOM indeed comprises of two distinguishable factors that are very highly related (in their study the correlation between the two factors was r = .79). The factor structure of the INCOME-E was nearly identical to this one, with the same two factors, and similar amounts of variance explained by both factors.
Recently, Schneider and Schupp (Reference Schneider and Schupp2014) evaluated the psychometric properties of the INCOM in the German language, supporting the existence of the above mentioned two factors in the German language version of the INCOM. However, their analyses also pointed to some problems with the INCOM, more particularly with regard to the INCOM’s two reversely coded items. According to Schneider and Schupp (Reference Schneider and Schupp2014) these reverse-coded items form either an independent component within social comparison orientation, or load with only minor values on the first factor (‘ability comparisons’). However, they also suggested that opening up a third dimension of social comparison does not seem justified on the basis of theoretical reasoning, and that also methodological arguments are not convincing enough to support a three factor structure. These authors suggested that the low factor loadings of these items may be the result of their indistinct wording and propose a shortened two-factor scale comprising six items.
The Present Study
The present study elaborates on previous studies, by investigating in more detail the structure of the Spanish version of the INCOM-E in two large samples from Spain and Chile. Results from large samples are quite robust and reliable. Special attention is given to the functioning of the two reversely coded items in the INCOM-E that have been proven problematic in the abovementioned analyses of the German version of the INCOM.
STUDY 1: Spain
Method
Participants
A total of 1,133 Spanish workers (44.6% men and 55.4 % women) in different organizations were surveyed. The mean age of respondents was 37.7 years (SD = 11.7, range 18–65). Of the participants 12.3% had only primary education, 14% had finished high school, 15.9% had completed vocational school and 57.1% had university qualifications such as bachelor, masters and PhD. degree. The respondents worked in different professional sectors, following the classification of the Spanish Ministry of Labour and Immigration: Administration and management (26.1%); trade and marketing (15%); cultural and communal services (15.4%); hotel and tourism (4.4%); computers and communications (5.9%); health (11.4%); installation and maintenance (9.4%); transport and maintenance of vehicles (1.7%); students (1.9%); unemployed (1.3%), and others sectors such as graphic arts, personal image, safety and environment (2.3%); missing values (5.2%). The overall sample therefore is large and heterogeneous with regard to several relevant background variables.
Procedure
Data collection was carried out by self-report questionnaires that were completed voluntarily by the participants in the presence of the researcher after providing their informed consent. Participants received instructions and information on the procedure in which the questionnaire had to be filled out. If necessary, the researcher provided additional explanations. The researchers emphasized that participation in the study was voluntary, and the confidentiality of the information provided was guaranteed. No findings from this sample have been published before. The research was approved by the Ethics Committee of the Faculty of Psychology of the University of Valencia.
Instrument
Like the Dutch and English versions, the Spanish version of the INCOM (INCOM-E; Buunk et al., Reference Buunk, Belmonte, Peiró, Zurriaga and Gibbons2005), consists of 11 items, of which two (Items 6 and 10 in Table 1) are reversely coded. The items were answered on five-point scales (1 = strongly disagree, 5 = strongly agree). Note that the item order is slightly different from the original English language version of the INCOM (Gibbons & Buunk, Reference Gibbons and Buunk1999).
Table 1. Item Characteristics and Correlations in Study 1 and Study 2 (Total Samples)
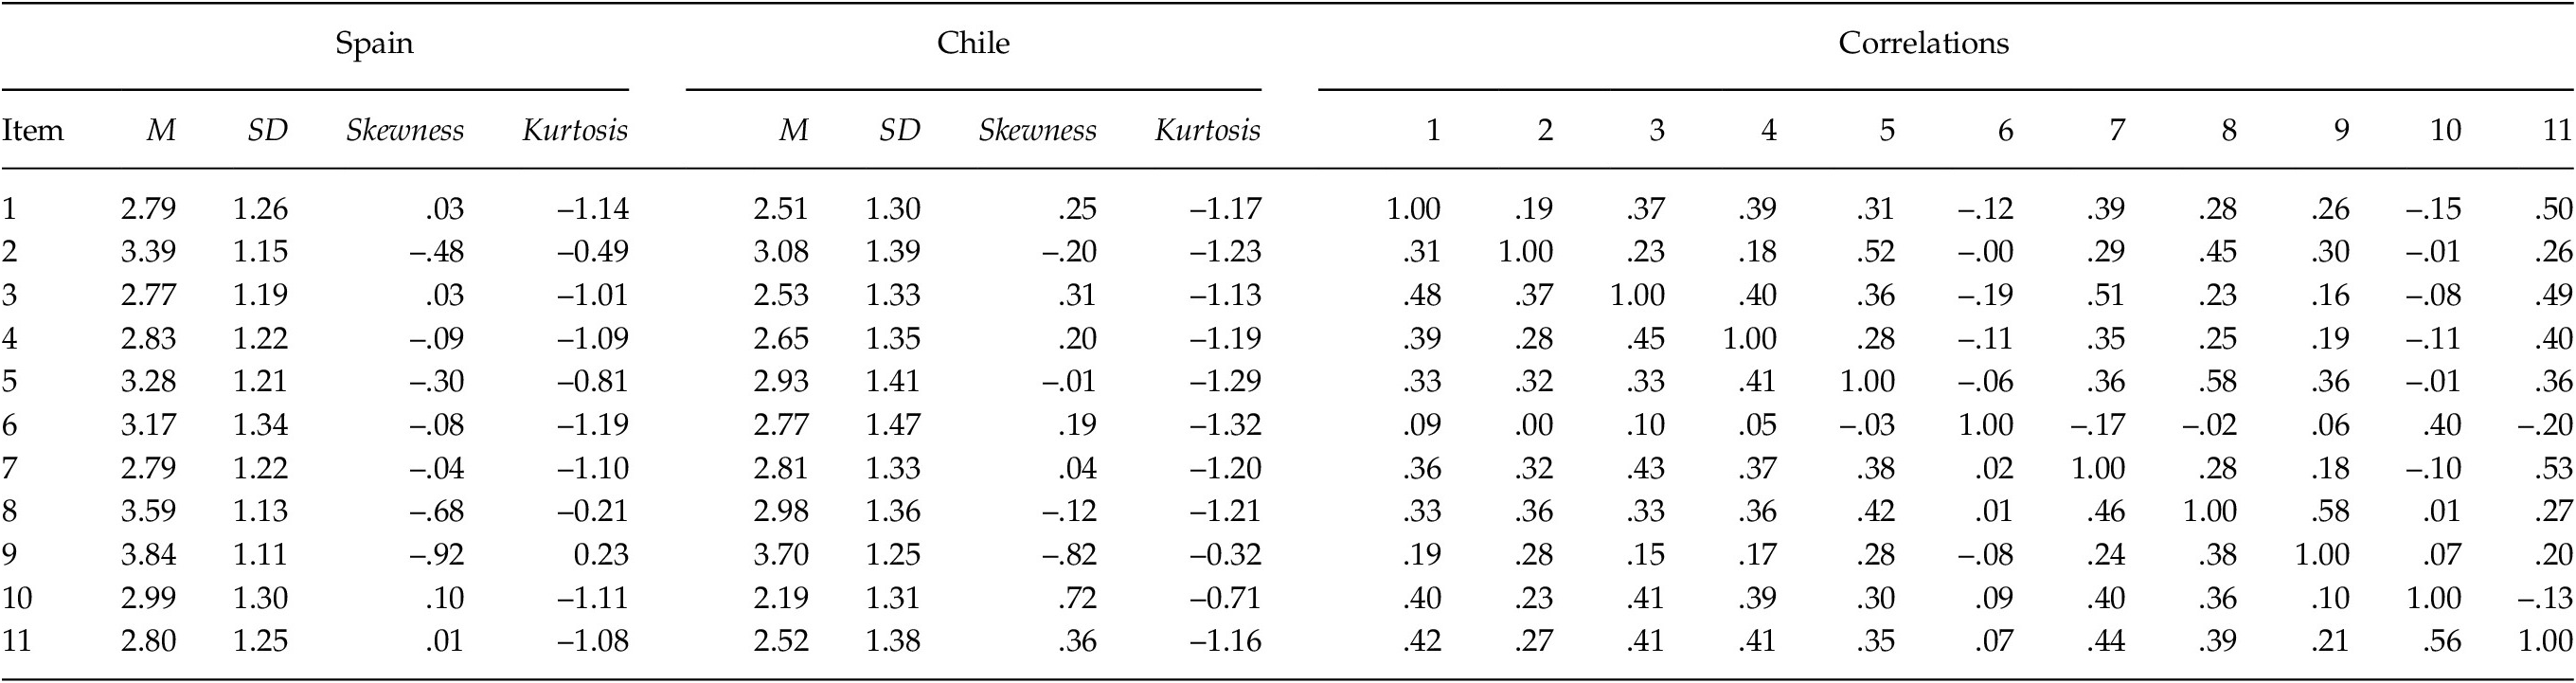
Note. Above the diagonal the correlations for the Spanish sample, below the diagonal for the Chilean sample. Item scores all range from 1 to 5.
Data analysis
We examined the item characteristics, next executed a Confirmatory Factor Analysis (CFA), and finally conducted a Mokken Scale Analysis (MSA; Mokken, Reference Mokken1971).
Results
First, we calculated item characteristics (means, standard deviations, skewness and kurtosis; see Table 1). The items all appeared to be normally distributed. Next, we examined the fit of the a priori structure of the INCOM by means of a confirmatory factor analysis (CFA) in LISREL. For this purpose, we tested a hierarchical model with two factors (comparisons of abilities and comparison of opinions; cf. Gibbons & Buunk, Reference Gibbons and Buunk1999) and one higher order factor (social comparisons). The fit of this model was poor in this Spanish sample (see Table 2), with a RMSEA value well above and a CFI value well below the criteria commonly referred to as being indicative of a good model fit. Kline (Reference Kline2005), for example, suggests that a RMSEA value ≤ .05 indicates a close fit, values between .05 and .08 a reasonable fit, and values ≥ .10 a poor fit. For the CFI, Kline (Reference Kline2005) suggests that values > .90 might indicate a reasonably good fit. Hu and Bentler (Reference Hu and Bentler1999) suggest that CFI values ≥ .95 indicate a good fit. The SRMR should preferably be smaller than .10 (Kline, Reference Kline2005), which was the case in this sample. Correlation between the two factors was r = .39.Closer examination of the factor loadings (see Table 1) revealed that both Item 6 and Item 10 (the reversely coded items of the INCOM-E) had very low loadings on the two a priori factors. Based on the poor fit indices, an alternative model was tested with just one factor (general SCO), but the fit of this model was similarly poor: χ2(44) = 137.45, p < .001, RMSEA = .163, 90% CI [.16, .17], CFI = .81, SRMR = .099. These results indicate a poor fit of both the two-factor solution and the one-factor solution, mainly because of the poor functioning of the two reversely coded items. In addition, the modification indices suggest that Item 9 was also not functioning very well in the scale (see also Table 2; Item 9 had a relatively low factor loading compared to the other positively formulated items).
Table 2. Factor Loadings Based on the CFA in Study 1 and Study 2 (Total Samples)
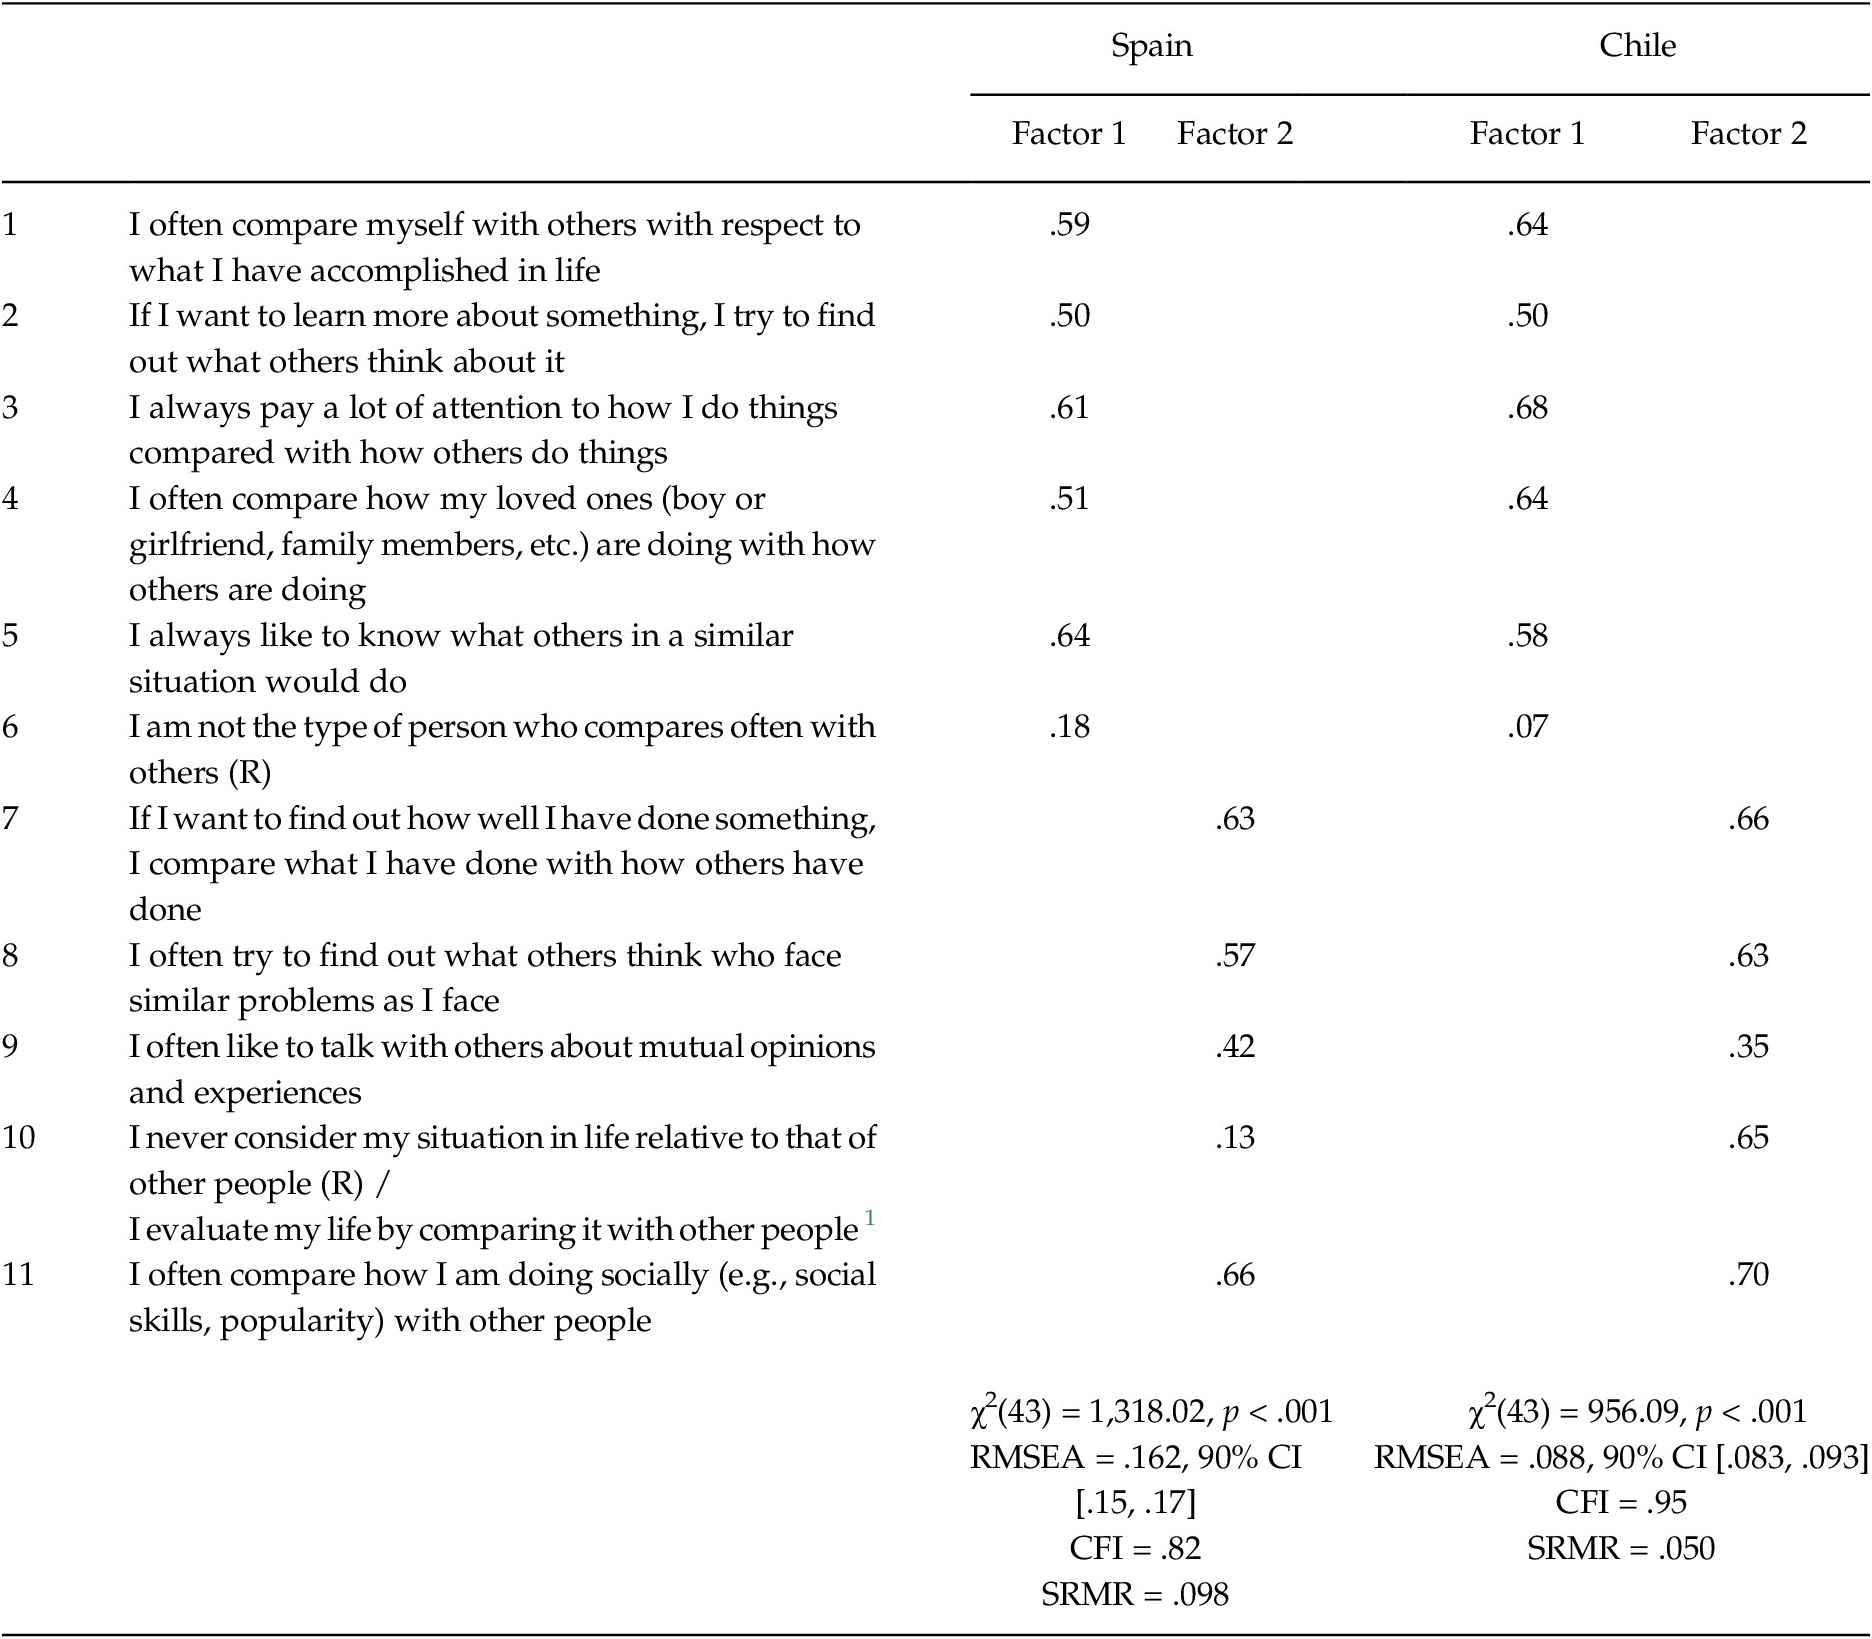
Note.
1 This item (Item 10) was different in the two samples. The first item is the original item, and was used in the Spanish sample. The second item was used in the Chilean sample.
Because the CFA did not support the previously reported structure of the INCOM in Spanish, it was decided to examine if any other subscales might be present in the Spanish INCOM in the present sample (other than comparison of abilities and comparison of opinions), For this purpose, we conducted a Mokken Scale Analysis (MSA; Mokken, Reference Mokken1971). MSA is a nonparametric item-response theory-based method that can be used to exploratively examine the dimensionality of an instrument (e.g., Sijtsma, Meijer, & van der Ark, Reference Sijtsma, Meijer and van der Ark2011; Sijtsma & Molenaar, Reference Sijtsma and Molenaar2002). Nonparametric methods, such as MSA, are generally based on less restrictive assumptions than parametric methods (e.g., Junker & Sijtsma, Reference Junker and Sijtsma2001), and are therefore more likely to fit empirical data than parametric methods (Smits, Timmerman, & Meijer, Reference Smits, Timmerman and Meijer2012). Another advantage of nonparametric methods such as MSA is that these are less sensitive to small sample sizes than parametric methods (Smits et al., Reference Smits, Timmerman and Meijer2012; Stout, Reference Stout2001). The MSA was conducted in STATA, using a module to conduct MSA (see Hardouin, Bonnaud-Antignac, & Sébille, Reference Hardouin, Bonnaud-Antignac and Sébille2011).
The MSA revealed a moderate to weak Mokken scale (e.g., Sijtsma & Molenaar, Reference Sijtsma and Molenaar2002), H = .37, comprising of all items except the two reversely coded items. Of the nine remaining items in this scale, Item 9 had an Hj of exactly .30, which was used as a threshold for including items in the scale. The MSA suggested that there are no subscales within the INCOM-E, and confirmed the poor functioning of the two reversely coded items. Also, Item 9 was not functioning very well. Based on these results, it was decided to drop Item 6 and 10 (the reversely coded items), as well as Item 9 from the Spanish INCOM, consequently reducing the INCOM-E, to eight items. Reliability of this eight item scale was estimated by computing lambda–2 coefficients. Gutmann’s lambda–2 is a reliability estimate that is similar to the more widely used Cronbach’s alfa, but is a better estimate of the reliability of the test (Sijtsma, Reference Sijtsma2009). By definition, lambda–2 is greater than, or equal to, alfa. Gutmann’s lambda–2 can easily be computed using statistical software such as SPSS. Lambda–2 of the shortened, eight item version of the INCOM was good in this Spanish sample (λ2 = .82), with item-remainder correlations varying between r = .44 and r = .61. The correlation between the original INCOM total score, based on all eleven items, and the eight item short version was r = .93 (p < .001), which suggests that this shortened eight item version can still be considered a parallel test of the full scale INCOM-E.
Relations between the shortened INCOM-E and age and gender were also examined in the present sample. There was a significant negative effect of age in this sample (r = –.22, p < .001), indicating that older participants scored slightly lower than younger participants. Gender differences with regard to the mean score on the shortened INCOM-E were examined by means of an ANOVA. There was a small, but significant gender difference: M men = 23.51 (SD men = 6.50), M women = 24.82 (SD women = 6.21), F(1, 1132) = 11.93, p < .001, η2 = .01. This means that, like what Gibbons and Buunk (Reference Gibbons and Buunk1999) found, women scored slightly higher than men in this sample. Overall, it can be concluded that there are just small relations of the shortened INCOM-E with gender and age.
STUDY 2: Chile
Method
Participants
The data came from four studies conducted in the city of Antofagasta in Chile that examined the role of socio-cognitive processes in the evaluation of the quality of life in different age groups, i.e., children (10–14 years old; n = 600, 50.0% boys), adolescents (15–18 years old; n = 530, 45.1% boys), adults (19–60 years old; n = 1,229, 49.7% men), and senior citizens (over 60, with a maximum of 88 years old; n = 398, 48.5% men). The total samples included 2,757 participants (48.7% males). The samples of children and adolescents were similar in sex, age and type of educational establishment (public versus private). Parental consent was obtained for all children under the age of 18. The adults were civil servants and employees of public and social organizations, including universities, private companies, governmental institutions, waiting rooms of state services, and banks. Senior citizens were recruited from various government and non-governmental services including clubs for seniors, neighborhood councils, as well as public and private health centers. As in Study 1, the overall sample was large and quite heterogeneous with regard to a range of background variables.
Procedure
As in Study 1, data collection was carried out by self-report questionnaires that were completed voluntarily by the participants after providing their informed consent, and after receiving instructions on how the questionnaire had to be filled out. Additional explanations were provided, if necessary. The researchers emphasized that participation in the study was voluntary, and that the confidentiality of the information provided was guaranteed. Some findings from the adult sample, not related to the psychometric properties of the INCOM-E, have been published before in a Spanish language journal (Urzúa et al., Reference Urzúa, Zúñiga and Buunk2012). The research was approved by the local ethics committee.
Instrument
As in Study 1, the INCOM-E was used, with one noticeable change. Based on a pilot study, one of the reversely coded items of the INCOM-E (Item 10 in Table 1) was replaced by a positively coded item. More specifically, the item “I never consider my situation in life relative to that of other people” was replaced by “I evaluate my life by comparing it with other people”.
Data analysis
As in Study 1, we examined the item characteristics, next executed a Confirmatory Factor Analysis (CFA), and finally conducted a Mokken Scale Analysis (MSA; Mokken, Reference Mokken1971). Given the large range in age, we also examined if the results differed between four subsamples that differed in age.
Results
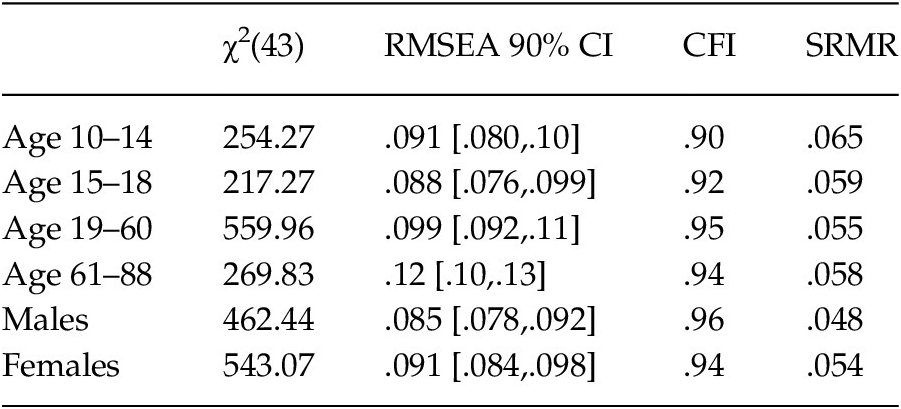
First, we again calculated item characteristics (means, standard deviations, skewness and kurtosis; see Table 1). There were no clear deviations from normality in the Chilean sample (combined sample). CFA’s were then conducted for the four age groups separately, as well as for males and females separately. The model that was tested was the a priori hierarchical model with two factors (see Study 1, comparisons of abilities and comparisons of opinions; cf. Gibbons & Buunk, Reference Gibbons and Buunk1999) and one higher factor. It was found that the fit indices were quite comparable between all four age groups (see Table 3), although criteria for the examination of invariance (e.g., Cheung & Rensvold, Reference Cheung and Rensvold2002) indicated that these structures might not be invariant between samples (CFI’s for example differ > .01)Footnote 1. The RMSEA was mostly reasonable (except for in the senior sample), the CFI’s were all .90 or higher (but not all > .95), and the SRMR was well below .10 in all samples. This indicates a reasonable, but not very good fit of the tested model.
Table 3. Model Fit for Four Age Groups, Males and Females in Study 2
For comparability reasons, we also conducted the CFA for the total combined sample (as in Study 1). In this sample, the fit of the a priori model with two factors and one higher order factor was reasonable: RMSEA = .088, CFI = .95, SRMR = .050; see Table 2). Closer inspection of the factor loadings (for the total sample; see Table 2) revealed that Item 6 (a reversely coded item) again functioned poorly (low factor loading). The reformulated Item 10 on the other hand functioned quite well (in terms of its factor loading) in this Chilean sample. Item 9 had a relatively low factor loading compared to the other items, as was the case in Study 1. A model with just one factor functioned about equally well in the total sample as the model with two factors and one higher order factor: χ2(44) = 1016,09, p < .001, RMSEA = .090, 90% CI [.085, .094], CFI = .95, SRMR = .051. These results seem to support the distribution of the items over the two factors that have been reported previously (Gibbons & Buunk, Reference Gibbons and Buunk1999), although a unidimensional structure functioned about equally well. Correlation between the two factors was r = .34.
As in Study 1, we also conducted MSA’s in the present samples. The results were highly comparable between the four subsamples, and the MSA was therefore also conducted on the total sample. The MSA in the total Chilean sample resulted in a moderate Mokken scale (H = .40; see Sijtsma & Molenaar, Reference Sijtsma and Molenaar2002), consisting of nine items: All items except Items 6 and 9. These results are largely consistent with Study 1 and support the removal of these two items from the INCOM-E. Although Item 10 did function well in the present study, this item was not part of the original INCOM-E, and was also not present in Study 1. This item was therefore also dropped. In order to examine the invariance of the factor loadings in the four age groups, we calculated the factor loadings for a one factor solution in all four age groups separately, and compared these by means of Tucker’s (Reference Tucker1951) phi-coefficients. These were close to perfect (range .99 to 1.00). This means that the one-factor solution was highly comparable between all four subsamples. Reliability of the remaining eight items in the present study was lambda–2 = .83, with item-remainder correlations ranging from r = .46 to r = .59. The correlation between the full scale and the reduced eight item version was r = .97 in this sample (p < .001), which indicates only a very marginal loss of information as a result of dropping these three items. We also compared the factor loadings of the eight item INCOM-E in the total Chilean sample with that found in the Spanish sample. Tucker’s phi equaled 1.00, indicating that these factors can be considered identical.
As in Study 1, the relation between the shortened INCOM-E and age was examined. Consistent with Study 1, and in line with previously published findings for the adult sample (Urzúa et al., Reference Urzúa, Zúñiga and Buunk2012), there was a small significant negative correlation with age in this sample (r = –.13, p < .001). Gender effects were again examined by means of an ANOVA. There was a small, but significant gender difference, but this time, men scored slightly higher than women: Mmen = 22.55 (SDmen = 7.40), Mwomen = 21.48 (SDwomen = 7.20), F(1, 2,749) = 14.71, p < .001, η2 = .01. All in all, it can be concluded that the relations between age and gender and the shortened Spanish language version of the INCOM are overall quite small.
Discussion
The aim of the present paper was to examine in more detail the psychometric properties of the INCOM-E (the Spanish version of the INCOM; Buunk et al., Reference Buunk, Belmonte, Peiró, Zurriaga and Gibbons2005), in two large samples from Spain and Chile. In the Spanish sample, confirmatory analyses did not support the proposed two-factor structure of the INCOM-E that was found in a previous Spanish sample (Buunk et al., Reference Buunk, Belmonte, Peiró, Zurriaga and Gibbons2005), and in previous samples in The Netherlands (Gibbons & Buunk, Reference Gibbons and Buunk1999), Germany (Schneider & Schupp, Reference Schneider and Schupp2014) and the United States (Gibbons & Buunk, Reference Gibbons and Buunk1999). In the Chilean sample, the model fit was reasonable, and the structure was also found to be invariant across age groups and gender. Mokken Scale Analyses revealed a single scale in both samples, in which the reversely coded items were omitted. In addition, one of the remaining items was not functioning well in both samples. Based on these results, it was decided to remove three of the original eleven items of the INCOM-E, resulting in an eight-item scale with one underlying factor. This shortened unidimensional scale was found to be reliable in both samples, and correlated very strongly with the full-length INCOM-E. Relations between the shortened INCOM-E and age and gender were examined. Although some significant effects were found with regard to gender and age, these relations were rather small. Based on the present studies results, it is advised to use the shortened eight-item version of the INCOM-E in Spanish speaking countries.
Future studies may investigate why, in contrast to the Dutch and English versions of the INCOM, the underlying two factor structure, distinguishing between ‘ability comparisons’ and ‘opinion comparisons’, was not found in the Spanish version of the INCOM, at least not in the large composed samples that were examined in the present paper. It is possible that in Spanish-speaking cultures social comparisons with regard to abilities or opinions serve a somewhat different purpose than in Anglo-Saxon cultures. With regard to opinions, for instance, it has been found that individuals in relatively collectivistic cultures, such as Spain and Chile, are more likely to avoid disagreement with others than individuals in relatively individualistic cultures, such as The Netherlands and the US. As a consequence individuals from Spain and Chile may be more likely to seek opinion-related social comparisons that confirm consensus and agreement with others, in contrast to individuals from relatively individualistic cultures who may show less hesitation to seek opinion-related social comparisons that show disagreement and distinctiveness. Differences in social comparison tendencies such as these, may cause opinion- and ability related social comparisons to be less different in relatively collectivistic cultures as opposed to relatively individualistic cultures. The fact that a previous study with the INCOM-E (Buunk et al., Reference Buunk, Belmonte, Peiró, Zurriaga and Gibbons2005) did come up with an underlying two-factor structure distinguishing between opinion- and ability-related social comparisons may be explained by differences in samples. Compared to the samples collected by Buunk et al. (Reference Buunk, Belmonte, Peiró, Zurriaga and Gibbons2005) the samples in the present study were larger and more heterogeneous in terms of country of residence (Chile and Spain) and age, and also included children and elderly people.
Because of the relatively large and heterogeneous samples that were used in the present research, the present study generates interesting and new insights into the structure of the INCOM-E. Our research suggests that the most reliable way to assess social comparison orientation in Spanish speaking countries is by means of a scale consisting of a selection of eight items from the INCOM-E (all items presented in Table 1, except the items 6,9 and 10). One could argue that a limitation of the present research is that the two studies used slightly different versions of the INCOM, as one badly functioning item was already replaced in the Chilean sample, which might have limited the direct comparison between the two datasets. However, precisely this item was also functioning poorly in the Spanish sample, which in fact confirmed its deletion in the Chilean sample. In addition, although the shortened version of the INCOM-E was reliable and highly comparable to the full-scale INCOM-E, we did not examine relations with other variables that might further support its validity. Future studies should primarily focus on the relations with other variables in order to further establish the construct validity of the shortened INCOM-E.
Financial support
This research was in part funded by Grant FONDECYT 11100090 from the National Commission for Scientific and Technological Research of the Government of Chile (CONICYT).


 Open access