


I. INTRODUCTION
As the thermal management industry has focused on finding new materials to improve heat dissipation that affects reliability and performance of electronic devices, Al matrix composites (AMCs) have attracted considerable interest due to their low density, high thermal conductivity (TC), and low coefficient of thermal expansion (CTE). Reference Zweben1 However, AMCs manufactured by conventional ex situ processes are economically unfavorable due to expensive reinforcing materials and thermodynamic instability resulting from interfacial reaction between matrix and reinforcements. Reference Zheng, Wu and Reddy2 Thus, in situ fabrication of AMCs with a ceramic second phase such as TiC, Al2O3, and SiC has been investigated for several decades and various processes like self-propagating high temperature synthesis, Reference Li, Kandalova, Nikitin, Makarenko, Luts and Yanfei3 directed melt oxidation, Reference Newkirk, Urquhart, Zwicker and Breval4,Reference Scholz and Greil5 or gas bubbling method Reference Zheng, Wu and Reddy2,Reference Zheng and Reddy6–Reference Hou, Mutharasan and Koczak10 have been developed as a feasible process depending on the formation of ceramic second phase.
Recently, aluminum nitride (AlN) has been considered as an attractive second phase in AMCs due to excellent TC and low CTE. Reference Hou, Mutharasan and Koczak10–Reference Lai and Chung14 Thus, a few scenarios have been proposed to fabricate in situ AMCs with AlN by nitridation of Al melt by gas-melt reaction. Reference Scholz and Greil5,Reference Hou, Mutharasan and Koczak10 For example, as a directed melt nitridation process, Reference Scholz and Greil5 molten Al–(Mg, Si) alloys were heated above 1273 K and held for more than 12 h in nitrogen atmosphere, which promoted the formation of microporous AlN on the surface of molten alloy and outward growth of AlN by continuous wetting of the liquid alloy through the microchannel, resulting in the formation of AMCs with interconnected network of alloy and AlN. Although this process leads to the formation of AMCs with high volume fraction (V p) of AlN above 50 vol%, TC of Al matrix abruptly deteriorates with the addition of alloying elements, Mg and Si. Reference Ho, Ackerman, Wu, Oh and Havill15 And in case of gas bubbling method, nitrogen-bearing gas was injected into Al melt at 1273–1473 K for 1–6 h, but V p of AlN obtained by mainly surface nitridation was less than 10 vol%, Reference Zheng and Reddy7 which is impractical to be applied for heat sinks. Thermal plasma evaporation process utilized high energy of plasma to synthesize AlN and Al–AlN particles within several minutes. Reference Koczak and Premkumar16 In the process, however, in situ formed particles were very small in size (50 nm in diameter) and the particles should be sintered with Al powders to produce bulky Al–AlN composites. Reference Liu, Cong and Cheng11 In sum, although various approaches for fabricating in situ AMCs with AlN by nitridation of Al melt have been proposed, we are still far away from continuous production of in situ Al–AlN composites with attractive thermal properties through cost-effective processing.
In the present study, we report in situ formation of Al–AlN composites via arc plasma-induced accelerated volume nitridation (APAVN) of pure Al melt using N2 gas. In APAVN process, AlN second phase in Al melt was explosively produced by direct reaction between Al melt and dissociated nitrogen and arc plasma-induced ultra-high temperature. Al–AlN composite sheets were successfully fabricated by cold-rolling the as-melted Al–AlN ingots. The distinctive microstructure and thermal properties of the as-rolled composites were systematically characterized. In particular, the formation mechanism and formation kinetics of AlN in newly developed APAVN process were carefully discussed.
II. EXPERIMENTAL
Nitridation of Al (99.999% purity) was performed by arc melting method Reference Suryanarayana and Inoue17 with a constant arc voltage of 20 V and arc current of 150 A. A button-shaped Al ingot (6 g, 20 mm, and 10 mm in weight, diameter, and height, respectively) was prepared by arc melting pure Al pieces under a Ti-gettered Ar atmosphere, and then the ingot, placed on water-cooled copper hearth, was arc melted under a Ti-gettered Ar–N2 mixed atmosphere (2:1 ratio, 99.999% purity, total pressure of 60 kPa), which led to in situ formation of AlN in the Al melt. To minimize evaporation of Al and AlN, arc melting was carefully performed for less than 60 s at a time. Otherwise, Al–AlN ingots become significantly porous and irregular in shape. Reference Etemadi18 The as-melted Al–AlN ingots, which are similar in size to the pure Al ingot, were cold-rolled to a final thickness of 2 mm with a thickness reduction of 10% per pass for fragmentation and dispersion of AlN in Al matrix, resulting in the fabrication of a plate-type specimen with a width of about 20 mm and length of over 100 mm. To fabricate composites with higher fraction of AlN, the as-rolled composites were cut into pieces of about 4 mm in width (or length) and re-melted under a Ti-gettered Ar atmosphere to prepare button-shaped Al–AlN ingots, and then the ingots were melted again under a Ti-gettered Ar–N2 mixed atmosphere for secondary nitridation. Sample size and dimensions can be increased by changing apparatus from laboratory scale (for producing a few grams of alloys) to industrial scale (for producing several tons of alloys). Figure 1 illustrates the sequence of APAVN process fabricating the Al–AlN composite sheets. The whole process in Fig. 1 was repeated up to three times (total nitridation time: 180 s), which is scalable to commercial production.

FIG. 1. Schematic diagram showing processing procedures for the fabrication of the Al–AlN composite sheets via repeated APAVN and cold-rolling process. (a) Nitridation of a button-shaped pure Al ingot by arc melting under Ar mixed atmosphere. (b) Cold-rolling of an as-melted Al–AlN ingot for fragmentation and dispersion of the in situ formed AlN, which led to fabrication of particulate composite sheets. (c) Cutting the as-rolled composites into pieces for re-melting. (d) Re-melting the pieces of the as-rolled composites under an Ar atmosphere to prepare a button-shaped Al–AlN ingot.
Phase constitution was characterized by x-ray diffraction (XRD; New D8 Advance, Bruker Corporation, Karlsruhe, Germany) using monochromatic Cu Kα with a scanning rate of 4 degrees per minute. Microstructures were observed by optical microscope (OM; Eclipse LV 150, Nikon, Tokyo, Japan), scanning electron microscope (SEM; SU70, Hitachi Corp., Tokyo, Japan) and transmission electron microscope (TEM; JEM 2l00F, JEOL Ltd., Tokyo, Japan). Thin foil specimens for TEM observation were prepared by Ar-ion milling using PIPS (Gatan Model 691, Gatan Inc., Pleasanton, California) at 2.7 keV and 5 mA with liquid nitrogen cooling. V p was evaluated from OM and SEM images using image analysis software. Thermal expansion behavior was characterized by thermo-mechanical analyzer (Q400, TA Instruments, New Castle, Delaware) at a heating rate of 5 K/min with sample dimensions of 2 × 2 × 10 mm. Thermal diffusivity was measured by laser flash analysis (LFA 447, NETZSCH Group, Selb, Germany) with sample dimensions of 12.7 × 12.7 × 2 mm. Specific heat was measured using differential scanning calorimetry (DSC 8500, Perkin Elmer, Waltham, Massachusetts) and density was determined by Archimedes' method with an electrical balance (XS204, Mettler Toledo, Greifensee, Switzerland). TC was calculated as a product of thermal diffusivity, specific heat, and density of the composites.
III. RESULTS
A. Microstructure analysis
Figure 2 shows XRD patterns of the as-rolled Al–AlN composites with different nitridation times, which exhibits an Al–AlN dual phase constitution. V p of AlN in composites increased as nitridation time increased, but was saturated around 40 vol% {V p = 40[1−exp(−t N/40)], t N is nitridation time} since molten Al with large fraction of AlN can be overheated by arc melting due to insufficient cooling, Reference Etemadi18 leading to evaporation of Al and decomposition of AlN (T dec = 2627 K at 60 kPa). The composites fabricated by t N = 180 s contained about 40 vol% of AlN, which is the highest value among in situ Al–AlN composites formed by nitridation of pure Al melt using N2 gas as a nitrogen source. Reference Zheng and Reddy7–Reference Hou, Mutharasan and Koczak10 At the maximum V p of AlN, the specific weight gain normalized by t N [=(weight of in situ formed AlN)/(total volume of Al melt × t N)] in APAVN process is 2.94 × 10⁻¹ g/(min cm3), which is about 400 times higher than that in the gas bubbling method Reference Zheng and Reddy7 [6.91 × 10⁻⁴ g/(min cm3)].

FIG. 2. XRD patterns of the as-rolled Al–AlN composites with different nitridation times (t N = 15, 30, 60, 120, and 180 s).
Figure 3(a) shows optical micrograph of the as-rolled Al–40 vol% AlN composites, indicating a typical microstructure of particulate composites. The observed particle distribution analyzed by the quadrat method Reference Karnezis, Durrant and Cantor19 was similar to the Poisson distribution, which indicates homogeneous distribution of AlN particles in Al matrix. The average diameter of the AlN particles (d p) was about 5 μm [Fig. 3(b)]. The particles appeared approximately round-shaped, resulting from surface smoothing of AlN to reduce total free energy during the arc melting. Figure 3(c) shows a high-resolution TEM image of interface between Al matrix and AlN particles with their selected area electron diffraction patterns. The AlN particles were well-bonded to Al matrix without any contaminant or oxide layer since the in situ formation of AlN by arc melting method prevented surface oxidation and improved wettability between Al melt and AlN. In particular, Figs. 3(b) and 3(c) revealed that the AlN particles were completely wet by Al melt with arc plasma-induced ultra-high temperature over 2000 K (measured by pyrometer Reference Etemadi18 or estimated by Al vapor pressure Reference Hatch20 ) despite poor wettability of AlN by Al below 1573 K. Reference Toy and Scott21

FIG. 3. (a) OM image, (b) SEM image, and (c) high-resolution TEM image with selected area diffraction patterns of the as-rolled Al–40 vol% AlN composites.
B. Thermal properties
Figure 4(a) compares CTE of the present Al–AlN composites with those of various reported Al–AlN composites and theoretically predicted values, Reference Liu, Cong and Cheng11–Reference Lai and Chung14 indicating that CTE roughly decreases with increasing V p of AlN (14.6 ± 0.4 ×10⁻⁶ K−1 for 40 vol% AlN). Compared to Turner's model assuming equilibrium of internal stress between particles and matrix [αc = (αm V m B m + αp V p B p)/(V m B m + V p B p)], CTE of the present composites was well matched with Kerner's model assuming volumetric expansion of a spherical particle wet by matrix; Reference Nishida22
 $${{\rm{\alpha }}_{\rm{c}}} = \;{{\rm{\alpha }}_{\rm{m}}}{V_{\rm{m}}} + {{\rm{\alpha }}_{\rm{p}}}{V_{\rm{p}}} + {V_{\rm{p}}}{V_{\rm{m}}}\left( {{{\rm{\alpha }}_{\rm{p}}} - {{\rm{\alpha }}_{\rm{m}}}} \right) \times {{{B_{\rm{p}}} - {B_{\rm{m}}}} \over {{{{V_{\rm{m}}}{B_{\rm{m}}} + {V_{\rm{p}}}{B_{\rm{p}}} + 3{B_{\rm{p}}}{B_{\rm{m}}}} \mathord{\left/ {\vphantom {{{V_{\rm{m}}}{B_{\rm{m}}} + {V_{\rm{p}}}{B_{\rm{p}}} + 3{B_{\rm{p}}}{B_{\rm{m}}}} {4{G_{\rm{m}}}}}} \right. \kern-\nulldelimiterspace} {4{G_{\rm{m}}}}}}}\quad ,$$
where α, V, B, and G represent CTE (23.6 × 10⁻⁶ K−1 for Al and 4.0 × 10⁻⁶ K−1 for AlN), volume fraction, bulk modulus (75.2 GPa for Al and 202 GPa for AlN), and shear modulus (26.2 GPa for Al and 126 GPa for AlN), respectively, and subscripts c, m, and p refer to composites, matrix, and particles, respectively. The correspondence between CTE of the present composites and Kerner's model indicates that the AlN particles introduced a constraint on the thermal expansion of the Al matrix, Reference Chawla23 resulting from their strong interfacial cohesion that was shown by microstructures above [Figs. 3(b) and 3(c)].

FIG. 4. (a) CTE of the present Al–AlN composites compared with that of various reported Al–AlN composites and theoretically predicted values. Reference Liu, Cong and Cheng11–Reference Lai and Chung14 (b) Correlation between TC and ITR in the composites and various ex situ AMCs (V p of second phase is marked with number). Reference Liu, Cong and Cheng11–Reference Zhang, Chen, Wu, Xiu and Luan13,Reference Eesley, Elmoursi and Patel25,Reference Gui, Kang and Euh26 Note that in situ AMCs with AlN nanoparticles showed invalid ITR due to their large oxygen contents and poor interface stability. Reference Liu, Cong and Cheng11
Figure 4(b) shows the correlation between TC and interfacial thermal resistance Reference Hasselman and Johnson24 (ITR) in the present Al–AlN composites and various ex situ AMCs (V p of second phase in the composites is marked with number). Reference Liu, Cong and Cheng11–Reference Zhang, Chen, Wu, Xiu and Luan13,Reference Eesley, Elmoursi and Patel25,Reference Gui, Kang and Euh26 TC of the as-rolled Al–AlN composites was 194 ± 4 W/(m K), 178 ± 4 W/(m K), and 163 ± 5 W/(m K) for the samples with 20 vol%, 30 vol%, and 40 vol% of AlN, respectively. The decrease in TC with increasing V p of AlN can be explained by H–J model, Reference Hasselman and Johnson24 which describes effective TC of particulate composites as follows:
 $${K_{\rm{c}}} = {K_{\rm{m}}}{{\left[ {2\left( {{{{K_{\rm{p}}}} \over {{K_{\rm{m}}}}} - {{{K_{\rm{p}}}} \over {{r_{\rm{p}}}h}} - 1} \right){V_{\rm{p}}} + {{{K_{\rm{p}}}} \over {{K_{\rm{m}}}}} + {{{K_{\rm{p}}}} \over {{r_{\rm{p}}}h}} + 2} \right]} \over {\left[ {\left( {1 - {{{K_{\rm{p}}}} \over {{K_{\rm{m}}}}} + {{{K_{\rm{p}}}} \over {{r_{\rm{p}}}h}}} \right){V_{\rm{p}}} + {{{K_{\rm{p}}}} \over {{K_{\rm{m}}}}} + {{{K_{\rm{p}}}} \over {{r_{\rm{p}}}h}} + 2} \right]}}\quad ,$$
where K, r, and h represent TC, radius of particles, and reciprocal of ITR. TC of composites decreases with increasing V p and decreasing size of particles due to the increase in total interfacial area that acts as a barrier to thermal conduction. In particular, it should be mentioned that in situ AMCs with AlN nanoparticles showed invalid ITR due to poor interface stability by oxide layer. Thus, it is expected that the present composites (d p: 5 μm) exhibit higher TC than AMCs reinforced with in situ formed AlN (d p: 50 nm) fabricated by arc plasma evaporation and hot-pressing. Reference Liu, Cong and Cheng11 ITR of composites is affected by interfacial adherence that can be degraded by the formation of an interfacial gap or a compound layer. Considering that r p, K m, and K p in Eq. (2) are 2.5 μm, 230 W/(m K), and 200 W/(m K), respectively, ITR of the present composites was calculated as 1.5 ± 0.3 × 10⁻⁸ m2 K/W that is similar to that of AMCs produced by pressure-assisted infiltration Reference Couturier, Ducret, Merle, Disson and Joubert12 or squeeze casting, Reference Zhang, Chen, Wu, Xiu and Luan13 and that is about ten times lower than that of plasma-sprayed AMCs, which exhibited poor interfacial bonding such as interfacial gaps or sprayed layer–layer boundaries. Reference Eesley, Elmoursi and Patel25,Reference Gui, Kang and Euh26 The low ITR of the present composites was attributed to strong interfacial bonding between Al and AlN without any interfacial compound layer.
IV. DISCUSSION
Our results demonstrate the feasibility of in situ forming Al–AlN composites by APAVN through arc melting of pure Al with N2 gas. Formation of AlN (Al + N = AlN, ΔH = −322 kJ/mol) is thermodynamically favorable, but oxygen content in N2 gas should be carefully controlled to reduce deleterious effects of oxygen on the nitridation of Al. Reference Zheng, Wu and Reddy2 The addition of Mg in Al alloys is effective to initiate nitridation of Al melt since Mg acts as an oxygen getter Reference Scholz and Greil5 and a catalysis by forming intermediate Mg3N2 phase that reacts with Al (2Al + Mg3N2 → 2AlN + 3Mg). Reference Hou, Mutharasan and Koczak10 However, TC of Al matrix significantly deteriorates with the addition of Mg, Reference Ho, Ackerman, Wu, Oh and Havill15 which reduces applicability of AMCs to heat sink applications. In this study, Al–AlN composites with high V p of AlN (up to 40 vol%) were synthesized within 180 s by newly developed APAVN process of pure Al melt with commercial N2 gas. The formation mechanism and formation kinetics of AlN in APAVN process were carefully discussed and compared with the gas bubbling method where N2 gas is directly injected to Al melt and results in mainly surface nitridation.
A. Evaluation of AlN formation mechanism in APAVN process
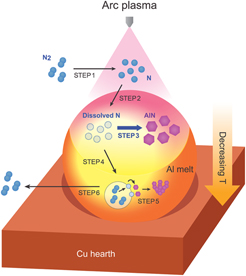
Figure 5 graphically illustrates the detailed AlN formation mechanism in APAVN process. Nitrogen molecules (N2) are dissociated into atomic nitrogen (N) by arc plasma-induced ultra-high temperature (Step 1). Reference Tanaka, Ishizaki, Yumoto, Egashira and Uda27 The dissociated N is dissolved to Al melt through gas-melt interface subjected to elevated temperature over 2000 K Reference Etemadi18,Reference Hatch20 (Step 2). It should be noted that dissolution of the dissociated N into the Al melt is instantaneous due to the absence of activation energy for chemisorption, Reference Lennard-Jones28 while the chemisorption of N2 requires overcoming activation energy barrier (308 kJ/mol) due to the transition from physisorbed state to chemisorbed state. Reference Zheng and Reddy7 Furthermore, solubility of N in Al at 2000 K was estimated to be about 0.3 at%, Reference Boćkowski, Wroblewski, Łucznik and Grzegory29 indicating that dissolution of the dissociated N is thermodynamically favorable at the gas-melt interface. Thus, the arc melting method can be an effective route to dissolve significant amount of N into Al melt and improve wettability, and AlN can be explosively in situ formed at the gas-melt interface and under the interface (Step 3), which leads to volume nitridation of Al. Due to strong temperature gradient of the Al melt cooled by copper hearth, N2 bubbles are recombined at the bottom of the Al melt (Step 4), Reference Tanaka, Ishizaki, Yumoto, Egashira and Uda27 resulting in the formation of AlN particles during the rise of the bubbles in the Al melt with high content of the dissolved N (Step 5). Reference Borgonovo, Apelian and Makhlouf8 The in situ formed AlN in Step 5 exhibited a different morphology compared to the AlN formed in Step 3, which will be discussed in Fig. 6. The bubbles escape from the Al melt due to buoyancy force and N2 molecules are released from the bubbles (Step 6).

FIG. 5. Schematic diagram showing AlN formation mechanism in APAVN process.

FIG. 6. (a) Schematic diagram showing two representative AlN morphologies formed in an as-melted Al–AlN ingot via APAVN process. SEM images of (b) plate-shaped AlN with rods (upper part of the ingot) and (c) agglomeration of AlN particles (bottom part of the ingot) after nitridation time of 60 s in APAVN process.
Figure 6(a) shows schematic diagrams for two representative AlN morphologies formed by APAVN process (Step 3 and Step 5 in Fig. 5). First, AlN synthesized in Step 3 exhibited the form of plates with large area [Fig. 6(b)], which is a typical morphology of AlN formed at the surface of Al melt. Thickness of the plates was close to 5 μm that is larger than that of AlN layer (350 nm) formed on surface of liquid Al under N2 atmosphere at 973 K, Reference Kim, Noh, Ahn, Lee, Kwon, Lee, Yang and Lee30 indicating that the formation of thicker AlN plates with large area (>100 μm in diameter) was favorable in APAVN process. During arc melting, the in situ formed plates sank to the bottom of the Al melt due to the difference in their density (2.7 g/cm3 for Al and 3.3 g/cm3 for AlN), and improved wettability between AlN and Al melt by arc plasma-induced ultra-high temperature that resulted in continuous wetting of the Al melt through surface of the AlN plates. Consequently, new plates were synthesized at the gas-melt interface, which led to stacking of the AlN plates in the whole Al melt. Simultaneously, AlN rods appeared to grow from the plates toward the gas-melt interface [Fig. 6(b)]. The unidimensional growth of AlN can be explained by vapor–liquid–solid growth mechanism Reference Wagner and Ellis31 in which supersaturation of liquid Al by N promotes anisotropic crystal growth of AlN from the plates. Reference Liu, Hu, Wu, Wang, Chen, Sang, Zhu, Deng and Xu32 The supersaturation may result from delayed convection of the Al melt between the pre-stacked plates where the dissolved N was locally enriched. Second, AlN synthesized in Step 5 exhibited the form of agglomerates of small AlN particles (d p < 2.5 μm) [Fig. 6(c)]. Growth of the agglomerates was initiated from AlN nuclei, formed at the interface between Al melt and N2 bubble, Reference Hou, Mutharasan and Koczak10 toward the gas-melt interface due to the gradient of dissolved N. The appearance of the agglomerates was similar to that of the surface of nitrided Al powder at the temperature below 1273 K, Reference Kim, Noh, Ahn, Lee, Kwon, Lee, Yang and Lee30,Reference Radwan and Bahgat33 indicating limited growth of AlN crystals due to the relatively low temperature.
B. Comparison of AlN formation rate between APAVN process and gas bubbling method
Since the AlN formation rate (θAlN) in the gas bubbling method was evaluated by considering concentration and diffusion of the dissolved N in Al melt, Reference Zheng and Reddy6,Reference Borgonovo, Apelian and Makhlouf8 the predominance of N diffusion in this study was investigated by determining concentration profiles. The diffusion of N in Al melt was estimated by Fick's second law as follows:
 $${{\partial {C_{\rm{N}}}} \over {\partial t}} = {D_{\rm{N}}}{{{\partial ^2}{C_{\rm{N}}}} \over {\partial {x^2}}}\quad ,$$
where C is concentration (in moles per liter), and D N is diffusivity of N in Al melt as follows:
 $${D_{\rm{N}}} = {D_0} \;{\rm{exp}}\left( { - {{{E_{\rm{N}}}} \over {R{T_{\rm{l}}}}}} \right)\quad ,$$
where D 0 is pre-exponential constant, 3.75 × 10⁻⁷ m2/s, and E N is activation energy for N diffusion, 26.47 kJ/mol. Reference Zheng and Reddy6 R is gas constant and T l is temperature of Al melt. With boundary conditions (at x = 0, C N = C N,i and at x = ∞, C N = 0), Eq. (3) yields the following solutions:
 $${C_{{\rm{N,}}x}} = {C_{{\rm{N,}}i}}\left( {1 - {\rm{erf}}\left( {{{{x_{\rm{N}}}} \over {2\sqrt {{D_{\rm{N}}}{t_{\rm{N}}}} }}} \right)} \right)\quad ,$$
where x N and t N are diffusion length and time of N, respectively. C N,x and C N,i are concentration of N at the distance x from the gas-melt interface and at the gas-melt interface, respectively. C N,i was evaluated as follows:
 $${C_{{\rm{N,}}i}} = k{C_{{\rm{N,}}g}}\quad ,$$
where k and C N,g are dimensionless Henry's law constant and concentration of nitrogen gas in chamber, respectively. C N,g was evaluated as follows, assuming that the gas obeys ideal gas law (PV = nRT):
 $${C_{{\rm{N,}}g}} = {{{P_{\rm{N}}}} \over {R{T_{\rm{N}}}}}\quad ,$$
where P N and T N refer to partial pressure and temperature of nitrogen gas. Figure 7 shows the diffusion profiles of the dissociated N in Al melt for APAVN process, calculated using Eqs. (3)–(7) with an assumption that D N is constant since AlN is dominantly formed at the gas-melt interface where C N,i and T l are constants, which were compared against those of N2 gas for the gas bubbling method. Reference Zheng and Reddy7 Although P N of APAVN process (0.2 atm) was lower than that of the gas bubbling method (1.0 atm), APAVN process exhibited higher C N,i (9.22 × 10⁻⁴ mol/L) than the gas bubbling method (1.65 × 10⁻⁴ mol/L) Reference Zheng and Reddy7 due to the difference in k in Eq. (6). In APAVN process, the k can be assumed as 1 since dissociated N by arc plasma is instantaneously dissolved into Al melt without overcoming activation energy (Step 2 in Fig. 5). In the gas bubbling method, the k was estimated as 1.99 × 10⁻² at 1473 K that was derived from the solubility of N in Al. Reference Wriedt34 θAlN in the gas bubbling method was calculated by the equation, θAlN = a D N 0.5 C N,i (a is constant) since the formation of AlN occurs mainly at the gas-melt interface and C N is much smaller than C Al in Al melt (surface nitridation). Reference Zheng and Reddy6 Based on the same assumption, θAlN in the APAVN process was calculated to be about ten times higher than that in the gas bubbling method since T N was higher over 1000 K, and C N,i was about 5.6 times greater. However, it was insufficient to explain about 400 times higher specific weight gain normalized by t N in the APAVN process compared to that in the gas bubbling method. Compared to the gas bubbling method, where N2 bubbles escape from Al melt within a few seconds, the dissociated N in the APAVN process is continuously supplied to Al melt during arc melting, resulting in volume nitridation as explained in Fig. 6(b). Therefore, the higher V p of AlN in the APAVN process can be rationalized by unique volume nitridation due to increased C N,i from the instantaneous chemisorption of the dissociated N, increased C N,x from the enhanced N diffusion in Al melt, and improved wettability between AlN and Al melt.

FIG. 7. Diffusion profiles of N in Al melt for APAVN process compared with those for gas bubbling method. Reference Zheng and Reddy7
C. Manipulation of thermal properties via APAVN process
Figure 8 shows specific TC of the as-rolled Al–AlN composites via APAVN process compared with various pure metals, ceramics, and AMCs as a function of CTE. Reference Liu, Cong and Cheng11–Reference Zhang, Chen, Wu, Xiu and Luan13,Reference Eesley, Elmoursi and Patel25,Reference Gui, Kang and Euh26 When it comes to materials choice for heat sink applications, the density is a major consideration. Reference Ashby, Shercliff and Cebon35 Late transition metals such as Mo and W are well known for their high TC with low CTE, but their high density limits their use. The as-rolled Al–AlN composites exhibit a unique combination of higher specific TC and lower CTE than in situ Al–AlN nanocomposites Reference Liu, Cong and Cheng11 or plasma-sprayed AMCs, Reference Eesley, Elmoursi and Patel25,Reference Gui, Kang and Euh26 which can be manipulated by controlling V p as well as the size of AlN. Furthermore, ITR of Al–AlN interface, prepared by sputtering of Al on AlN single crystal in vacuum, was 4.3 × 10⁻⁹ m2 K/W, Reference Stevens, Smith and Norris36 indicating that TC of the present composites can be further improved by optimizing processing parameters to reduce ITR. Consequently, the present Al–AlN in situ composites formed by APAVN process exhibit an attractive combination of higher specific TC and lower CTE as well as reduced materials cost; therefore, it seems promising for heat sink applications, especially for portable electronic devices.

FIG. 8. Correlation between specific TC and CTE of the Al–AlN composites fabricated via APAVN process in relation to various metals, ceramics, and AMCs. Reference Liu, Cong and Cheng11–Reference Zhang, Chen, Wu, Xiu and Luan13,Reference Eesley, Elmoursi and Patel25,Reference Gui, Kang and Euh26
V. CONCLUSIONS
The present study shows the in situ synthesis of Al–AlN composites with attractive thermal properties via APAVN process. APAVN resulted from the instantaneous chemisorption of the dissociated N, enhanced diffusion of the dissolved N in Al melt and improved wettability between AlN and Al melt, which led to higher AlN formation of ∼2.94 × 10⁻¹ g/(min cm3) that is about 400 times higher than that in the gas bubbling method [6.91 × 10⁻⁴ g/(min cm3)]. Thus, within a few minutes of repeated APAVN under commercial N2 gas, volume fraction of AlN increased up to 40 vol%, which is the highest value ever reported by in situ nitridation of pure Al melt using high-purity N2 gas. The composites contained homogeneously dispersed AlN particles with strong interfacial bonding and low ITR, which resulted in a unique combination of a relatively low CTE (14.6 ± 0.4 × 10⁻⁶ K−1) and high TC [163 ± 5 W/(m K)]. Our current finding gives us a guideline on how to design a simple process for continuous production of in situ Al–AlN composite sheets with tailor-made thermal properties for heat sink applications.
Supplementary Material
To view supplementary material for this article, please visit https://doi.org/10.1557/jmr.2016.422.
ACKNOWLEDGMENTS
The author's work in this area was supported by the National Research Foundation of Korea (NRF) grant funded by the Korean government (Ministry of Science, ICT and Future Planning) (No. 2014K1A3A1A20034841 & 2014M3C1A8053728). One of the authors (E.S. Park) was also benefited from the Center for Iron and Steel Research at Seoul National University.


 Open access