


INTRODUCTION
The open-cast lignite mine of Schöningen, situated in east Lower Saxony, Germany (Fig. 1A), is well known for its late Quaternary sequence that spans the last ca. 500 ka. It contains an outstanding archive of floral and faunal data that reflect climate and human evolution. It has also yielded the world's oldest Lower Paleolithic wooden hunting weapons (Mania and Mai, Reference Mania and Mai2001; Thieme, Reference Thieme and Thieme2007; Urban, Reference Urban, Sirocko, Claussen, Sanchez Goni and Litt2007a; van Kolfschoten Reference van Kolfschoten2014; Böhme, Reference Böhme, Terberger and Winghart2015; Urban and Bigga, Reference Urban and Bigga2015; Serangeli et al., Reference Serangeli, Rodríguez-Alvarez, Tucci, Verheijen, Bigga, Böhner, Urban, van Kolfschoten and Conard2018; Conard et al., Reference Conard, Serangeli, Bigga and Rots2020). These well-preserved weapons were found in the youngest parts of a long middle Pleistocene lacustrine sediment record, the Reinsdorf sequence, which is unconformably intercalated between Elsterian and Saalian glacial deposits (Urban, Reference Urban1995). Mania (Reference Mania1998, Reference Mania and Thieme2007a, Reference Mania and Thiemeb) proposed a model of six superimposed sequences of climatically induced large-scale fluvial erosional channels (I–VI) overlying the Elsterian till. The older interglacial deposits (channel I and channel III), unconformably overlying Elsterian till and meltwater deposits from the northern mining area, have been assigned to the Holsteinian and Schöningen interglacials, respectively (Fig. 1B) (Urban et al., Reference Urban, Lenhard, Mania and Albrecht1991a; Urban, Reference Urban and Thieme2007b).
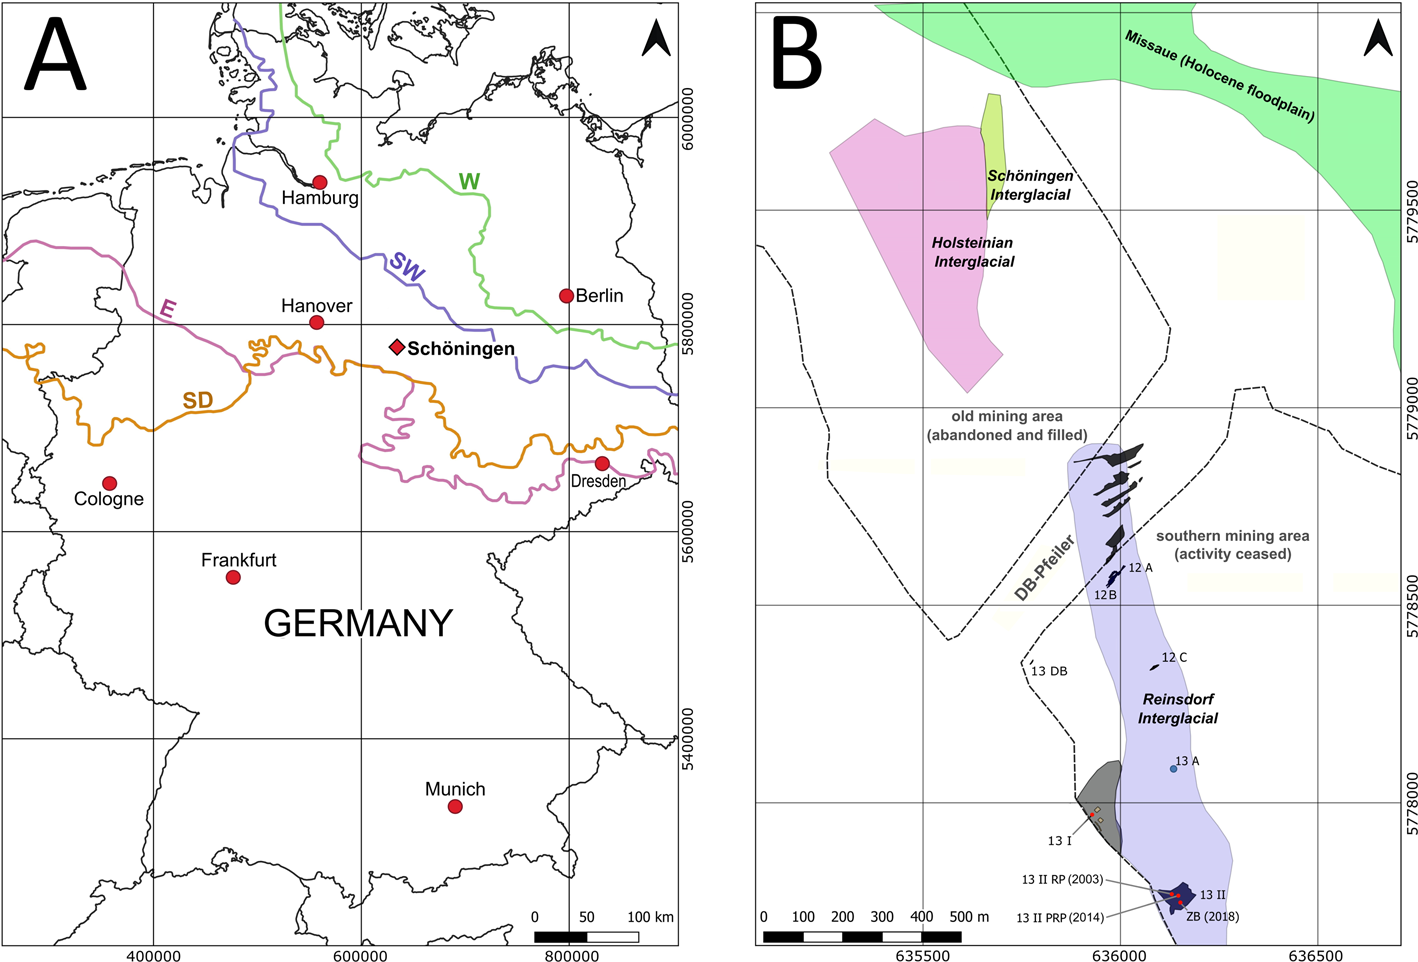
Figure 1. (A) Location of Schöningen in northern Germany and maximum extent of ice sheets (colored lines: Elsterian = E; Saalian Drenthe Stage = SD; Saalian Warthe Stage = SW; Weichselian = W). (B) Map of the northern and southern mining areas with the location of important Paleolithic sites (abbreviated with Arabic and Latin numerals or letters: e.g., 13 II, 12 A). Colored areas reflect the spatial distribution of Middle Pleistocene interglacial and Holocene deposits of the Schöningen open cast mine. The name DB-Pfeiler refers to the train tracks that separated the northern and the southern pits of the mine until 2008, when the Quaternary overburden was removed for coal mining (modified after Urban and Bigga, Reference Urban and Bigga2015; Tucci et al., Reference Tucci, Krahn, Richter, van Kolfschoten, Rodríguez Alvarez, Verheijen, Serangeli, Lehmann, Degering, Schwalb and Urban2021; original map established by U. Böhner, Niedersächsisches Landesamt für Denkmalpflege [NLD], Hanover).
Based on paleobiological and chronometric data, the Reinsdorf interglacial sequence of sites Schöningen 12 and 13 (channel II), situated in the southern part of the lignite mine (Fig. 1B), was correlated with Marine Isotope Stage (MIS) 9 (Urban, Reference Urban1995; Sierralta et al., Reference Sierralta, Frechen, Urban and Behre2012, Reference Sierralta, Urban, Linke and Frechen2017; van Kolfschoten, Reference van Kolfschoten2012b, Reference van Kolfschoten2014; Richter and Krbetschek, Reference Richter and Krbetschek2015; Urban and Bigga, Reference Urban and Bigga2015; van Kolfschoten et al., Reference van Kolfschoten, Buhrs and Verheijen2015a; Kunz et al., Reference Kunz, Urban and Tsukamoto2017). Tucci et al. (Reference Tucci, Krahn, Richter, van Kolfschoten, Rodríguez Alvarez, Verheijen, Serangeli, Lehmann, Degering, Schwalb and Urban2021) have recently confirmed this correlation with new OSL age determinations, which yielded an age of ca. 300 ka for the post-interglacial sediment layer Schöningen 13 II-2c3, corresponding to the archaeological horizon of site 12 A (Urban and Sierralta, Reference Urban, Sierralta and Behre2012) (Fig. 1B). Peat and marl deposits of the Schöningen interglacial (channel III) have been assigned to the Dömnitz interglacial and correlated with MIS 7 (Erd, Reference Erd1973; Urban et al., Reference Urban, Lenhard, Mania and Albrecht1991a; Heijnis, Reference Heijnis1992). Channel IV (after Mania and Altermann, Reference Mania, Altermann, Terberger and Winghart2015) consists of a pedocomplex of gleyed alluvial loess overlying older Saalian till (Drenthe Stage) (Fig. 1A). Eemian and early Weichselian limnic-telmatic and loess-born soil horizons of channel V are equivalent to MIS 5e–5d (Urban et al., Reference Urban, Elsner, Hölzer, Mania and Albrecht1991b; Heijnis and Urban, Reference Heijnis and Urban1995). Loess and solifluction layers, as well as fluvial deposits, are then correlated with MIS 4.
A different model of deposition and age of the three interglacial-glacial infillings between Elsterian and Saalian glacial sediments was proposed by Lang and Winsemann (Reference Lang, Winsemann and Behre2012) and Lang et al. (Reference Lang, Winsemann, Steinmetz, Polom, Pollok, Böhner, Serangeli, Brandes, Hampel and Winghart2012, Reference Lang, Böhner, Polom, Serangeli and Winsemann2015a, Reference Lang, Böhner, Brandes, Hampel, Polom, Serangeli, Steinmetz, Winghart, Winsemann, Terberger and Winghartb). Based on geological mapping, borehole logs, and geophysical data, these authors interpreted the Middle Pleistocene sequences as infills of a subglacial tunnel valley that was formed during the Elsterian glaciation. Channels I, II, and III (Mania, Reference Mania, Thieme and Maier1995, Reference Mania and Thieme2007a, Reference Mania and Thiemeb) were explained as major unconformities within a paleo-delta, and interglacial deposits of the Reinsdorf and the Holsteinian were considered to date from the same interglacial. Lang and Winsemann (Reference Lang, Winsemann and Behre2012) and Lang et al. (Reference Lang, Winsemann, Steinmetz, Polom, Pollok, Böhner, Serangeli, Brandes, Hampel and Winghart2012, Reference Lang, Böhner, Polom, Serangeli and Winsemann2015a, Reference Lang, Böhner, Brandes, Hampel, Polom, Serangeli, Steinmetz, Winghart, Winsemann, Terberger and Winghartb) further stated that the Schöningen interglacial is lacking chronometric ages, being evinced only by palynological results. However, uncorrected ages of 180 ka and 227 ka had already been published by Heijnis and Urban (Reference Heijnis and Urban1995). Other authors assigned the Reinsdorf sequence as a local palynological variant of the Holsteinian interglacial (Litt et al., Reference Litt, Behre, Meyer, Stephan, Wansa and Litt2007; Bittmann, Reference Bittmann2012; Meyer, Reference Meyer and Behre2012), which they correlated with MIS 9.
In a first composite profile of the Reinsdorf sequence, which was exposed during the excavation campaigns of site Schö 13 II, Urban (Reference Urban, Sirocko, Claussen, Sanchez Goni and Litt2007a, Reference Urban and Thiemeb) described several post-interglacial climatic oscillations and termed them stadial and interstadial. This initial subdivision of these post-interglacial oscillations, which are characteristic of forested warmer and colder, open-woodland and steppe periods, respectively, during a glacial period was revised, and the climatic variations interpreted as late phases of one interglacial cycle (Urban and Bigga, Reference Urban and Bigga2015). New results from aquatic and terrestrial analyses of the Reinsdorf sequence, however, confirm initial post-interglacial temperature and precipitation decreases with steppe vegetation followed by two phases of temperature and precipitation increases, marking the transition into the succeeding glacial (Krahn et al., Reference Krahn, Tucci, Urban, Pilgrim, Frenzel, Soulié-Märsche and Schwalb2021; Tucci et al., Reference Tucci, Krahn, Richter, van Kolfschoten, Rodríguez Alvarez, Verheijen, Serangeli, Lehmann, Degering, Schwalb and Urban2021).
This paper provides an overview of environmental proxy data employed in the detailed reconstruction and dating of the Middle Pleistocene interglacial-glacial Reinsdorf sequence within the Schöningen lignite-mine sediments. These results then are applied to a visualized landscape portrayal of important component phases of vegetation and climate in relation to archaeological evidence of human occupation and activity.
MATERIAL AND METHODS
Site Description
The town of Schöningen is located ~100 km east of Hanover in northern Germany at the south-eastern edge of the Muschelkalk limestone ridge of the Elm mountain range (Fig. 1A). A narrow, 70-km-long salt structure, the Stassfurt-Helmstedter salt wall, runs in a northwest-southeast direction within the northeastern area of the Schöningen lignite mine (Brandes et al., Reference Brandes, Pollok, Schmidt, Wilde and Winsemann2012). The Eocene lignite seams, formed in the western rim syncline of the Helmstedt-Staßfurt salt dome, are overlain by 45-m-thick Quaternary deposits (Fig. 1B). The ~6- to 8-m-thick limnic deposits of the Reinsdorf sequence at site 13 II discordantly overlie Elsterian glacial sediments and are generally unconformably covered by till, sands, and basin silts of the Drenthe and loess of the Warthian stadium of the Saalian glaciation (Mania and Altermann, Reference Mania, Altermann, Terberger and Winghart2015). The Reinsdorf sediment sequence II-1 to II-5 is composed of limnic-telmatic deposits that show a serial development from open water to reedswamp or fen woodland (Fig. 2).

Figure 2. Scheme of the Reinsdorf sediment sequence (levels II-1 to II-5) discordantly overlying Elsterian glacial sediments. Legend: 1: till, gravel, and fluvioglacial sediments (Elsterian); 2: sand; 3: basin silt; 4: silty and calcareous mud; 5: ice wedges; 6: solifluction layers; 7: organic mud, detritus, and peat (black) (after Urban et al., 2011).
The present-day climate of the Schöningen area is characterized by an average annual mean air temperature of 9.6°C, a mean coldest month (January) temperature of 0.7°C, and a warmest month (July) temperature of 18.8°C (DWD, 2003–2019, station 5158 Ummendorf). The annual mean precipitation is 595 mm (DWD, 2003–2019, station 662 Braunschweig).
Sampling for sedimentological, geochemical, palynological, and charophyte analysis and vertebrate faunal remains
In close vicinity to the 10.25-m-thick sediment profile of the Reinsdorf 13 II sequence exposed in 2003 at archaeological site Schöningen 13 II, which was designated as the reference profile for the sediment units of this sequence (Thieme, Reference Thieme and Thieme2007), a new and more complete composite profile has been investigated. It is composed of the Para-Reference Profile (PRP) 13 II (2014), consisting of sub-sublevel 13 II-1a2 through II-4e1, and a short profile from Zeugenblock (ZB) 13 II (2018) comprising sublevel 13 II-4c through II-5c3 (Fig. 3, left, middle, and right). The local coordinates are presented in Supplementary Figure 1; coordinates of archaeological site 13 II are listed in the caption of Figure 3. The designation of the profiles (i.e., levels) follows Mania (Reference Mania1998), Böhner et al. (Reference Böhner, Fricke, Mania and Thieme2005), and Urban and Bigga (Reference Urban and Bigga2015) (13 = archaeological site, II = channel/climatic cycle) and subdivisions (level: II-1 to II-5, bottom up; sublevel: e.g., II-1a; sub-sublevel: e.g., II-1a1, top down).

Figure 3. Left: archaeological site Schöningen 13 II (56°07′59″N, 10°59′19″E) and position of the Para-Reference Profile PRP 13 II (2014) comprising levels 13 II-1 to II-4 (II-5 not exposed at this part of the site). Middle: subdivision of the Reference Profile (2003) into sublevels (e.g., 13 II-1a) and sub-sublevels (e.g., 13 II-4e1) (Urban and Bigga, Reference Urban and Bigga2015). Right: staggered profile of the Zeugenblock (2018) with the studied sublevels II-4ab to II-5d1 indicated.
Samples for palynological, sedimentological, and geochemical analyses were taken using 25 × 7 × 5 cm steel boxes at four different exposures with a total sediment thickness of ~6.3 m. Samples for pollen were taken generally at 1 cm intervals, for gyrogonite analyses down to 1-cm intervals depending on (sub-)sublevel and preservation, and for geochemical analysis at ~2- to 4-cm intervals, depending on the structure of the particular sediment unit. For determination of dry bulk density, steel rings 5 cm long and 5 cm in diameter (98 cm3) were pushed into the profiles using a hammer and guiding cylinder to collect undisturbed samples of all sedimentary layers.
Large mammal remains were collected during the ongoing archaeological excavations. Special trips to collect small vertebrate faunal remains from the different outcrops at Schöningen have been undertaken since 1992 (van Kolfschoten, Reference van Kolfschoten and Behre2012a). Sediment samples with an area of 1 m2 and a maximum thickness of 10 cm were taken from specific layers. These sediment samples were fractionated by water screening using a set of sieves, the smallest one with a mesh of 1 mm. The sediment residues were dried and sorted with the use of a binocular microscope for the smaller fractions.
Sedimentological, geochemical, palynological, and Charophyte gyrogonite analysis
The profiles have been described using field methods for assessing texture (Ad-hoc-Arbeitsgruppe Boden, 2005). Color was determined according to the Munsell Soil Color Charts (Munsell Color, 2010), and carbonate content was tested with 30% HCl. Organic matter (OM) content was estimated by combining color, texture, and macroscopically visible plant remains. Occurrences of mollusks, pebbles, etc. were also noted (Supplementary Table 1).
For further classification of the lithologically described lacustrine sediment types and to standardize the nomenclature of the various sedimentary units, the geo-ecological approach of Succow and Joosten (Reference Succow and Joosten2001), which is based on the measured parameters OM, texture, and carbonate, has been applied. To be classified as a mud, the limnic sediment must contain at least 5% OM. A calcareous mud is characterized by CaCO3 contents of between 30–95%, <70% of minerogenic particles, and an OM content of 5–30%. The organic muds were determined by possessing an OM content of >30% independent of the amounts of carbonates or other minerogenous remains. If the minerogenous amount lays between 30–95%, the OM between 5–30%, and the CaCO3 amount was <30%, the sediment was considered to be sandy, siliceous (silty), or clayey mud.
The texture was analyzed using a combination of a sedimentation method for clay and silt (Retsch Lumosed, Köhn-sedimentation) and a dry sieving method for sand. Samples were prepared by removing carbonates with HCl and organic matter with H2O2. After these analyses, samples were classified following the German soil mapping instructions (Ad-hoc-Arbeitsgruppe Boden, 2005). Dry bulk density was analyzed following the DIN EN ISO 17892-2 method. The sediment within the steel rings of known volume was dried at 105°C and weighed. Total organic carbon (TOC) and total nitrogen (TN) contents were determined from a set of 98 samples using a CHNS/O elemental analyzer (Perkin Elmer 2400 Series II CHNS/O) after removal of carbonates using 37% HCl. Organic matter was calculated from the TOC% content (OM% = TOC% × 1.72). From TOC and TN contents, the molar TOC/TN ratio was calculated. Carbonate content was analyzed by gasometric determination with the Scheibler apparatus and soluble salts were analyzed by electrical conductivity (EC) according to VDLUFA (1991). The pH values of the samples were analyzed in a 1:2.5 0.01 M CaCl2 solution of 60°C dried soil using a glass electrode. Elemental analysis was carried out on 113 dried (60°C) and ground samples using an X-ray fluorescence spectrometer (Bruker S2 PICOFOX). Resulting semi-quantitative elemental net counts of Al, Si, S, K, Ca, Ti, and Fe were used to calculate centered-log ratios (‘clr’) to overcome matrix effects. Further, these ‘clr’ have shown to correlate well with quantitative elemental data (Spofforth et al., Reference Spofforth, Pälike and Green2008; Weltje and Tjallingii, Reference Weltje and Tjallingii2008; Weltje et al., Reference Weltje, Bloemsma, Tjallingii, Heslop, Röhl, Croudace, Croudace and Rothwell2015; Ramisch et al., Reference Ramisch, Tjallingii, Hartmann, Diekmann and Brauer2018; Kasper et al., Reference Kasper, Wang, Schwalb, Daut, Plessen, Zhu, Mäusbacher and Haberzettl2021). Elements showing a large signal-to-noise ratio, and thus exhibiting very low net counts, were regarded as not robust and omitted from further consideration; this was only the case for Al. Log-ratios were also calculated for certain elements (Weltje et al., Reference Weltje, Bloemsma, Tjallingii, Heslop, Röhl, Croudace, Croudace and Rothwell2015; Ramisch et al., Reference Ramisch, Tjallingii, Hartmann, Diekmann and Brauer2018). All analyses were carried out in the soil laboratory at the Institute of Ecology at Leuphana University of Lüneburg.
In order to detect correlations between applied organic and inorganic proxies, a principal component analysis (PCA) was performed with 11 input variables: pH, CaCO3, soluble salts, TOC, TN, Si, S, K, Ca, Ti, and Fe. Since sampling intervals for the wide spectrum of analyses were different, all proxies were downsampled to the coarsest interval. Input variables were z-transformed prior to the PCA, which was performed using the software package OriginLab Pro (V. 2019b 9.65).
For palynological sample preparation, standard methods including carbonate removal by 10% HCl, dispersion with 10% KOH, floatation using sodium polytungstate hydrate (3Na2WO4 ⋅ 9WO3 ⋅ H2O) and acetolysis to dissolve cellulose were applied (Fægri and Iversen, Reference Fægri and Iversen1989; Moore et al., Reference Moore, Webb and Collins1991). Five tablets of Lycopodium spores were added to each sample at the beginning of the preparation to calculate sporomorph concentration (Stockmarr, Reference Stockmarr1971). Residues were embedded in glycerin. Slides (24 × 32 mm) were analyzed under a transmitted light microscope for pollen and non-pollen palynomorphs at 40× magnification. Fægri and Iversen (Reference Fægri and Iversen1989), Moore et al. (Reference Moore, Webb and Collins1991), and Beug (Reference Beug2004) were used for palynomorph identification keys and illustrations.
The pollen sum, on which percentages of all taxa are based, is composed of terrestrial taxa (arboreal [AP] and non-arboreal pollen [NAP]). Taxa from aquatic plants, Cyperaceae, Ericaceae, and cryptogams were excluded from this sum. Pollen percentages and concentrations were computed and graphed using the software package TILIA (Grimm, Reference Grimm1990). Stratigraphically constrained cluster analysis (CONISS) (Grimm, Reference Grimm1987) assisted description and interpretation of the pollen diagrams.
For charophyte gyrogonite analysis, ninety-one samples of sequence Para-Reference Profile (PRP) 13 II (2014) and Zeugenblock (ZB) 13 II (2018) were processed. Between ~2−8 g of sediment per sample were immersed overnight in ~4% H2O2 to remove the organic matter and sieved through 250 µm. Subsequently, gyrogonites of charophytes were separated from the dried sediments and counted.
Identification of the mammalian remains and flora and fauna habitat reconstruction
The comparative collection of vertebrate skeletons stored at the Faculty of Archaeology, Leiden University (The Netherlands), combined with information from the extensive literature on the identification of various taxa (Guérin, Reference Guérin1980), was used to analyze the mammalian assemblages from the different (sub)horizons.
The botanical macro-remain data of Jechorek (Reference Jechorek1997, Reference Jechorek2000) and Jechorek et al. (Reference Jechorek, Czaja, Mai and Thieme2007), established for the main sedimentation cycles (II-1, II-2, II-3, and II-4), were based on rather low-resolution sampling and were, therefore, calibrated by the high-resolution palynological data on sublevels and sub-sublevels according to the “ecological excluding procedure” (e.g., macro remain evidence of Tilia for entire layer II-2 samples resulted in the exclusion of Tilia for levels II-2c3–2c1; Urban, Reference Urban, Sirocko, Claussen, Sanchez Goni and Litt2007a; Urban and Bigga, Reference Urban and Bigga2015) as well as based on more recent macro-remain data of higher resolution (Bigga, Reference Bigga2018).
The palynological and botanical macro-remain data published by Jechorek (Reference Jechorek2000), Urban and Sierralta (Reference Urban, Sierralta and Behre2012), Urban and Bigga (Reference Urban and Bigga2015), Bigga (Reference Bigga2018), Tucci et al. (Reference Tucci, Krahn, Richter, van Kolfschoten, Rodríguez Alvarez, Verheijen, Serangeli, Lehmann, Degering, Schwalb and Urban2021), and this paper, were then combined with records of faunal elements—compiled in van Kolfschoten (Reference van Kolfschoten2014), van Kolfschoten et al. (Reference van Kolfschoten, Buhrs and Verheijen2015a), and Serangeli et al. (Reference Serangeli, Böhner, van Kolfschoten and Conard2015)—to establish plausible ecological characterizations and hypotheses concerning possible paleoenvironments and fauna-flora interactions. For this purpose, the recorded species were evaluated and related to each other, both on the basis of literature commonly used for species identification and characterization in Germany (Stresemann, Reference Stresemann1995; Ellenberg, Reference Ellenberg2001; Ellenberg and Leuschner, Reference Ellenberg and Leuschner2010; Schaefer, Reference Schaefer2010; Rothmaler, Reference Rothmaler2017), as well as on the basis of the most relevant scientific publications naming species or their recent relatives in title or abstract and concerning their aut- and synecology. The derived ecological characteristics of flora and fauna were summarized and integrated into scenarios of conceivable paleoecosystems.
3D landscape images
Current topographical and historical maps (1877–1912) and aerial photos provided by the GeoLife.de Navigator (https://www.geolife.de/index.php) served as the data basis for the creation of the landscape reconstructions. Using the information from these sources, an attempt was made to reproduce the current morphology of the investigated area in a generalized manner. This relief model provides the base map for all images. In the next step, the information for the images was expanded by including reconstructions of the time slice of Local Pollen Assemblage Zone RP5 at archaeological site Schö 13 II-4 (Urban and Bigga, Reference Urban and Bigga2015) and by the reconstructed top of the calcareous muds of sublevel 13 II-4c by Böhner et al. (Reference Böhner, Serangeli and Richter2015). The graphical representation obtained this way served as the basis for all reconstructions. In these, the dimensions of the lake, lake-level fluctuations, and possible inflows were adapted to the respective assumed climatic and environmental conditions.
RESULTS
Physical and geochemical properties and classification of the lacustrine sediments
The lacustrine composite profile of the Para-Reference Profile 13 II (2014) and Zeugenblock 13 II (2018) sequence consists of five main levels (II-1 to II-5) and 27 (sub)-sublevels, respectively, that are indicative of the depositional environment of the paleolake. The sedimentary record is lithologically characterized by alternating layers of calcareous organic muds and organic, carbonate-free, and silty and sandy muds (Supplementary Table 1).
The entire profile is composed mainly of silty deposits (81% on average), which is typical for lacustrine environments (Fig. 4). Major changes in the particle size are visible between sub-sublevel 2c4 and 2c2 (97.65–98.58 m asl) and at the base of 2bc (99.185 m asl), where large proportions of sand (up to 83.2%) characterize both sections. Furthermore, between sub-sublevel 3ab and 4f (100.2–100.87 m asl), silt contents are reduced in favor of clay contents, reaching maximum values of 24.5%. Slightly elevated clay amounts of ~14% are also visible at the base of the profile (II-1a2 = 97.065 m asl), within sub-sublevel 2c1 (98.665 m asl), and between 2bc and 3bc (99.375–99.56 m asl). Generally, low amounts of TOC (~5%) and TN (~0.4%) characterize the profile. However, within 2bc and 3bc, high contents (up to 35.7% TOC and 5.2% TN) are reached, which slowly and steadily decline up to the top of 4e3 (101.96 m asl; Fig. 4). Within sub-sublevel 4ab (Zeugenblock) a minor peak of both TOC and TN is again notable. The C/N ratio shows a similar pattern; however, the ratio is highly variable prior to the transition to sublevel 2bc (Fig. 4).

Figure 4. Contents of grain-size fractions of clay (red), silt (green), and sand (yellow), pH [CaCl2], soluble salts, CaCO3 (compared to XRF-derived Ca; see Fig. 5), TOC (and organic matter = OM), TN, and the molar TOC/TN ratio of the Para-Reference Profile PRP 13 II (2014) and Zeugenblock 13 II (2018).
Values of pH range between 0.74–7.44, with rather low acidic values (0.74–2) present at the base of the profile (minimum), at the base of 2bc (99.185 m asl), between 3b1 and 3ab (100.135–100.275 m asl), within 4e3(c3?), and in 4ab (Zeugenblock) (Fig. 4). Notably elevated soluble salt amounts (up to 12.9%) were detected at the base of the profile and at the base of sub-sublevel 2bc (Fig. 4). CaCO3, Ca(clr), and the Ca/Ti ratio show corresponding patterns throughout the sequence with moderately elevated values between 2c4 and the middle section of 2c1 (97.65–98.875 m asl), whereas rather high amounts are reached within 3bc (99.56 m asl) and 3b2 (99.72 m asl), each showing a sharp peak. High contents are also notable between 4i and 4e3(c3?) (100.27–101.18 m asl), with a minor negative excursion in between and within 4c (101.41–101.74 m asl; Zeugenblock) (Fig. 4). Elemental distribution patterns of both Ti(clr) and K(clr) are anti-phased to Ca(clr), whereas Fe(clr) and S(clr) reveal an anti-phase behavior to the pH (Figs. 4, 5). Si(clr) is present in all samples over the whole profile and is highly variable throughout the profile, without a notable systematic pattern. A detailed description of the geochemical data is presented in Supplementary Chapter I.

Figure 5. Calculated centered-log-ratios (clr) for robust XRF-derived elements (Ca, Ti, K, Fe, S, Si), as well as calculated log-ratios of selected elements used for environmental reconstruction (Ca/Ti, Fe/Ti, Si/Ti) of the Para-Reference Profile PRP (2014) and Zeugenblock 13 II (2018).
PCA results
Three principal components (PC) explain 77.45% of the total data variance. PC 1 (37.83%) shows high positive loadings for K, Ti, and Fe, whereas Ca, CaCO3, and pH reveal negative loadings. The axis of PC 2 (25.69%) is mainly influenced by positive loadings for S, TOC, TN, and S, with minor contributions of soluble salts, Si, and Fe. PC 3 (13.93%) is determined largely by Si, TOC, and TN, as well as by the soluble salts (Fig. 6). Given these results, the lacustrine system seems to be driven mainly by minerogenic input (K, Ti, Fe) versus carbonate precipitation (Ca, CaCO3), as has been reported from other studies on endorheic lakes (Haberzettl et al., Reference Haberzettl, Kück, Wulf, Anselmetti, Ariztegui, Corbella and Fey2008; Kasper et al., Reference Kasper, Haberzettl, Doberschütz, Daut, Wang, Zhu, Nowaczyk and Mäusbacher2012, Reference Kasper, Haberzettl, Wang, Daut, Zhu and Mäusbacher2015; Ahlborn et al., Reference Ahlborn, Haberzettl, Wang, Alivernini, Schlütz, Schwarz, Su, Frenzel, Daut and Zhu2015). Consequently, lake level is suggested to have been the major influence, mainly driven by inflow and evaporation. The correlation of pH, Ca, and CaCO3 is reasonable since carbonate buffering likely drives dynamics in the pH. A further driver of the depositional environment (PC 2) is the organic fraction (TOC, TN, S), which is weakly linked to Fe and negatively correlated to pH, thus being an indicator of redox conditions (Sigg and Stumm, Reference Sigg and Stumm2011; Kasper et al., Reference Kasper, Frenzel, Haberzettl, Schwarz, Daut, Meschner, Wang, Zhu and Mäusbacher2013). The minor influence of Si on the system is suggested to reflect the omnipresence of siliciclastic material within the catchment, supported by the minor fluctuations of this element throughout the entire covered time span (Fig. 6).

Figure 6. Left: Results of the principal component analysis (PCA), with PC1 accounting for 37.83% and PC2 for 25.69% of the total data variance. PC1 is considered to reflect the allochthonous clastic input (orange shading) versus carbonate precipitation (blue shading), whereas PC2 mainly reflects the organic fraction in the deposits with a certain contribution of Fe, potentially indicating redox conditions (gray shading). Right: correlation matrix of the input variables with green shading indicating positive correlation and red shading indicating negative correlation.
Based on the classification system for limnic sediments of Succow and Joosten (Reference Succow and Joosten2001), five mud types and three minerogenous sediment types were determined for the entire section (Fig. 7). Silty sand is characteristic for main parts of sub-sublevel 2c4, the entire 2c3, and the uppermost part of sub-sublevel II-2c1. Sub-sublevel 4e3 (upper two-thirds), 4e1, 4c, and 5c3 are silts.

Figure 7. Texture classification of the Para-Reference Profile PRP (2014) and Zeugenblock (2018) following the German soil mapping instructions (Ad-hoc-Arbeitsgruppe Boden, 2005). Lacustrine sediment types are determined after Succow and Joosten (Reference Succow and Joosten2001).
Siliceous mud is the most frequently occurring mud type of the PRP, characterizing sub-sublevels 1a2, 2c5, 2c4/5, 2c1 (lower part), 2bc (lower part), 3b2 (lower part), 3b1, 3a (lower part), 4e3/c3?, 4e3 (lower part), and 5d2. Organic muds are typical for parts of II-2bc and for 3b3, 3b, and 4ab. Calcareous muds form the upper part of II-3b2 and the entire uninterrupted sequence of 3b up to 4ef (Fig. 7).
Palynology and Aquatic Microfossils
New zonation and main characteristics of the pollen percentage diagram
Approximately 130 samples of the Para-Reference Profile (PRP) 13 II (2014) and Zeugenblock (ZB) 13 II (2018) sequence were analyzed palynologically and more than 130 plant taxa identified. Additionally, micro-charcoal fragments were counted. Both the pollen percentage and concentration diagrams have been subdivided into Local Pollen Assemblage Zones (LPAZs) and subzones according to Urban and Bigga (Reference Urban and Bigga2015), who synthesized previous palynological results and added new subzones of the Reinsdorf interglacial (LPAZ RP) to the biostratigraphical subdivision of LPAZs of the Reference Profile (2003), named LPAZ RP, (Fig. 8, Supplementary Fig. 1, Supplementary Table 2).

Figure 8. Pollen percentage diagram of the composite Para-Reference Profile (PRP) 13 II (2014) and Zeugenblock (ZB) 13 II (2018).
The sampling strategy of the PRP at exposure sites, representing the most pronounced and thickest particular level, and the much higher palynological data resolution of the Para-Reference Profile 13 II (2014) resulted in additional differentiation of pollen assemblage subzones and sub-subzones (LPAZ PRP). Eight major LPAZs could be identified and further subdivided into four new and four already established local pollen assemblage subzones and three new sub-subzones in the PRP and ZB (Supplementary Table 2). The conventional LPAZ subdivision is supported by the stratigraphically constrained cluster analysis CONISS (Grimm, Reference Grimm1987) (Fig. 8, Supplementary Fig. 1).
Subzone R3a
Subzone R3a of LPAZ R3 extends from 97.025–97.125 m asl. It is characterized by high values of Pinus (max. 63%), Picea and Abies reach ~10%, while Carpinus values range between 5–10%. Tilia values are <5%, which characterizes late phases of LPAZ R3 that follow the 2nd Tilia maximum of subzone R3a, as described by Urban and Bigga (Reference Urban and Bigga2015). NAP, mainly Poaceae, is ~10% at the base, while Myriophyllum verticillatum and pollen types of the wetland taxa Typha latifolia-type and Sparganium-type occur in this lowermost subzone in small amounts.
Subzone R3b
The following subzone R3b (Urban and Bigga, Reference Urban and Bigga2015) is here divided into two sub-subzones: PRP3b1 (97.125–97.44 m asl, sub-sublevel II-2c5) and PRP3b2 (97.44–97.625 m asl, sub-sublevel II-2c4/5).
Sub-subzone PRP3b1: Sub-subzone PRP3b1 borders subzone R3a at the transition between sub-sublevel II-1a2 and II-2c5, where Tilia drops below 1%. At the base of this sub-subzone there are slight increases of Carpinus and strong increases of Alnus (max. 40%), while towards the top of PRP 3b1 Picea and Pinus curves are declining. Fagus and Pterocarya pollen and Massulae of the water fern Azolla filiculoides are recorded. Among the NAP (20%), the curves of Poaceae and heliophile herbs increase slightly. Values of Calluna, Empetrum, Vaccinium-type, Ericaceae indeterminate, and Sphagnum increase strongly, indicating bog development.
Sub-subzone PRP3b2: Sub-subzone PRP3b2 (97.44–97.625 m asl, sub-sublevel II-2c4/5) borders the preceding sub-subzone PRP3b1 at an increase of Pinus and decreases in Alnus, Carpinus, and Abies. Poaceae and heliophile herbs increase further with NAP reaching mean values ~32%. Picea is present with values between 2–5%. Relatively high amounts of reworked pre-Pleistocene palynomorphs indicate inflow of allochthonous material into the lake. Pollen of aquatic, wetland, and swamp taxa are recorded, whereas Ranunculus acris-type appears for the first time.
LPAZ R4/5: LPAZ R4/5 (97.625–97.920 m asl, sub-sublevel II-2c4) shows a co-dominance of Pinus, Betula, and Alnus. It borders with PRP3b2 at the drop of thermophilous trees Carpinus and Abies to <1%. A few grains of Pterocarya and Fagus are recorded. Increasing amounts of marsh and raised-bog plants (Myrica, Salix, Calluna, other Ericaceae, and Sphagnum) are characteristic of this LPAZ (Urban and Bigga, Reference Urban and Bigga2015). NAP pollen is ~30%. Reworked palynomorph values are still high.
Subzones PRP1a and PRP1b
The former LPAZ RP1 (Urban and Bigga, Reference Urban and Bigga2015) has been subdivided here at the PRP into subzones PRP1a (97.920–98.225 m asl, lower part of sub-sublevel II-2c3) and PRP1b (98.225–99.225 m asl, upper part of sub-sublevel II-2c3, sub-sublevel II-2c2, and II-2c1).
Pollen subzone PRP1a borders the preceding LPAZ R4/5 at a strong increase of Poaceae and of heliophile herbs. Among the arboreal pollen, Pinus, Betula, and Alnus co-dominate while values of Salix reach up to 4%. The sum of NAP including Poaceae reaches 40%. The number of reworked palynomorphs is high.
Pollen subzone PRP1b is characterized and separated from the underlying PRP1a by another strong increase of Poaceae (max. 46%), Artemisia, and other heliophile herbs. The total NAP sum amounts to ~61%. Among the tree pollen Betula values vary around 20% and 30%, whereas Pinus and Alnus values average 5%. At the end of the subzone, Juniperus values increase slightly and Larix is present. Polypodiaceae counts are high, reaching a maximum of 90%. Among the aquatic plants, Potamogeton is well represented. In addition two micro-charcoal peaks occur at the top of sub-sublevel II-2c2 and base of II-2c1.
Subzone RP2a
LPA subzone RP2a of LAPZ RP2 has been further subdivided into three new sub-subzones: PRP2a1 (99.225–99.56 m asl, sub-sublevel II-2bc, most parts of II-3bc); PRP2a2 (99.56–100.205 m asl, the uppermost part of sub-sublevel II-3bc, II-3b3, II-3b2, II-3b1); and PRP2a3 (100.205–101.275 m asl, sub-sublevel II-3ab, II-4i, II-4h2, II-4h1, II-4g, II-4f, II-4ef, II-4e3[4c3?]). Pollen subzone RP2b (101.275–101.985 m asl) covers most parts of sub-sublevel II-4e3.
Sub-subzone PRP2a1: PRP2a1 borders the previous pollen subzone PRP1b at the strong increase of Pinus (93% maximum value) and the decrease of Betula as well as of Poaceae. Picea is present with values between 1–2%, whereas Alnus is nearly absent. NAP values dropped to ~15%.
Pollen zone PRP2a2 borders PRP2a1 where the Pinus curve is declining and Betula is increasing. Poaceae, Artemisia, Asteraceae, and other heliophile herbs, as well as Cyperaceae, are also seen to increase. Among the wetland plants, Typha latifolia-type pollen is recorded. Polypodiaceae values are still high, reaching a maximum of 60%. NAP reaches mean values of 23%.
Sub-subzone PRP2a3: PRP2a3 borders PRP2a2 at the drop in the Pinus curve and increase in that of Betula. Values of Pinus are at 45% on average, while Betula reaches mean values of 25%. Picea is present with maximum values of 4%, whereas Alnus has nearly disappeared. NAP values are at 26% on average. Cyperaceae show two maxima at the base and the top of this sub-subzone. Polypodiaceae are absent. Ranunculaceae dominate the NAP. Among aquatic and wetland plants, Potamogeton, Myriophyllum sp., Ranunculus acris-type and Pediastrum duplex are evident.
The reappearance and increase of Alnus values to ~3% is taken as the boundary between the previous sub-subzone PRP2a3 and RP2b. Pollen assemblage subzone RP2b is further characterized by oscillating curves of Pinus and Betula with changing dominance. Values of Pinus slightly decrease whereas Betula shows a bottom-up increase. Picea is present with very low values of ~1%. The spectrum of heliophile herbs is rather diverse, being co-dominated by Artemisia, Asteraceae, Caryophyllaceae, and Rosaceae. The NAP sum amounts to 30% on average. Myrica, Juniperus, Ericaceae, Polypodiaceae, and Sphagnum show increases, as do aquatic and wetland plants. The amount of reworked sporomorphs has again increased reaching values between 5–10% of the pollen sum.
Subzone RP3
LAPZ RP3 (101.985–102.405 m asl) comprises sub-sublevel II-4e1. The increase of Betula and the drop in the Pinus curve mark the boundary between this and the previous subzone. Further increases of Alnus up to 8%, and of Betula to 35%, are observed. The NAP assemblage is comparable to that of the previous subzone RP2b except for Rosaceae, which has higher values, reaching a peak of 9%. The sum of NAP is 25% on average. Bog plants (Myrica, the Ericaceae, Calluna, etc.), have increased values compared to the previous subzone.
Subzone RP4b
LPAZ RP4 is represented by subzone RP4b (101.41–101.75 m asl, sublevel II-4c) at the base of the section and is dominated by Betula (31–58%) and by relatively low values of Pinus (22–32%). Juniperus and Salix are still present but in low values. A single grain of Frangula alnus is recorded in the middle part of the zone while Picea is nearly absent. NAP is at 40%, still dominated by Rosacaeae. The Poaceae curve reaches maximum values of 30%. Ranunculus acris-type values strongly increased (20%). Occurrence of Myriophyllum verticillatum and high amounts of Pediastrum sp. and Pediastrum boryanum are indicative of open water. Typha latifolia-type, Sparganium-type, and Potamogeton values are rather low. Two micro-charcoal peaks occur in the lower half part of the subzone.
Subzone RP5
LPAZ RP5 (101.75–102.13 m asl, sublevel II-4a/b) borders LPAZ RP4b at the transition into sublevel II-4a/b, which is marked by strongly increasing values of Pinus (mean 50%) and of Cyperaceae (10–20%) while the Betula curve is declining. Juniperus is constantly present, although with low values. Single grains of Picea and Larix, and very few Alnus pollen are recorded. Poaceae values are at 15% on average. The total NAP is ~30% on average. Among the aquatic and wetland taxa, Nuphar, Typha latifolia-type, and Sparganium-type, as well as Ranunculus acris-type and Montia, are present.
Subzones PRP6a and PRP6b
The LPAZ RP6 (Urban and Bigga, Reference Urban and Bigga2015) has been subdivided into two new subzones: PRP6a (102.13–102.21 m asl, sub-sublevel II-5d2) and PRP6b (102.21–102.38 m asl, sub-sublevel II-5c3).
Subzone PRP6a borders LPAZ RP5 at an increase of Pinus and decrease of both Betula and Cyperaceae. The NAP spectrum is similar to that in the previous zone. A Sphagnum peak occurs at the base of the zone. A further increase in NAP up to 50% and strong decreases in Pinus and Betula in the upper sample are characteristic for subzone PRP6b, which terminates the investigated profile.
Concluded from the stratigraphically constrained cluster analysis of the percentage diagram, the first principal cluster (97.025–97.920 m asl) comprises pollen assemblage subzones R3a to LPAZ R4/5 (Fig. 8, Supplementary Fig. 1), which indicates termination of the late-temperate interglacial phase (Turner and West, Reference Turner and West1968) of the Reinsdorf interglacial.
Subzones PRP1a and PRP1b, between 97.920 m asl and 99.225 m asl, are clearly covered by the first principal cluster and defined by the fourth principal cluster. These subzones are characteristic of the first post-interglacial steppe phase (Urban and Bigga, Reference Urban and Bigga2015; Tucci et al., Reference Tucci, Krahn, Richter, van Kolfschoten, Rodríguez Alvarez, Verheijen, Serangeli, Lehmann, Degering, Schwalb and Urban2021).
Sub-subzones PRP2a1, PRP2a2, PRP2a3, and subzone RPR2b between 99.225–102.405 m asl and LPAZ RP3 (102.405–102.406 m asl) form the third principal cluster and are specifically defined on the level of the fourth principal cluster. They represent a tripartite phase, divided into denser and less-dense wooded phases (Urban and Bigga, Reference Urban and Bigga2015). Pollen assemblage subzones RP4a/4b and LPAZ RP5 of the uppermost part of the profile (Zeugenblock 13 II, 2018) are visibly divided from each other on the second and third principal cluster, representing the second steppe and another woodland phase.
PRP6a and PRP6b are clustered into the fourth and fifth principal cluster, respectively, and determine the transition into a cold period with steppe-tundra vegetation.
Charophyte gyrogonite analysis
Charophyte gyrogonite (CG) concentrations vary considerably throughout the sequence (0−21 CG/g dry weight [DW]); 56 of 91 samples are barren (Supplementary Table 3). First occurrences of these calcareous remains are observed in sub-sublevel 13 II-2c4 and numbers increase up to 5 CG/g DW in sub-sublevels 13 II-2c3/-2c2. Following a barren section (upper part of sub-sublevel 13 II-2c1 – 13 II-3b1), gyrogonite concentrations increase again, reaching a maximum in sublevel 13 II-4ef (21 CG/g DW), corresponding to highest CaCO3 contents (Fig. 4). While concentrations in sub-sublevels 13 II-4e3 to II-4e1 drop to 0 CG/g DW, consistently higher concentrations are again found in sublevel 13 II-4c (1−11 CG/g DW). No charophyte gyrogonites are present in the uppermost part (sublevel 13 II-4ab–II-5c3) of the sequence, which is consistent with the carbonate-free, acidic deposits determined by geochemical analyses (Fig. 4).
Pollen concentration related to texture and lacustrine sediment type
The entire pollen concentration diagram presented in the supplementary material (Supplementary Fig. 1) shows close similarities with patterns of variation shown in major components of the pollen percentage diagram (Fig. 8). They are clearly reflected by the results of the cluster analyses and will not be described here in detail. To analyze taphonomical influence, total pollen concentration and concentration of certain pollen groups are plotted against grain-size fractions and sediment (mud) type (Figs. 7, 9). The total pollen concentration ranges from 608.901 grains/cm3 (101.365 m, sub-sublevel 4e3, siliceous mud) to 9.614 grains/cm3 (102.315 m, sub-sublevel 5c3, silt). Second-highest amounts of total pollen (519.345 grains/cm3) and highest total AP (399.452 grains/cm3) occur at the boundary between sublevel II-2bc and 3bc (99.505 m), which is an organic mud that has the highest OM content (61.4%) of the entire section. At 98.715 m (sub-sublevel 2c1, LPAZ PRP1b basis), which has been classified a siliceous mud, highest absolute amounts of Poaceae pollen were found (81.754 grains/cm3). The NAP concentration of this level, which amounts in total to 149.327 grains/cm3, is only exceeded by the NAP concentration of 179.856 grains/cm3 at 101.595 m (sub-sublevel 4e3, LPAZ RP2b), which also has been classified as siliceous mud. Pollen concentration of Cyperaceae shows peaks at the transition between layer II-4c (silt) and 4ab (organic mud). Concentration of pollen of aquatic plants does not show clear relations with other features, but this group is present throughout the entire section. The silty sand that comprises sub-sublevel II-2c4 and 2c3 reveals similar low pollen concentration as in layer 1a2, a silty mud and two samples from the upper part of 4c, which is classified as a silt.
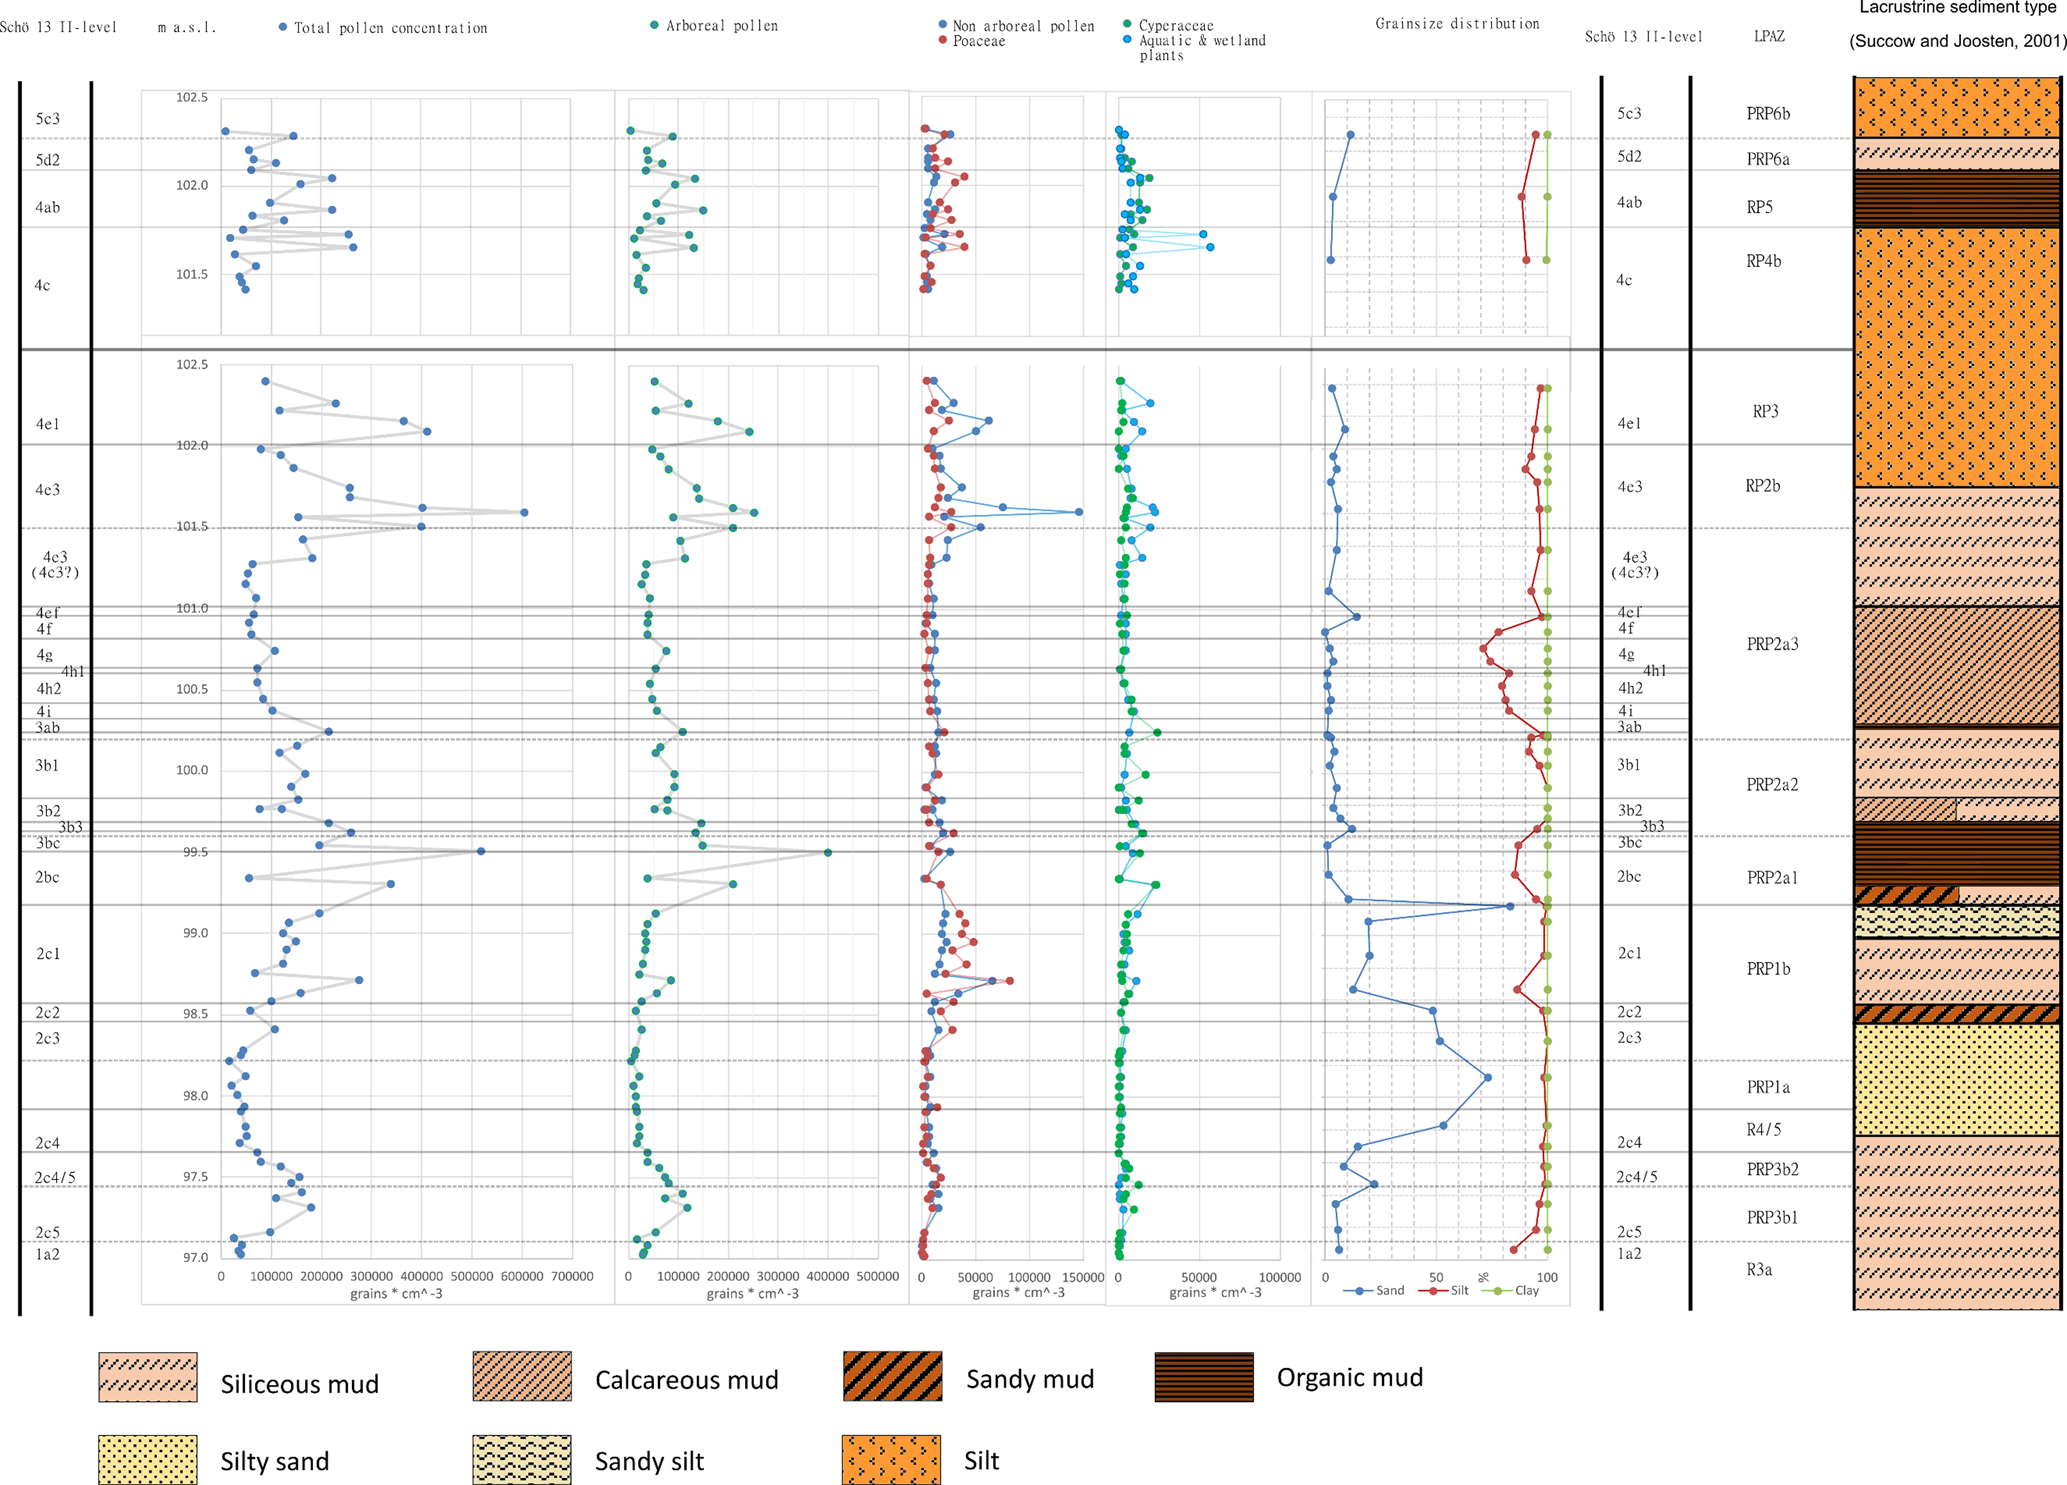
Figure 9. Total pollen concentration [grains/cm3], concentration of AP, NAP (excluding Poaceae), Poaceae, Cyperaceae, and wetland and aquatic plant taxa in relation to texture and mud/sediment type of Para-Reference Profile (PRP) 13 II (2014) and Zeugenblock (ZB) 13 II (2018).
Neither the lacustrine mud types, which in addition to the amount of clastic material are classified by the OM and CaCO3 content (Succow and Joosten, Reference Succow and Joosten2001), nor the minerogenuous sediment types, particularly the texture, reveal any systematically occurring features relating to pollen concentration. These observations might suggest that pollen influx was not primarily controlled by fine-, medium- or coarse-grained depositional material, CaCO3 precipitation, or the organic matter content and status of decomposition. Because sediments are not varved and high-resolution chronometric dating is not possible, accumulation rates cannot be determined. However, vegetation development deduced from the percentage pollen diagram and percentage pollen group diagram (Figs. 8, 10), when related to lithology, seem to suggest that during periods of high lake level, when pollen concentration and pollen assemblages remain relatively constant, sedimentation rate was high; whereas during periods of dropping lake level and terrestrialization processes, the accumulation rate was lower (Fig. 9).

Figure 10. Group-clustered pollen record of Para-Reference Profile (PRP) 13 II (2014) and Zeugenblock (ZB) 13 II (2018) correlated to the Reference Profile (RP) of 13 II (2003), based on Urban and Bigga (Reference Urban and Bigga2015) (modified from Tucci et al., Reference Tucci, Krahn, Richter, van Kolfschoten, Rodríguez Alvarez, Verheijen, Serangeli, Lehmann, Degering, Schwalb and Urban2021). Base sum of the pollen groups is defined by trees and shrubs, terrestrial herbs, Poaceae and Varia (=100%). Thermophile tree, shrub, and other woody taxa mainly include Corylus, Quercus, Ulmus, Tilia, Carpinus, Abies, Hedera, and Ilex. Reworked palynomorphs are mainly of Tertiary and early Quaternary origin. The green curves consist mainly of Betula, Alnus, Salix, Populus, Pinus, Picea, Juniperus, and Larix. LPAZ: Red: early- and late-temperate interglacial, thermophile, deciduous-dominated forests; orange: post-temperate interglacial (boreal) forests and post-interglacial dry woodland and steppe (woodland); blue: post-interglacial dry steppe (open woodland).
Comparison of pollen and charophyte records between the PRP 13 II (2014) and Zeugenblock (2018) and the Reference Profile (2003)
Group-clustered pollen records of the Reference Profile of Schöningen 13 II (Urban and Bigga, Reference Urban and Bigga2015) and of the Para-Reference Profile and Zeugenblock illustrate the vegetation history of the entire Reinsdorf sequence (Fig. 10). The LPAZ table (Fig. 10, Supplementary Table 2) suggests that the stacked PRP and Zeugenblock profile provide much more information about vegetation and climate development, particularly of the middle part of the Reinsdorf sequence, compared to the Reference Profile (Urban and Bigga, Reference Urban and Bigga2015). All LPAZ data were correlated between both reference sections, but the PRP and Zeugenblock were differentiated into several new LPA subzones and sub-subzones. Only pollen zone RP4a of the lower part of II-4c is not represented in the PRP. This is due to the sampling strategy focusing on the transitional part between II-4c and II-4bc and layer II-4a/4b, which contained the throwing spears, as this area is completely excavated except for the preserved Zeugenblock (Fig. 3, left and right) (Thieme, Reference Thieme and Thieme2007).
Charophyte species assemblages and developments closely mirror each other in the two sequences (Supplemental Table 3; Krahn et al., Reference Krahn, Tucci, Urban, Pilgrim, Frenzel, Soulié-Märsche and Schwalb2021), thereby validating and complementing each other. Some (sub-)sublevels are better defined or newly analyzed in sequence PRP 13 II (2014) and ZB 13 (2018) because of the higher number of samples and longer, well-developed sequence.
A few hiatuses at lithologically and palynologically identified positions in the Reference Profile (e.g., at the end of terrestrialization periods at the top of layer II-1a2, or at the boundary between layer II-2c1 and II-2bc at the onset of a terrestrialization period) (Fig. 7) are also identified in the PRP. Similar observations were described by Lang et al. (Reference Lang, Winsemann, Steinmetz, Polom, Pollok, Böhner, Serangeli, Brandes, Hampel and Winghart2012, Reference Lang, Böhner, Polom, Serangeli and Winsemann2015a, Reference Lang, Böhner, Brandes, Hampel, Polom, Serangeli, Steinmetz, Winghart, Winsemann, Terberger and Winghartb); the authors, however, generally assigned these features to erosional activities following a phase of terrestrialization.
Reconstruction of paleo-habitats
The habitat requirements and interactions of the identified taxa were synthesized to propose possible paleoenvironments, especially interactions between and among herbivores, predators and vegetation and ecosystem structures, as well as their dynamics, also drawing on vegetation models of the contested megaherbivore hypotheses (Vera, Reference Vera2000; Vera et al., Reference Vera, Bakker, Olff, Danell, Bergström, Duncan and Pastor2006) and the mosaic-cycle concept (Schmidt, Reference Schmidt1991; Scherzinger, Reference Scherzinger2014) (Fig. 11). The phytosociological analyses resulted in the differentiation of groups of potential plant associations (Supplementary Table 4) for the zonal and the azonal types of vegetation.

Figure 11. Symbols used in the 3 D paleolandscape scenarios of Local Pollen Assemblage Zones R3a; R3b; R4/5; PRP1a/1b; PRP2a1–2a2; PRP2a; RP2b and RP3; RP4a and RP4b; and RP5 and PRP 6b of the Reinsdorf sequence.
The azonal vegetation is characterized by aquatic taxa (e.g., Potamogeton sp., Myriophyllum sp.) and those of reed belts and swamps (e.g., Carex rostrata, C. elongata, C. riparia, Schoenoplectus lacustris, Typha spp., Sparganium emersum, Sparganium erectum, Sparganium minimum, Phragmites australis), but also species of wetlands and moist meadows (e.g., some members of the Apiaceae, Cirsium palustre, Ranunculus repens, Rumex crispus, Filipendula ulmaria, Lychnis flos-cuculi, Polygonum bistorta) and more riparian species that could have occurred lining streams that originated in the Elm mountain range and flowed into the former lake (e.g. Eupatorium cannabinum, Rumex aquaticus, Chenopodium polyspermum, Caltha palustris, Persicaria lapathifolia, Lycopus europaeus, Ranunculus lingua, Mentha aquatica). Another major azonal vegetation zone could have been similar to some of today's swamp forests dominated by Alnus spp. or Betula spp. and could have provided suitable habitats for some of the identified sedges and herbs (e.g. Carex riparia, Lycopus europaeus, Mentha aquatica, Carex elongata).
In the assumed zonal areas, farther away from the lakeshore and more dependent on precipitation than on local hydrology, forests and wood-shrub-grassland mosaics could have been more widespread, presenting habitats for Tilia cordata, Pinus sp., Quercus sp., Corylus sp., Acer campestre, Prunus avium, Sorbus torminalis, and, later in succession, Carpinus sp. and Abies sp., as well as Ulmus sp. and Fraxinus sp. in slightly moister areas. Additionally, other vascular plants such as Lamium album, Urtica dioica, Urtica urens, Gallium aparine, Chelidonium majus, Glechoma hederacea (all considered nitrophilic today), Stellaria holostea, Moehringia trinerva, Viola cf. V. alba, and Thalictrum minus would have occurred in the more zonal habitats. Species such as Cornus sanguinea, Berberis vulgaris, Prunus spinosa, Crataegus monogyna, Sambucus nigra, Fallopia convolvulus, Viola arvensis, Carex hirta, Polygonum aviculare, Chenopodium album, Chenopodium polyspermum, Galeopsis tetrahit, Chelidonium majus, Urtica sp., and Rumex crispus possibly occupied more disturbed areas. Linum austriacum, Thymelaea passerina, Agrimonia repens, Onopordum davisii (Czaja, 2012), and Acer tartaricum are characteristic elements of the warmer periods where Tilia sp. was prominent among the phanerophytes. Potentilla anserina, Rumex maritimus, Aster cf. A. tripollium, Schoenoplectus tabernaemontani, S. triqueter, Acorellus pannonicus, Chenopodium rubrum, and the aquatic Zannichellia palustris can also be regarded as members of azonal, more halophilic communities, indicative of soil and water salinization.
The mammalian record from the Schöningen 13 II sequence is comparably extensive and diverse in species to those of most of the European Paleolithic sites. The results of paleoenvironmental analyses, based on large assemblages from the different (sub)horizons are less detailed, however, in comparison with the paleobotanical data (see Supplementary Tables 4, 5). The mammalian record is a solid proxy for reconstruction of paleoenvironments, but the record is not a total reflection of the past local environments due to taphonomic issues (such as the accumulation history of the assemblage). The composition of mammalian assemblages is heavily biased towards preferential selection of the accumulators. The dominance of horse remains in the assemblage excavated at the type location of the “spear-horizon” (Schö 13 II-4ab) most probably is the result of preferential hominin hunting. Moreover, the small mammal record is heavily biased by the preferences of the birds of prey. In addition, birds of prey collect their prey in an area up to 30 km2 in size, reflecting various regional biotopes. Consequently, the fossil small mammal assemblages, collected at the edge of the former lake, most probably reflect the paleoenvironments of a much larger area.
The fossil mammalian record of the Reinsdorf sequence (Supplementary Table 5) is primarily characterized by the absence of species such as Mammuthus primigenius and Coelodonta antiquitatis, which generally are regarded as indicators of an open environment and cold, glacial climatic conditions. The large (herbivore) faunal assemblages from the Schöningen levels Schö 12B and Schö 13 II-1 – 4 (Supplementary Table 5) with species such as wild boar (Sus scrofa) and roedeer (Capreolus capreolus) indicate temperate climatic conditions and a mosaic landscape at the edge of the paleolake, with a mixture of areas with woodlands and open grasslands. The occurrence of forest dwellers such as Apodemus sylvaticus in the assemblage of Schö 13 II-1 supports the woodland habitat reconstruction based on the paleobotanical data. The succeeding steppe phase (Schö 13 II-2c1–2c3) yielded small mammal species that indicate the (local) presence of forest (e.g., the garden dormouse Eliomys quercinus) as well as taxa that are semi-aquatic (e.g., the Eurasian water shrew Neomys, the European desman Desmana, the water vole Arvicola) (Tucci et al., Reference Tucci, Krahn, Richter, van Kolfschoten, Rodríguez Alvarez, Verheijen, Serangeli, Lehmann, Degering, Schwalb and Urban2021). The small mammal assemblage from that specific level includes, in addition, Dicrostonyx sp. and Lasiopodomys gregalis, species that indicate an open habitat and tolerate cool, glacial conditions. The co-occurrence in the 13 II-2c3 assemblage of Eliomys quercinus, a forest dweller indicating at least temperate climatic conditions, and Dicrostonyx sp., a tundra dweller usually indicating cold climatic conditions, is remarkable. The younger sub-sublevel 13 II-2c1 yielded remains of the pika Ochotona pusilla, a species that inhabits the dry steppe biotope. This observation is in good agreement with the vegetation record of the Reference Profile, which records an open steppe environment for this level of PRP1.
The mammalian record from the uppermost post-interglacial, early steppe-tundra phase (level Schö 13 II-5c3) is very limited. The Obere Berme site yielded an extensive small mammal assemblage, part of it originating from level 13 II-5c. That specific level has so far yielded only three species, and the dominant smaller mammal is the steppe dweller Lasiopodomys gregalis. The arctic lemming Dicrostonyx torquatus, a typical tundra dweller, however, is absent.
DISCUSSION
Paleoenvironment and landscape reconstruction
The investigated lacustrine deposits of the five sedimentation cycles of the new Para-Reference Profile (PRP) 13 II (2014) and Zeugenblock (ZB) 13 II (2018) reveal the environmental development of the Reinsdorf sequence from the late-temperate interglacial period of MIS 9e to post-interglacial phases probably correlating to MIS 9d-9a, terminating at level II-5, which represents the transition into the cold steppe-tundra glacial period of likely MIS 8. This new subdivision of the post-interglacial phases identifies two phases of stadial (steppe, open woodland) and two phases of interstadial character (woodland), and the subsequent glacial period, supporting the subdivision published by Urban (Reference Urban, Sirocko, Claussen, Sanchez Goni and Litt2007a).
Geochemistry, sedimentology, aquatic microfossils
The generally high minerogenic input (i.e., Ti, K, Ca/Ti) and hence low amounts of carbonate (Ca, CaCO3) point to pluvial, erosion-driven environmental conditions (Mayr et al., Reference Mayr, Fey, Haberzettl, Janssen, Lücke, Maidana and Ohlendorf2005; Haberzettl et al., Reference Haberzettl, Corbella, Fey, Janssen, Lücke, Mayr and Ohlendorf2007; Brunschön et al., Reference Brunschön, Haberzettl and Behling2010; Kasper et al., Reference Kasper, Haberzettl, Wang, Daut, Zhu and Mäusbacher2015) during deposition of sub-sublevel II-1a2 to II-2c4/5 (97–97.65 m asl). Additionally, decreasing clay content and higher amounts of silt indicate slightly enhanced transport energies (McLaren, Reference McLaren1981; Pye, Reference Pye1994), thus supporting the enhanced minerogenic input, which may suggest the initial phase of lacustrine deposition within a comparably small lake. Slightly enhanced biogenic productivity and preservation (TOC) and increasing but variable C/N ratios suggest a mix of aquatic and terrestrial biomass sources (Meyers and Ishiwatari, Reference Meyers, Ishiwatari, Lerman, Imboden and Gat1995; Meyers and Terranes, Reference Meyers, Terranes, Last and Smol2001; Meyers, Reference Meyers2003; Mayr et al., Reference Mayr, Fey, Haberzettl, Janssen, Lücke, Maidana and Ohlendorf2005; Gälman et al., Reference Gälman, Rydberg, de-Luna, Bindler and Renberg2008). Low Si/Ti values further point to quite low amounts of biogenic silica (Kylander et al., Reference Kylander, Ampel, Wohlfarth and Veres2011; Brown, Reference Brown, Croudace and Rothwell2015; Chawchai et al., Reference Chawchai, Kylander, Chabangborn, Löwemark and Wohlfarth2016), thus indicating the waterbody was, at an initial stage, presumably depleted in nutrients. Diatom and ostracode remains were absent during this initial phase, further suggesting unfavorable growth conditions (Krahn et al., Reference Krahn, Tucci, Urban, Pilgrim, Frenzel, Soulié-Märsche and Schwalb2021). The distinct decrease in Fe/Ti suggests development of anoxic conditions at the sediment-water interface during this initial lake stage (Brunschön et al., Reference Brunschön, Haberzettl and Behling2010; Sigg and Stumm, Reference Sigg and Stumm2011; Kasper et al., Reference Kasper, Frenzel, Haberzettl, Schwarz, Daut, Meschner, Wang, Zhu and Mäusbacher2013). These conditions are most likely due to enhanced sediment accumulation rates and input of organic matter in combination with its decomposition and the associated O2 depletion (Brunschön et al., Reference Brunschön, Haberzettl and Behling2010; Sigg and Stumm, Reference Sigg and Stumm2011; Kasper et al., Reference Kasper, Frenzel, Haberzettl, Schwarz, Daut, Meschner, Wang, Zhu and Mäusbacher2013).
The extremely high soluble salt content of ~13% and a pH value of <1 of the lowermost sample of the sequence (II-1a2) can be explained by locally surfacing saline groundwater related to the position of the site in the western depression of the Helmstedt-Staßfurt salt dome (Tucci et al., Reference Tucci, Krahn, Richter, van Kolfschoten, Rodríguez Alvarez, Verheijen, Serangeli, Lehmann, Degering, Schwalb and Urban2021). Temporarily increased salinities were also deduced from ostracode analyses for the middle part of the first post-interglacial woodland/steppe (woodland) phase and related to phases of intensified groundwater discharge into the lake (Krahn et al., Reference Krahn, Tucci, Urban, Pilgrim, Frenzel, Soulié-Märsche and Schwalb2021). These deposits were formed during the late-temperate and post-temperate interglacial phases of the Reinsdorf interglacial sensu stricto (Urban, Reference Urban1995, Reference Urban, Sirocko, Claussen, Sanchez Goni and Litt2007a) (Figs. 8, 12–14, Supplementary Table 2).

Figure 12. Visualization of landscape and habitats of the late-temperate interglacial forest phase of the Reinsdorf interglacial, LPAZ R3a (13 II-1a) (Table 1).

Figure 13. Visualization of landscape and habitats of the late-temperate interglacial forest phase LPAZ R3b (= PRP3b1, PRP3b2) (II-2c5) (archaeological horizon 12 B) of the Reinsdorf interglacial (Table 1).

Figure 14. Visualization of landscape and habitats of the post-temperate interglacial boreal conifer forest phase LPAZ R4/5 (II-2c4) of the Reinsdorf interglacial (Table 1).
Table 1. Local pollen assemblage zones, subzones, and sub-subzones, vegetational phases, and biostratigraphic subdivision of the Para-Reference Profile (PRP) 13 II (2014) and Zeugenblock (ZB) 13 II (2018) (Urban, Reference Urban, Sirocko, Claussen, Sanchez Goni and Litt2007a; Urban and Bigga, Reference Urban and Bigga2015) of the Reinsdorf Sequence and tentative correlation with the Marine Isotope Stratigraphy (MIS).

The low organic content and the low C/N ratios suggest low terrestrial and enhanced aquatic biogenic production (Meyers, Reference Meyers1994, Reference Meyers2003) within layers II-2c4, 2c3, and 2c2. Decreasing terrestrial biomass and gradual opening of the landscape (Urban and Bigga, Reference Urban and Bigga2015; Tucci et al., Reference Tucci, Krahn, Richter, van Kolfschoten, Rodríguez Alvarez, Verheijen, Serangeli, Lehmann, Degering, Schwalb and Urban2021) (Figs. 14, 15) resulted in the catchment soils being more prone to erosion, reflected in still high minerogenic input and the gradually increasing amounts of sand (Pye, Reference Pye1994; Kasper et al., Reference Kasper, Haberzettl, Wang, Daut, Zhu and Mäusbacher2015). Higher inflow rates likely flushed in more nutrients, which, potentially triggered aquatic production and slightly increased biogenic silica occurrence (diatoms, elevated Si/Ti). Additionally, the influx of dissolved Ca from the catchment likely supported CaCO3 formation within the water, a feature supported by the slightly elevated aquatic productivity, high pH (Fig. 4), increasing charophyte gyrogonite (Supplementary Table 3), and ostracode concentrations (Krahn et al., Reference Krahn, Tucci, Urban, Pilgrim, Frenzel, Soulié-Märsche and Schwalb2021). Lake level rose distinctly during that time interval, which is assumed to have contributed to lake-bottom anoxia in addition to the deposition of coarse-grained sediments and an assumed higher sediment accumulation rate (Sigg and Stumm, Reference Sigg and Stumm2011; Kasper et al., Reference Kasper, Frenzel, Haberzettl, Schwarz, Daut, Meschner, Wang, Zhu and Mäusbacher2013). Increased abundances of mesorheophilic ostracodes indicate flowing waters and a phase of increased surface-stream inflows, which was ascribed by Krahn et al. (Reference Krahn, Tucci, Urban, Pilgrim, Frenzel, Soulié-Märsche and Schwalb2021) to reduced vegetation cover in the catchment. Biogenic productivity during sedimentation of level II-2c1 tends to increase slightly with slightly higher C/N ratios, and thus elevated amounts of terrestrial biomass (Meyers, Reference Meyers2003). Since the sediment texture becomes distinctly finer, lake level is assumed to have increased, thus increasing the distance of the inflows to the sampling position and stabilizing the water body. Hence, coarse particles likely were deposited proximal to the inflow, whereas the internal dynamics of the reduced lake allowed finer particles to settle close to the sampling spot (Pye, Reference Pye1994; Kasper et al., Reference Kasper, Haberzettl, Wang, Daut, Zhu and Mäusbacher2015). Nonetheless, dominance of tychoplanktonic diatoms suggests habitat instability and increased erosion, possibly together with longer periods of lake ice cover (Krahn et al., Reference Krahn, Tucci, Urban, Pilgrim, Frenzel, Soulié-Märsche and Schwalb2021). The two peaks of increased C/N ratios (Fig. 4) were due to temporarily increased inflow of allochthonous material, also indicated by reworked pollen (Fig. 8). Layer II-2c4 developed during the post-temperate interglacial boreal conifer forest phase, and transitioned into the first post-interglacial steppe (open woodland) phase of LPAZ RP1, as documented by sub-sublevels II-2c3–II-2c1 (Figs. 8, 15). Increased moisture and rise of water tables are typical for transitional phases between forested and unforested phases due to the loss of woodland (Behre et al., Reference Behre, Hölzer and Lemdahl2005).

Figure 15. Visualization of landscape and habitats of the first post-interglacial steppe (open woodland) phase LPAZ PRP1a/1b (II-2c1–II-2c3) of Reinsdorf A (archaeological horizon 12 A) (Table 1).
The pronounced sand peak (83%) and the distinct minimum in Ca point to a depositional event occurring at the transition between sub-sublevel II-2c1 and II-2bc (at 99.20 m asl) (Fig. 4). Due to the large amount of coarse material, a high transport energy is assumed, indicating an erosional gap between the layers (McLaren, Reference McLaren1981; Pye, Reference Pye1994; Mulder and Alexander, Reference Mulder and Alexander2001; Ahlborn et al., Reference Ahlborn, Haberzettl, Wang, Alivernini, Schlütz, Schwarz, Su, Frenzel, Daut and Zhu2015). Similar observations have been made by Urban and Bigga (Reference Urban and Bigga2015), who described a sharp boundary between II-2c1 and overlying organic muds and fen peat of II-2b (equivalent to II-2bc) for the Reference Profile. The subsequent increase in high soluble salt in combination with increasing Ca (but absence of CaCO3) and S might indicate a short phase of CaSO4 formation due to input of valuable amounts of dissolved Ca and salts from groundwater flows (Jin et al., Reference Jin, Siegel, Lautz, Mitchell, Dahms and Mayer2010).
The input of rather large amounts of sediment during a comparably short time interval (event-related deposit) is suggested to have led to both (1) the influx of large amounts of nutrients and (2) increases in the proportion of shallow-water areas (littoral zone) within the lake. This proposal is supported by a pronounced increase in biogenic productivity, with distinctly low C/N ratios and an increase in biogenic silica, likely pointing to strong aquatic production within the subsequent sub-sublevel II-2bc (Figs. 4, 7).
However, decreasing lake levels during the early part of the first post-interglacial woodland phase (II-2bc–II-3b1) (Figs. 8, 16) are concluded from the botanical evidence of expansion of local wetland vegetation and of wooden taxa forming a denser vegetation cover. The peak in TOC associated with higher C/N, strongly variable carbonate contents, and variable minerogenic input during the following sub-sublevels (II-3bc, II-3b3, and II-3b2; 99.50–99.785 m asl) indicate a dynamic status of the lacustrine system, very likely with fluctuating water levels and increased terrestrial biogenic production and input. This dynamic lacustrine system is also reflected in the rich riparian and wetland vegetation (Figs. 8,–10). Distinctly variable redox-conditions (Fe/Ti) in combination with variable biogenic silica (Fig. 5) further supports the highly dynamic character of the system.

Figure 16. Visualization of landscape and habitats of the early part of the first post-interglacial woodland phase LPAZ PRP2a1–2a2 (II-2bc–II-3b1) of Reinsdorf B1 (Table 1), (archaeological layer Schö 13 II-3bc, elephant carcass, Serangeli et al., Reference Serangeli, Verheijen, Rodríguez Álvarez, Altamura, Lehmann and Conard2020).
Layer II-3b1 (99.91–100.22 m asl), with increased minerogenic input and low carbonate precipitation within the lake, further reveals lower rates in biogenic production, however with slightly lower C/N (15) indicating a mix of terrestrial and aquatic origin of the biomass (Meyers, Reference Meyers2003). High sediment accumulation rates, and thus fast burial of organic matter, likely resulted in anoxic conditions reflected by low Fe/Ti (Kasper et al., Reference Kasper, Frenzel, Haberzettl, Schwarz, Daut, Meschner, Wang, Zhu and Mäusbacher2013). These conditions might well explain the absence of ostracodes in this sub-sublevel (Krahn et al., Reference Krahn, Tucci, Urban, Pilgrim, Frenzel, Soulié-Märsche and Schwalb2021). In general, the dynamic character of the lake seems to persist, although lake level is assumed to have been fairly stable.
The following thin layers, II-3b and II-3a (= II-3ab; 100.235–100.335 m asl), reveal a short-term increase in terrestrial biomass (high TOC and high C/N; Meyers, Reference Meyers2003). This is associated with increased carbonate precipitation and decreased input of minerogenic material, likely indicating a negative precipitation/evaporation (P/E) balance (Kasper et al., Reference Kasper, Haberzettl, Doberschütz, Daut, Wang, Zhu, Nowaczyk and Mäusbacher2012, Reference Kasper, Haberzettl, Wang, Daut, Zhu and Mäusbacher2015). Together with an increasing trend in pH, but indication of anoxic conditions, this might point to a rather quick climatic shift towards drier conditions with input of dead terrestrial vegetation and higher evaporation rates. Rich wetland and aquatic vegetation indicates increased frequencies of swamp development, and thus a slightly falling water level.
The succeeding sublevels II-4i to II-4ef (100.355–100.975 m asl), reveal a generally high carbonate content (Characeae) and biogenic silica (Si/Ti), primarily aquatic organic matter contribution, and oxic conditions with high pH, all indicating a stable, nutrient-rich (eutrophic) lake within a warm environment. Aquatic microfossils strongly support a more stable, productive water body with rich aquatic vegetation by a shift from tychoplanktonic towards benthic diatoms, increased charophyte gyrogonite and ostracode concentrations, and higher abundances of oligorheophilic ostracodes (Supplement Table 3; Krahn et al., Reference Krahn, Tucci, Urban, Pilgrim, Frenzel, Soulié-Märsche and Schwalb2021). However, within this section (layer II-4g; 100.655–100.795 m asl) TOC content, C/N, as well as minerogenic input show a distinct local maximum (Figs. 4, 5). Carbonate precipitation also decreases, and clay content reveals another maximum. These proxy changes likely point to a short-term climatic excursion with increased moisture availability, rising lake level, and enhanced terrestrial biomass production, all indicative of fluctuating lake levels occurring during the middle part of the first post-interglacial woodland/steppe (woodland) phase PRP2a3 (II-3ab–II-4e3, lower part) (Figs. 8, 17).

Figure 17. Visualization of landscape and habitats of the middle part of the first post-interglacial woodland/ (steppe [woodland]) phase LPAZ PRP2a3 (II-3ab–II-4e3, lower part) of Reinsdorf B2 (Table 1).
Within the overlying deposits (sub-sublevels II-4e3/c3, 4e3, 4e1 [100.34–102.435 m]), almost all proxies reveal the opposite compared to the previously described phase, consistently interpreted as climatic and environment opposites. Enhanced minerogenic input with stable high proportions of silt and minor amounts of clay, as well as reduced carbonate precipitation, might indicate higher moisture availability and comparably reduced evaporation (McLaren, Reference McLaren1981; Kasper et al., Reference Kasper, Haberzettl, Wang, Daut, Zhu and Mäusbacher2015). A shift to more aquatic, but generally reduced, bio-productivity (Meyers, Reference Meyers2003) likely indicates a high lake level, which is further supported by lake-floor anoxia due to both a comparably high sediment-accumulation rate and probably hampered water column mixing (Kasper et al., Reference Kasper, Frenzel, Haberzettl, Schwarz, Daut, Meschner, Wang, Zhu and Mäusbacher2013) during this late part of the first post-interglacial woodland phase LPAZ RP2b–RP3 (II-4e3 upper part–II-4e1) (Figs. 8, 18).

Figure 18. Visualization of landscape and habitats of the late part of the first post-interglacial woodland phase LPAZ RP2b–RP3 (II-4e3 upper part–II-4e1) of Reinsdorf B3 (Table 1).
The carbonate- and Characeae-rich silt of the upper part of level II-4c (101.475–101.70 m) of the Zeugenblock shows a rather low C/N ratio, reflecting overall low and mainly aquatic biomass production (Meyers, Reference Meyers2003). This interpretation is supported by higher Fe/Ti values that point to a shift towards more oxic conditions, which might suggest better bottom-water ventilation due either to better water-column mixing (wind) or to the overall low bio-productivity and reduced decomposition rates (Brunschön et al., Reference Brunschön, Haberzettl and Behling2010; Sigg and Stumm, Reference Sigg and Stumm2011; Kasper et al., Reference Kasper, Frenzel, Haberzettl, Schwarz, Daut, Meschner, Wang, Zhu and Mäusbacher2013). Frequent occurrences of charophyte gyrogonites provide further proof of submerged conditions with rich aquatic vegetation. However, tychoplanktonic diatoms and mesorheophilic ostracodes point again towards less stable habitats and turbulence, probably related to increased stream inflow or wind influence as consequence of a reduced catchment vegetation cover (Krahn et al., Reference Krahn, Tucci, Urban, Pilgrim, Frenzel, Soulié-Märsche and Schwalb2021). Previous investigations also interpreted deposition during a high water table (Urban and Bigga, Reference Urban and Bigga2015). A rather sparse vegetation cover under dry conditions is characteristic of this second post-interglacial steppe (open woodland) phase LPAZ RP4a–RP4b (II-4c) (Figs. 8, 10, 19).

Figure 19. Visualization of landscape and habitats of the second post-interglacial steppe (open woodland) phase LPAZ RP4a–RP4b (II-4c) of Reinsdorf C (Table 1).
Subsequently, the following sub-sublevel II-4ab, which is carbonate-free, reveals a quite high amount of organic matter and a shift towards a more terrestrial biomass origin (Meyers, Reference Meyers2003). Gyrogonites of charophytes and ostracodes are again completely absent (Supplementary Table 3; Krahn et al., Reference Krahn, Tucci, Urban, Pilgrim, Frenzel, Soulié-Märsche and Schwalb2021), likely related to dissolution of the calcareous microfossils under acidic pH and/or decreased water depths. In combination with an associated change of the floral composition during this second post-interglacial woodland phase (LPAZ RP5, II-4ab), this layer reflects another lake level drop and terrestrialization of the site (Figs. 8, 10, 20). Because the transition between these two layers is sharp, the drop in lake level is assumed to have happened rather quickly.
Within the uppermost section (sub-sublevels II-5d2 and II-5c3) slightly increasing sand contents and renewed lowering in biogenic production suggest a further lowering of the lake within a comparably cold and dry environment. This marks the transition into a cold post-interglacial steppe-tundra phase (LPAZ PRP6b) when the lake was probably drying out (Figs. 8, 9, 21).
Flora and fauna habitat and landscape reconstruction of major periods of the Reinsdorf sequence
Stable isotope data (Kuitems et al., Reference Kuitems, van der Plicht, Drucker, van Kolfschoten, Palstra and Bocherens2015), especially carbon and nitrogen stable isotope ratios of the herbivore species from Schöningen, support the envisioned mixed landscape, indicated by the paleobotanical and, in particular, by the mammalian fossil record. Meso- and micro-wear studies of horse (Equus mosbachensis) molars (Rivals et al., Reference Rivals, Julien, Kuitems, van Kolfschoten, Serangeli, Drucker, Bocherens and Conard2015), as well as the stable isotope study (Kuitems et al., Reference Kuitems, van der Plicht, Drucker, van Kolfschoten, Palstra and Bocherens2015), indicate that the horses from Schöningen were predominantly browsers. Among the rhinos, Stephanorhinus kirchbergensis is more a browser whereas Stephanorhinus hemitoechus is more a grazer. The isotope values of the straight-tusked elephants (Palaeoloxodon antiquus) display a grass-dominated diet (Kuitems et al., Reference Kuitems, van der Plicht, Drucker, van Kolfschoten, Palstra and Bocherens2015).
Apart from the disappearance of the thermophile mammalian taxon Bubalus murrensis, which was dependent on permanent open waters, other large terrestrial fauna characteristic for the late-temperate interglacial LPAZ R3a, PRP3a1, PRP3a2, and LPAZ R4/5 (Figs. 8, 12) did not exhibit significant changes in composition throughout the Reinsdorf Schö 13 II-1−II-4 sequence that could be associated with climatic and ecological development, as evinced in the palynological and aquatic microfossil records (Serangeli et al., Reference Serangeli, Böhner, van Kolfschoten and Conard2015; van Kolfschoten et al., Reference van Kolfschoten, Buhrs and Verheijen2015a, Reference van Kolfschoten, Parfitt, Serangeli and Bellob).
The occurrence of browsers in a more steppe-like environment indicates a diverse, mosaic hinterland. The same feature is observed in the smaller mammal associations. Although species that inhabited lake margins are predominant, inhabitants of a more steppe-like environment or fringes of forested areas emphasize the tessellated character of the landscape.
Based on the previous assumptions and limits of interpretation concerning biotope reconstruction and interactions of flora and fauna, the three final phases of the terminating Reinsdorf interglacial sensu stricto (Urban, Reference Urban1995), which are recorded from pollen and macrofossil analyses (Jechorek, Reference Jechorek2000; Urban and Bigga, Reference Urban and Bigga2015; Bigga, Reference Bigga2018; Tucci et al., Reference Tucci, Krahn, Richter, van Kolfschoten, Rodríguez Alvarez, Verheijen, Serangeli, Lehmann, Degering, Schwalb and Urban2021), are (1) transition from forest phases dominated by thermophile deciduous woody taxa such as Fraxinus, Quercus, Ulmus, Tilia, Carpinus cf. C. betulus, Corylus cf. C. avellana, Acer campestre, Sorbus terminalis, Prunus avium, and the continental Acer tataricum (Jechorek, Reference Jechorek2000), with very few Pinus (LPAZ R3a) (Figs. 8, 11, 12); to (2) Carpinus, Abies, Picea, and Pinus-rich late-temperate interglacial (LPAZ R3b) (Fig. 13); and finally to (3) post-temperate interglacial boreal conifer forests with Pinus, Betula, and Alnus (LPAZ R4/5) (Fig. 14). Alnus, Betula, and Salix occur throughout the three zones characterizing the riverine and lakeshore vegetation canopy, where swamps and reed belts rich in Carex spp. and Typha spp. also had expanded, and the water fern Azolla filiculoides grew in the eutrophic water bodies. Expanding taxa such as Sphagnum, Calluna and other Ericaceae, Myrica, and Salix indicate increasing peat growth during LPAZ R4/5. The increased moisture, accompanied by a rise in water tables, is characteristic of transitional phases between forested and unforested periods due to the loss of forests (Behre et al., Reference Behre, Hölzer and Lemdahl2005), which previously has been observed for records of the Reinsdorf sequence (Urban and Bigga, Reference Urban and Bigga2015; Tucci et al., Reference Tucci, Krahn, Richter, van Kolfschoten, Rodríguez Alvarez, Verheijen, Serangeli, Lehmann, Degering, Schwalb and Urban2021) (Fig. 14).
Layer II-2c5 of site 13 II has been correlated palynologically with layers of the oldest known archaeological horizon 12 B of the Reinsdorf sequence, which was discovered at the northern lake shore site (Thieme et al., Reference Thieme, Mania, Urban and van Kolfschoten1993; Thieme Reference Thieme, Thieme and Maier1995; Urban and Sierralta, Reference Urban, Sierralta and Behre2012; Urban and Bigga, Reference Urban and Bigga2015; Tucci et al., Reference Tucci, Krahn, Richter, van Kolfschoten, Rodríguez Alvarez, Verheijen, Serangeli, Lehmann, Degering, Schwalb and Urban2021) (Figs. 1B, 13: archaeological sites 12 A/B). The repeatedly observed occurrence of Pterocarya pollen in units II-2c5 and II-2c4 (LPAZ R3b and R4/5) (Fig. 8) suggests the presence of the tree during late phases of the Reinsdorf interglacial in the area (Urban, Reference Urban1995, Reference Urban, Sirocko, Claussen, Sanchez Goni and Litt2007a; Urban et al., Reference Urban, Sierralta and Frechen2011; Kunz et al., Reference Kunz, Urban and Tsukamoto2017). Recent research of Strahl (Reference Strahl, Wansa, Strahl and Rappsilber2019) demonstrated the occurrence of Pterocarya in late phases of the Horstwiesen interglacial, which is held to be an equivalent to the Reinsdorf interglacial.
Pollen spectra of sub-sublevels II-2c1 to II-2c3, which follow a hiatus on top of level II-2c4, reveal a distinctive environmental change resulting in a major deforestation of the area and an increase of open-landscape indicators such as grass and herb-rich communities (LPAZ PRP1a/1b), (Fig. 15) (Tucci et al., Reference Tucci, Krahn, Richter, van Kolfschoten, Rodríguez Alvarez, Verheijen, Serangeli, Lehmann, Degering, Schwalb and Urban2021), coined here as the Reinsdorf A oscillation. Juniperus, Salix, and Betula likely colonized wetland and peat bog stands of the lowland and the lake margins, while Pinus and Larix would have been distributed farther away from both, within wet and dryer stands of the limestone-rich soils of the Elm and in the plains. Larix pollen and macro remains are among other sites known from the middle Pleistocene Göttingen Ottostraße site (Grüger et al., Reference Grüger, Jordan, Meischner, Schlie and Meyer1994) and from early Weichselian interstadials of the Northern German plain (Behre et al., Reference Behre, Hölzer and Lemdahl2005; Weiß et al., Reference Weiß, Hein, Urban, Stahlschmidt, Heinrich, Hilbert and Power2022), illustrating its competitive pre-Holocene distribution in western central Europe during cooler, boreal, and partly dryer climatic conditions compared to today.
The small mammal faunal association of this pollen zone consists of steppe-tundra dwellers (Lemmus lemmus) as well as forest species (the garden dormouse Eliomys quercinus, the bank vole Clethrionomys glareolus, the wood mouse Apodemus sylvaticus) and taxa that are semi-aquatic (the Eurasian water shrew, for example) (Tucci et al., Reference Tucci, Krahn, Richter, van Kolfschoten, Rodríguez Alvarez, Verheijen, Serangeli, Lehmann, Degering, Schwalb and Urban2021). In layer II-2c3, remains of the Eurasian straight-tusked elephant (Palaeoloxodon antiquus) and the rib of a large herbivore with anthropogenic marks associated with several small flint artefacts were found. These discoveries provide evidence for the concurrent occurrence of hominins as well on the northern lakeshore at site 12 A (Thieme et al., Reference Thieme, Mania, Urban and van Kolfschoten1993, Thieme, Reference Thieme, Thieme and Maier1995) correlated with the first post-interglacial steppe (open woodland) phase of level 13 II-2 (Urban and Sierralta, Reference Urban, Sierralta and Behre2012) (Figs. 15, 12 A/B). The two micro-charcoal peaks at the top of sub-sublevel II-2c2 and base of II-2c1 of the PRP (Fig. 8) might relate to human activities.
The dry steppe (forest) phase is followed by the tripartite period Reinsdorf B (early part: LPAZ PRP2a1-2a2, layers II-2bc–II-3b1), (middle part: PRP2a3 layers II-3ab to the lower part of II-4e3), (late part: RP2b–RP3, layers II-4e3 upper part–II-4e1) of an increased woody vegetation cover, which developed under alternating wetter and dryer conditions. Aquatic microfossil analyses show increased abundances of oligorheophilic ostracodes and lower numbers of tychoplanktonic diatoms, which indicate a trend towards more stable lake habitats in the middle part. This shift is likely the result of reduced surface stream inflow in favor of groundwater discharge because of increased vegetation cover (Krahn et al., Reference Krahn, Tucci, Urban, Pilgrim, Frenzel, Soulié-Märsche and Schwalb2021). The threefold division of the Reinsdorf B (1, 2, 3) interval (Tab. 1) is also apparent in the interplay between minerogenic input and carbonate precipitation, as well as in the redox conditions and overall biogenic productivity, all indicating variable lake levels during the entire time span. The woodland is characterized by an alternating predominance of Betula and Pinus, whereas Picea and Alnus as well as Larix were very rare during the early part of the first post-interglacial woodland phase, Reinsdorf B1 (Fig. 16). During the middle part of the first post-interglacial woodland phase, the Reinsdorf B2, Betula and Picea are more, and Pinus less widely spread. Larix and Juniperus are rare. Shallowing lake level as a consequence of distinctly increased seasonality (Urban and Bigga, Reference Urban and Bigga2015) can be deduced from the heliophile herbal flora, the shrinking reed belt, and the tendency towards terrestrialization of the lakeshore (Tab. 1, Supplementary Table 1, Figs. 8, 10, 17).
In II-3ab-equivalent layers of the PRP sampling site of the Reinsdorf section (Fig. 3), a nearly complete skull and skeleton of the straight-tusked elephant Palaeoloxodon antiquus and several flakes indicating human activity have recently been recovered from excavations (Serangeli et al., Reference Serangeli, Verheijen, Rodríguez Álvarez, Altamura, Lehmann and Conard2020). This layer is assigned to the early part of the first post-interglacial woodland phase, LPAZ PRP2a1-2a2 (Fig. 16).
The late part of the first post-interglacial woodland phase, the Reinsdorf B3 (Tab. 1) shows a diverse heliophile herbal plant spectrum (Artemisia, Asteraceae, Caryophyllaceae, Rosaceae), a broader reed belt, and higher frequency of taxa such as Typha latifolia, Sparganium, and Ranunculus acris compared to the middle part, and about an equally limited distribution of Betula and Pinus. Very few stands of Alnus must have been present in closer vicinity. Picea and Larix probably had the rarest occurrences on the Elm Mountain range. Peat bog plants such as Myrica, Calluna, Empetrum, Vaccinium, Polypodiaceae, and Sphagnum made up an important part of the local lakeshore vegetation (Fig. 18). Relatively high amounts of Chenopodiaceae suggest local saline stands, as also observed in the dry period of LPAZ PRP1b (Figs. 8, 15). The lake inflows created broad alluvial fans and incorporated pollen derived from interglacial as well as from pre-Quaternary sediment sources (Fig. 8).
As explained, the large terrestrial faunal communities do not exhibit any clear developments along the climatic gradient, in contrast to the plant communities, apart from the early disappearance of Bubalus murrensis. This does not contradict the palynological findings, but rather highlights (1) the exceptional assumed “oasis-effect” of the former lake supporting faunal species during climatic deterioration of the Reinsdorf sequence, which simultaneously could have been causing population changes and extinctions on the landscape level already; and (2) the assumed high adaptive capacity of large terrestrial fauna, allowing shifts of behavior and dietary range and preference to conform with climatically induced changes of plant communities and thus changing habitat quality.
Palynological data obtained from the Reference Profile of the Characeae mud of all of sublevel II-4c (Fig. 10; Urban and Bigga, Reference Urban and Bigga2015) and from the upper part of II-4c of the Zeugenblock (Figs. 3, 8, 10, 19) point to an open landscape with dry and cooler environmental conditions. This period is characterized by a return to increased lakeshore turbulence, pronounced stream activity, and likely cooler temperatures, as indicated by tychoplanktonic diatoms and mesorheophilic ostracodes (Krahn et al., Reference Krahn, Tucci, Urban, Pilgrim, Frenzel, Soulié-Märsche and Schwalb2021). The azonal vegetation of the Reinsdorf C contains wetland plants such as Ranunculus aquatilis, R. acris, R. sceleratus, and R. repens. Mineralized tree rings of very thin Betula trunks that obviously drowned during rising water levels were identified in layer II-4c sediments, which were very rich in Betula sp. pollen. Stands of Betula associated with Pinus are assumed to have existed both on the lowland and on the Elm mountain ridge. Alnus, most probably A. viridis, and Salix occupied riverine stands. Picea pollen values are very low and Picea stands existed probably far from the lake. The main zonal vegetation of the second post-interglacial steppe (open woodland) phase was a grass-rich steppe that was poor in woody species.
As already discussed for the first post-interglacial steppe (open woodland) phase (II-2c1–2c3), the loss of woodland caused a dramatic lake level rise and associated flooding also during LPAZ RP4a and RP4b (II-4c). Increased lake levels supporting diverse aquatic habitats were also deduced from aquatic microfossil analyses (Krahn et al., Reference Krahn, Tucci, Urban, Pilgrim, Frenzel, Soulié-Märsche and Schwalb2021). Furthermore, it is concluded that the seasonally very active braided river courses formed large fluvial fans (Fig. 17). Higher lake levels are further supported by enhanced BiSi contents as well as low C/N ratios, which suggest higher aquatic productivity. The high Fe/Ti point to more oxic conditions in the lake, potentially indicating more turbulence caused by higher activity of the inflows and/or a strengthening in water column mixing due to stronger wind action. The two high charcoal peaks at the top of II-4c, directly underlying the archaeological horizon that contained the spears (II-4ab), suggest that it was most probably humans that caused the burning rather than naturally occurring fire.
Sublevel II-4ab, concordantly overlying layer II-4c (LPAZ RP5), reflects an undisturbed gradual transition (Figs. 4, 8) from the silty, calcareous deposits into an organic mud. During Reinsdorf D, the lake level gradually decreased, and after a previous Betula-rich phase (II-4c, Fig. 8) Pinus expanded again forming stands on the Elm and in the lowland, close to floodplain areas (Fig. 20). Picea stands existed most probably farther from the lake, because pollen is hardly recorded. Alnus cf. A. viridis, Salix, and Betula may have grown along the water courses and on the floodplain as well as along the lake shore. Juniperus could have grown at higher elevations and both on moist, organic and on sandy, dryer soils. Scattered Larix stands are assumed to have occurred on the Elm mountain range. The reed and swamp vegetation types were quite rich in emergent Carex species, Schoenoplectus, Typha, and Ranunculus sceleratus, and in submerged or floating plants such as the salt-tolerant Zannichelia palustris and Myriophyllum spicatum, as well as Potamogeton species, recorded from plant macrofossils and pollen records (Jechorek, Reference Jechorek2000; Urban, Reference Urban, Sirocko, Claussen, Sanchez Goni and Litt2007a, Reference Urban and Thiemeb; Urban and Bigga, Reference Urban and Bigga2015; Bigga, Reference Bigga2018; this paper).

Figure 20. Visualization of landscape and habitats of the second post-interglacial woodland phase LPAZ RP5 (II-4ab) of Reinsdorf D (Table 1) (archaeological horizon of the spears and further lithic, bone, and wooden tools).
The existence of wet meadows is indicated by taxa such as Plantago major/media and Bistorta officinalis. Furthermore, pollen, and spores of Sphagnum in particular, representative of slightly higher nutrient-poor raised bog stands, indicate swampy environments close to the lake. The non-woody zonal vegetation of the lowland was dominated by Poaceae, which most probably also formed the understory of the higher vegetation on the Elm. The drop in carbonate precipitation and associated increase in (terrestrial) bio-productivity support the evidence of further siltation of the lake forming larger shallow-water areas and/or wetlands and swamps.
The depositional environment of archaeological layers 13 II-4c, II-bc, and II-4b (=ab), where flint artefacts, the wooden spears, and bone remains are distributed vertically through several decimeters, concentrated between layers II-4b/c and II-4b/4ab (Thieme, Reference Thieme1997, Reference Thieme, Gamble and Porr2005, Reference Thieme and Thieme2007; Serangeli et al., Reference Serangeli, Rodríguez-Alvarez, Tucci, Verheijen, Bigga, Böhner, Urban, van Kolfschoten and Conard2018, Conard et al., Reference Conard, Serangeli, Bigga and Rots2020), has long been debated among researchers (summarized in Stahlschmidt et al., Reference Stahlschmidt, Miller, Ligouis, Goldberg, Berna, Urban and Conard2015a, Reference Stahlschmidt, Miller, Ligouis, Hambach, Goldberg, Berna, Richter, Urban, Serangeli and Conardb), because it is of great importance for understanding human adaptation during this interval (Fig. 20).
A clear transition from the open Pinus and Betula woodland, which prevailed during the previous LPAZ RP5 (II-4ab) and PRP6a (II-sublevel II-5d2) (Figs. 8, 10, 20) phases, into a steppe-tundra treeless phase is concluded in sub-sublevel II-5c3. Striking decreases of Pinus and Betula and a strong increase of heliophilous herbs (Artemisia, Asteraceae, Chenopodiaceae) and particularly of Poaceae indicate the onset of a dry and cold spell named the post-interglacial steppe-tundra phase PRP6b (sub-sublevel 13 II-5c3) (Fig. 21). During the transition into an early glacial phase of Reinsdorf E, the lake started drying out, as indicated by the organically poor silts and the lack of aquatic and reed plants.

Figure 21. Visualization of landscape and habitats of the post-interglacial steppe-tundra phase LPAZ PRP6b (sub-sublevel 13 II-5c3) of Reinsdorf E (Table 1).
Paleoclimate and correlation of the Reinsdorf sequence
Based on the palynological record of the PRP and the Zeugenblock and previous data, the Reinsdorf sequence consists of early- and late-temperate interglacial periods (Reinsdorf interglacial s. str. of Urban, Reference Urban1995) followed by two post-interglacial dry steppe (open woodland) and two moister post-interglacial woodland phases, with the first (tripartite) woodland phase comprising levels II-2bc–II-4e1. All these oscillations were previously termed interstadials and stadials (Urban, Reference Urban, Sirocko, Claussen, Sanchez Goni and Litt2007a, b). Urban and Bigga (Reference Urban and Bigga2015) later revised this subdivision; however, Krahn et al. (Reference Kasper, Wang, Schwalb, Daut, Plessen, Zhu, Mäusbacher and Haberzettl2021), Tucci et al. (Reference Tucci, Krahn, Richter, van Kolfschoten, Rodríguez Alvarez, Verheijen, Serangeli, Lehmann, Degering, Schwalb and Urban2021), and data presented in this paper clearly show that, during the post-interglacial Reinsdorf sequence, aquatic microfossils as well as the zonal vegetation and particularly the small mammalian fauna changed in relation to temperature and precipitation (Fig. 10).
Mainly based on the palynological and aquatic microfossil results (Krahn et al., Reference Krahn, Tucci, Urban, Pilgrim, Frenzel, Soulié-Märsche and Schwalb2021), but also supported by the geochemical and sedimentological findings, we are able to modify the previous subdivision of Urban (Reference Urban, Sirocko, Claussen, Sanchez Goni and Litt2007a) and Urban and Bigga (Reference Urban and Bigga2015). From post-interglacial level II-2c3 (LPAZ PRP1a) upwards, the Reinsdorf sequence can be separated into two dryer and cooler periods (Reinsdorf A and Reinsdorf C, Figs. 15, 19) and two woodland phases, Reinsdorf B (B1–B3) and Reinsdorf D, while the steppe (woodland) sub-phase Reinsdorf B2 represents a cooler and dryer phase of the post-interglacial woodland phase Reinsdorf B (Table 1).
Based on previous biostratigraphic evidence and recent radiometric dating (Urban, Reference Urban1995, Reference Urban, Sirocko, Claussen, Sanchez Goni and Litt2007a; Urban et al., Reference Urban, Sierralta and Frechen2011; van Kolfschoten, Reference van Kolfschoten and Behre2012a, Reference van Kolfschoten2014; Sierralta et al., Reference Sierralta, Frechen, Urban and Behre2012, Reference Sierralta, Urban, Linke and Frechen2017; van Kolfschoten et al., Reference van Kolfschoten, Buhrs and Verheijen2015a; Richter and Krbetschek, Reference Richter and Krbetschek2015; Urban and Bigga, Reference Urban and Bigga2015; Kunz et al., Reference Kunz, Urban and Tsukamoto2017; Tucci at al., Reference Tucci, Krahn, Richter, van Kolfschoten, Rodríguez Alvarez, Verheijen, Serangeli, Lehmann, Degering, Schwalb and Urban2021), the entire Reinsdorf sequence has been correlated tentatively with Marine Isotope Stage (MIS) 9 (Liesicki and Raymo, Reference Liesicki and Raymo2005). The first post-interglacial steppe (open woodland) phase (LPAZ PRP1a and PRP1b) (Fig. 15) has been assigned to MIS 9d and the preceding Reinsdorf interglacial to MIS 9e (Tucci et al., Reference Tucci, Krahn, Richter, van Kolfschoten, Rodríguez Alvarez, Verheijen, Serangeli, Lehmann, Degering, Schwalb and Urban2021). Based on the available ages derived from the Reinsdorf sequence (Tucci et al., Reference Tucci, Krahn, Richter, van Kolfschoten, Rodríguez Alvarez, Verheijen, Serangeli, Lehmann, Degering, Schwalb and Urban2021) and the high-resolution new proxy data, the temporal coverage probably spans parts of MIS 10a, the entirety of MIS 9, and part of MIS 8c (Fig. 22).

Figure 22. δ18O benthic foraminifera stack with indicated marine isotope stages (MIS) 10a to 8c (Lisiecki and Raymo, Reference Liesicki and Raymo2005), obliquity (OBL), and insolation difference (Laskar et al., Reference Laskar, Robutel, Joutel, Gastineau, Correia and Levrard2004) compared to main environmental and climatic proxies (TOC, Ca/Ti, percentages of Cyperaceae, Ericales, trees and shrubs, Poaceae, and charophyte gyrogonite concentrations) derived from the Reinsdorf sequence. To enhance visibility of small-scale variability and congruence of curve patterns, TOC and Ericales were log-scaled and the axis of Ericales was inverted. Light red and blue shading indicate the MIS and were matched to the Reinsdorf sequence according to age estimates from Tucci et al. (Reference Tucci, Krahn, Richter, van Kolfschoten, Rodríguez Alvarez, Verheijen, Serangeli, Lehmann, Degering, Schwalb and Urban2021) (see main text for details).
The fundamental driving forces that controlled environmental and climatic conditions during the covered time span are orbital parameters (Laskar et al., Reference Laskar, Robutel, Joutel, Gastineau, Correia and Levrard2004). Obliquity (tilt of the Earth's rotation axis) is widely accepted as the primary influence of onset and termination of (inter)glacial periods due to changes in overall summer insolation and changes in the amount of insolation at higher latitudes (Berger, Reference Berger1978; Laskar et al., Reference Laskar, Robutel, Joutel, Gastineau, Correia and Levrard2004). Thus, obliquity is assumed to affect the strength of seasonal differences on a global scale. In combination with the dynamics of the remaining orbital parameters (i.e., precession and eccentricity) the resulting isolation acts as the overall climatic driver. When it comes to seasonal differences, the insolation can be used to derive a parameter that has been termed seasonal heating (Zebiak and Cane, Reference Zebiak and Cane1987; Rein et al., Reference Rein, Lückge, Reinhardt, Sirocko, Wolf and Dullo2005; Kasper et al., Reference Kasper, Wang, Schwalb, Daut, Plessen, Zhu, Mäusbacher and Haberzettl2021) and is basically the difference between mean summer (June, July, August = JJA) and mean winter (December, January, February = DJF) insolation. A higher difference between summer and winter insolation therefore is assumed to indicate a stronger seasonal gradient in temperature and enhanced seasonality (and vice versa).
Thus, we compared the environmental dynamics derived from the Reinsdorf sequence with the insolation difference at 52°N (Laskar et al., Reference Laskar, Robutel, Joutel, Gastineau, Correia and Levrard2004). During the initial phases of MIS 9e (level 13 II-2c4/5), 9c (level 13 II-2bc), and 9a (level 13 II-4c and transition to 4bc), environmental conditions at Schöningen tended to be more dynamic with high rates of overall biogenic productivity and fairly enhanced carbonate precipitation in the lake. This might have been driven by higher moisture availability due to stronger seasonal heating (Fig. 21), with associated higher temperatures and thus stronger evaporation. High internal variability, but generally enhanced biogenic productivity and strong carbonate precipitation during MIS 9c in the Reinsdorf sequence, matches the strong seasonal heating during that time. However, the partly high internal environmental variability and dynamic nature of the climate during that particular phase suggest influence from small-scale local and regional processes on the system.
To date, correlatives to the Reinsdorf interglacial and the post-interglacial Reinsdorf sequence that follows the Holsteinian (MIS 11) and precedes the Schöningen interglacial (MIS 7) (Urban, Reference Urban, Sirocko, Claussen, Sanchez Goni and Litt2007a) have barely been found in Germany or in the broader region. Based on palynological data, the section of Ummendorf (Aller Valley, Saxony-Anhalt) (Strahl, Reference Strahl, Wansa, Strahl and Rappsilber2019), ~40 km away from Schöningen where three interglacials (Holsteinian, Horstwiesen, and Dömnitz) (Erd, Reference Erd1973) are superimposed on Elsterian sediments and underlie the Drenthe till, currently correlates best with the Schöningen sequence (Tucci et al., Reference Tucci, Krahn, Richter, van Kolfschoten, Rodríguez Alvarez, Verheijen, Serangeli, Lehmann, Degering, Schwalb and Urban2021). The botanical record of the Horstwiesen interglacial is very similar to the interglacial vegetation development of the Reinsdorf interglacial showing, for example a characteristic predominance of Carpinus over Abies, the occurrence of Pterocarya and Azolla filiculoides and of Larix in late-temperate interglacial phases. Unfortunately, the Ummendorf Horstwiesen interglacial is truncated and lacks post-interglacial phases as recorded in the Reinsdorf record.
The middle unit of the middle Pleistocene channel deposits of Cudmore Grove from coastal sites in Essex, United Kingdom, assigned to MIS 9 based on mammalian bio- and aminostratigraphy (Roe et al., Reference Roe, Coope, Devoy, Harrison, Penkman, Preece and Schreve2009), seems to reveal several congruencies with the Reinsdorf interglacial. A number of paleobiological indicators including plant remains, vertebrates, molluscs, and beetles point to a forested, temperate phase, which is palynologically characterized by rather low amounts of Abies and somewhat higher values of Carpinus during the late-temperate interglacial phase. Similar to the Reinsdorf (Fig. 8), megaspores of Azolla filiculoides occurred during the late-temperate interglacial phase of Cudmore Grove. The rather low amounts of Taxus in this section as well as in Reinsdorf LPAZ R3b are another obvious similarity. Beetles have been used for Mutual Climatic Range reconstructions, suggesting that mean temperature of the warmest month was ~2°C higher, whereas mean January temperatures might have been slightly colder than modern values for the Essex region. The occurrence of Acer tataricum and additional thermophile taxa in late-temperate phases of the Reinsdorf interglacial (Fig. 13) suggest 2.5°C warmer July temperatures than modern values for the region of Helmstedt in Lower Saxony, Germany. Similar to the Ummendorf Horstwiesen interglacial, the sequence of Cudmore Grove does not reveal post-interglacial phases.
The long terrestrial Pleistocene sequence spanning the past ca. 450 ka from maar craters in the region of the Velay in the French Massif Central (de Beaulieu et al., Reference de Beaulieu, Andrieu-Ponel, Reille, Grüger, Tzedakis and Svoboda2001) is one of the most, if not the most, continuous and complete section to be found in Western Europe. The Landos interglacial (MIS 9e) has been correlated with the Reinsdorf interglacial due to similarities of vegetation development (de Beaulieu et al., Reference de Beaulieu, Andrieu-Ponel, Reille, Grüger, Tzedakis and Svoboda2001; Urban, Reference Urban, Sirocko, Claussen, Sanchez Goni and Litt2007a). Based on our new high-resolution data, it seems obvious that the post-MIS 9e interglacial vegetation development reflects gradual climatic changes during MIS 9d–MIS 9a, as might also be concluded from the Velay pollen record of the post-interglacial phases Cayres (MIS 9d), Ussel (MIS 9c), Monteils (MIS 9b), and Amargiers (MIS 9a).
CONCLUSIONS
High-resolution paleoenvironmental analyses of the Para-Reference Profile (PRP) 13 II (2014) and Zeugenblock (ZB) 13 II (2018) of the Reinsdorf sequence have provided much more precise and comprehensive data about the nature of the sediment levels of the middle Pleistocene five-part sequence Schöningen 13 II than previous research. We first show that pollen concentration is not linked to any particular taphonomical parameter and conclude that pollen spectra reflect well the local and regional vegetation in relation to the climatic and terrestrial environmental conditions. Based on our findings, and by applying ecological models on megafauna-vegetation/-environment interactions, landscape visualizations of the 10 most characteristic layer-specific local pollen assemblage zones through the Reinsdorf sequence have been constructed. They provide excellent reflections of the landscape, vegetation, and climate dynamics in relation to archaeological evidence of human occupation during this interglacial-glacial cycle.
Correlation of the Reinsdorf sequence sensu stricto to the marine isotope sub-stages (MIS) 9e–9a, in combination with previous radiometric evidence, has provided much greater comprehension of the geochemical record of the limnic sediments, long-distance correlation of the vegetation pattern, and the tentative correlation of the Reinsdorf sequence with the δ18O global benthic foraminifera stack.
Acknowledgments
We thank the Ministry of Science and Culture, Hannover, Germany (Urban and Tucci, PRO*Niedersachsen, Projekt: 74ZN1230) and the German Science Foundation (DFG: UR25/11-1, SCHW671/22-1, project number: 350769604) for funding this study. We thank Annabell Rickert and Luisa Geilhausen for valuable assistance with laboratory work and Lisa Brogmus and Michael Hein for help in creating illustrations. We acknowledge Nicholas Conard as director of the Project Schöningen, Thomas Terberger from Niedersächsisches Landesamt für Denkmalpflege (NLD) Hannover, as well as the excavation team directed by Jordi Serangeli for their support of this research. The authors wish to thank A. Peter Kershaw for critically reading the manuscript. We are indebted to the two reviewers, Donatella Magri and Phil Gibbard, and to the editors for their constructive and very valuable comments that significantly helped to improve our manuscript.
Supplementary material
The supplementary material for this article can be found at https://doi.org/10.1017/qua.2022.65


 Open access