


Introduction
The Dye 3 core was drilled in south Greenland at 65˚19’ N, 43˚82’W between 1979 and 1981 and reached a depth of 2037.8 m. More than 25 m of silty ice were recovered at the bottom where a temperature of about –12˚C was measured. This silty ice is named after the evenly distributed silty and sandy particles that it contains, the mean concentration of which is 0.03% by weight (Reference ThorsteinssonThorsteinsson, 1990). the transition from debris-free ice to silty ice is, however, quite subtle, and a broad layering is discernible along the bottom part of the core, with some layers gently tilted away from horizontal.
The complete δ18O profile of the top 2000 mof glacier ice above the silty ice was discussed and interpreted on palaeoclimatic grounds by Reference DansgaardDansgaard and others (1982). More recently, a detailed study of δ18O and gas properties (CO2 concentration, O2 /N2 ratio, total gas content) was carried out in the bottom 27 m of the core (the silty ice) by Reference Souchez, Bouzette, Clausen, Johnsen and JouzelSouchez and others (1998).
In this paper, we increase the resolution of the pre-existing CO2 measurements in the silty ice and correlate them with a completely new dataset of CH4 measurements at the same resolution. As we will show, this comparison with methane concentration (of which only a couple of values were available until now (Reference LeuenbergerLeuenberger, 1992)) gives us a clearer picture of the complex dynamical processes occurring at the base of the Greenland ice sheet.
Results and Discussion
Gas measurements (CH4 and CO2) were performed in Brussels by gas chromatography (Chrompack 9001), using the melting–refreezing method (Reference Raynaud, Chappellaz, Barnola, Korotkevich and LoriusRaynaud and others, 1988). Methane was measured with a flame ionization detector, and carbon dioxide with a thermal conductivity detector. Three successive injections from the same extracted air have been analyzed and the system calibrated using adequate standard mixtures. for this study, 35 samples were analyzed, with a 1σ error of 0.7% for methane and 1.4% for carbon dioxide.
Comparison of ``twin samples’’ at various depths between our CO2 results and those obtained by Reference Souchez, Bouzette, Clausen, Johnsen and JouzelSouchez and others (1998) using a dry-extraction technique shows close agreement. This suggests that no significant bias has resulted from using the wet-extraction technique, at least at the level of precision required in the present study.
Results of gas measurements are shown in Figure 1a. the first three samples in the profile (2010–2012.6 m), which are from the debris-free ice above the first visible silty-ice inclusions, show concentrations around 450 ppmv in carbon dioxide and 2 ppmv in methane, which are close to meteoric-ice values. Concentrations up to 34550 ppmv for CO2 and 6850 ppmv for CH4 are reached further down, near the bottom of the profile. These high values show that gas characteristics in the basal ice are derived from the subglacial substratum (Reference Souchez, Lemmens and ChappellazSouchez and others, 1995). It is worth comparing the Dye 3 maximum values with those observed by the latter authors in the basal ice of the Greenland Icecore Project (GRIP) core in central Greenland (72˚34’N, 34˚34’W). the CH4 reaches similar maximum concentration levels (6000 ppmv at GRIP), while the maximum concentration of CO2 at Dye 3 only overlaps the lower range of CO2 concentration at GRIP (GRIP maximum is 130 000 ppmv). Between the debris-free–silty ice transition (2012.6 m) and 2032.5 m depth, at Dye 3, the concentrations increase slowly, from 1200 to 4800 ppmv for CO2 and from 60 to 200 ppmv for CH4. the methane concentration is in good agreement with the one measured by Reference LeuenbergerLeuenberger in 1992 (143 ppmv at 2030.2 m depth). In the lower part of the profile (2032.5–2037.8 m depth), concentrations show larger variations (3000–34550 ppmv for CO2 and 80–6850 ppmv for CH4). Along the whole profile, CH4 and CO2 concentrations are closely related, peaks and troughs in the concentrations occurring at the same depths.
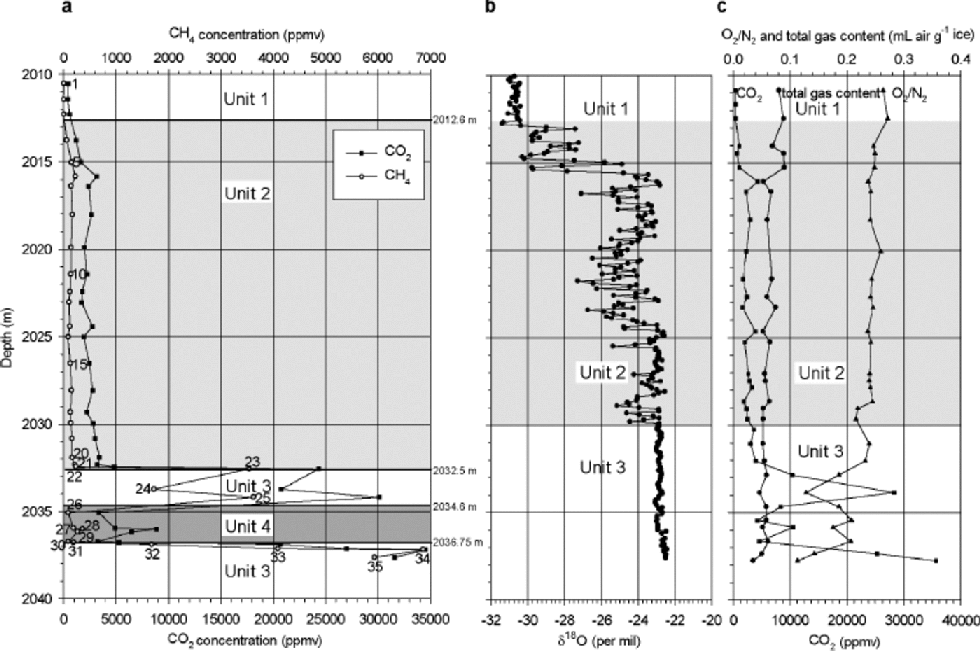
Fig. 1 (a) CO2and CH4 concentration, (b) δ18O values and (c) CO2concentration, O2/N2 ratio and total gas content profiles of the basal ice from the Dye 3 core. (a) gives the results of the present study; (b, c) are from Reference Souchez, Bouzette, Clausen, Johnsen and JouzelSouchez and others (1998).
Proposing a stratigraphy based on the CO2–CH4 relationship
Figure 2 shows the concentration of CO2 vs the CH4 concentration for the samples from the silty ice of the Dye 3 core. on this diagram, four different relationships are displayed. By contrast, a unique relationship was obtained by Reference Souchez, Lemmens and ChappellazSouchez and others (1995) in the silty ice of the GRIP ice core (crosses and dotted line in Fig. 2). the measured values fall along distinct straight lines with striking differences in slopes and concentration ranges, depending on the sample’s location in the core. Transitions from samples on one trend line to those on another coincide with clear-cut visual contrasts in debris load along the core (Fig. 3). These relationships lead us to define four corresponding units.
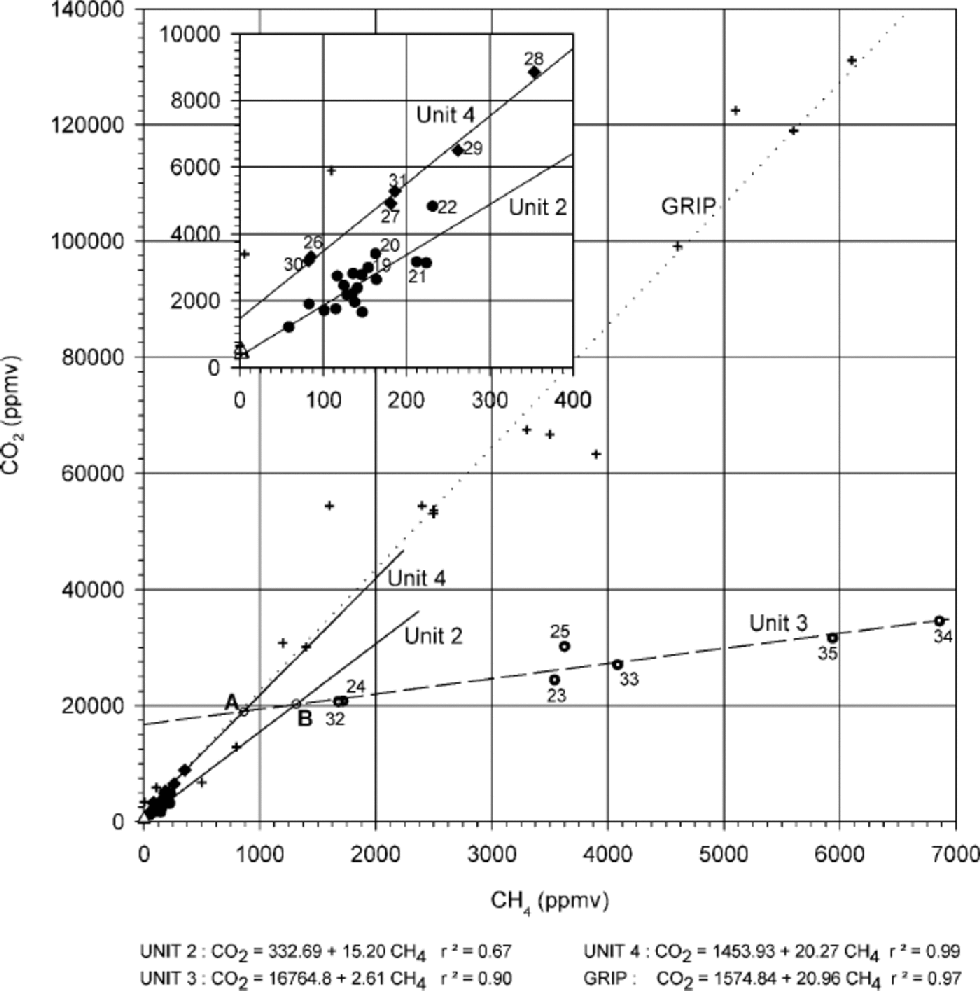
Fig. 2 The CO2–CH4 relationships in the basal part of the Dye 3 core. Meteoric-ice samples (unit 1: open triangles; sample Nos. 1–3), unit 2 samples (circles, 4–22), unit 3 samples (dotted circles, 23–25 and 32–35) and unit 4 samples (diamonds, 26–31) are represented with their respective regression lines. Crosses represent the basal ice from the GRIP ice core (from Reference Souchez, Lemmens and ChappellazSouchez and others, 1995). Inset: enlarged diagram of the lowest-concentration area.
In Figure 2, open triangles represent the three debris-free meteoric-ice samples forming unit 1 (samples 1–3 in Fig. 1a). This unit corresponds to a cluster of points. the CO2 and CH4 concentrations of ice samples from the upper part of the Dye 3 silty ice (unit 2: samples 4–22 in Fig. 1a; black circles in Fig. 2) show a linear relationship. the range of concentration values is small and the correlation strength moderate (r2 =0.67 However, the regression line intersects the group of points representing the debris-free meteoric-ice samples (open triangles of unit 1in Fig.2), and the correlation strength increases to 0.83 when these samples are included. Another linear relationship (r2 = 0.90) with smaller slope and larger concentration range, is inferred for the debris-richer ice samples from the lower part of the Dye 3 silty ice (unit 3: samples 23–25 and 32–35 in Fig. 1a; dotted circles in Fig. 2). Finally, yet another strong linear relationship (r2 = 0.99)characterizes a 2 m thick layer (unit 4: samples 26–31 in Fig. 1a; diamonds in Fig. 2) with distinctively lower debris content, embedded in unit 3.
Two important features need to be pointed out from the trend lines in Figure 2, that will be useful in further interpreting the stratigraphy:
(a) the gross similarity between the slopes (s) of the regression lines obtained for the samples in units 2 and 4, and also for the GRIP core samples (s =15–21), is in strong contrast with the much lower value (s = 2.61) obtained for the samples from unit 3.
(b) At higher resolution (inset of Fig. 2), there is a clear contrast in behaviour between samples from units 2 and 4, the latter showing a distinctly stronger correlation (0.99 vs 0.67), a slightly higher slope of the trend line (20.27 vs 15.20) and a higher independent term (1453.9 vs 332.7 ppmv).
Coherence with the previous ``stable-isotope/gas’’ stratigraphy
Reference Souchez, Bouzette, Clausen, Johnsen and JouzelSouchez and others (1998) defined three major units from the variations of δ18O with depth (Fig. 1b): units 1 (2008.6– 2012.6 m) and 3 (2030–2037.8m) both showing surprisingly constant values, and unit 2 (2012.6–2030m) with δ values characterized by large and rapid variations. They showed that tight links do exist between the δ18O and the gas properties in the silty ice (Fig.1c). Their main statements are the following: unit 1 shows gas and isotopic properties of ``ice-sheet’’ ice. In unit 2 (Fig.1b and c), both δ18O and gas parameter (CO2,O2 / N2 and total gas content) are correlated, which is a strong argument in favour of a mixing process in different proportions between two end-members of fixed isotopic and gas characteristics. This correlation between δ18O and gas parameters is negative or positive depending on the relative composition of each of the end-members involved in the mixing. Finally, in unit 3 (Fig. 1b and c), no correlation is found between δ18O and gas parameters, but a strong correlation exists between the latter, which does not preclude mixing, if the two end-members have similar δ18O values. the interpretation given by Reference Souchez, Bouzette, Clausen, Johnsen and JouzelSouchez and others (1998) is that unit 3 results from the mixing of two end-members with strongly contrasted gas properties and weakly contrasted isotopic signature, whilst unit 2 results from mixing between the bottom of unit 1 and the top of unit 3.
The increased resolution of the CO2 measurements and the comparison with the CH4 record allows interesting tuning of this initial stratigraphy. There are two significant discrepancies: a shift in the limit between units 2 and 3 downward by about 1.5 m, and the presence of a fourth unit (Fig. 1a and b). Samples 19–22 correspond to those considered by Reference Souchez, Bouzette, Clausen, Johnsen and JouzelSouchez and others (1998) as the top of unit 3 on the basis of the δ18O values. Since these samples show CH4 and CO2 levels and CO2/CH4 ratios typical of unit 2 (Fig.2) and very distinct from unit 3, they should be a part of unit 2. This does not contradict the data interpretation from 1998 since:
(a) High values of δ18O with low variability exist higher up in unit 2 (e.g. 2025.5–2027m; Fig. 1b), and
(b) Samples19–22 are at the hinge between unit 2 and unit 3 curves in figure 3b and c of Reference Souchez, Bouzette, Clausen, Johnsen and JouzelSouchez and others (1998), and can therefore be attributed to either of those two.
Samples 23–35 are all part of unit 3 as defined by Reference Souchez, Bouzette, Clausen, Johnsen and JouzelSouchez and others (1998). In this unit, characterized by a homogeneous isotopic profile, only the gas properties can be used as tracers of possible mixing processes. However, looking at the CO2–CH4 relationship (Fig. 2), unit 3 of Reference Souchez, Bouzette, Clausen, Johnsen and JouzelSouchez and others (1998) is clearly made up of two groups of samples:
Samples 23–25 and 32–35 showing a very strong CO2– CH4 correlation (0.90) with a slope of 2.61, and generally higher CH4 and CO2 concentrations, and
Samples 26–31 showing low CH4 and CO2 concentrations and a strong correlation (0.99) but with a much higher slope of 20.27, close to that of the best-fit line of the GRIP samples (20.96) and to that defined for unit 2 (15.20).
This has led us to distinguish unit 4, embedded into unit 3. Finally, it should be stressed that visual examination and discrete measurements (Reference ThorsteinssonThorsteinsson,1990) of the dirt content in the core (Fig. 3) clearly lend further support to this new stratigraphical approach.

Build-up of the basal-ice sequence
The contrasted linear relationships of CO2 and CH4 in Figure 2 are thought to be indicative of distinct mixing events between different end-members (i.e. between ice of local origin and ice-sheet ice flowing from upstream), leading to the progressive build-up of 25m thick basal ice at Dye 3, which has taken place along the basal flowline up-glacier from the drill site.
Any attempt to reconstruct this progressive build-up will have to integrate the following statements:
(a) Unit 1 represents debris-free meteoric glacier ice.
(b) Build-up of unit 2 must be the first step (and thus the oldest) of the sequence, since unit 1is one of its end-members. Indeed, the regression line of unit 2 is the only one which intersects the cluster of points representing the meteoric-ice samples (unit 1).
(c) Unit 2 shows the weakest regression coefficient along the trend line, indicative of dispersion of the samples around the mixing lines.
(d) the lower end-member at the origin of unit 2 shows a CO2/CH4 ratio that is similar to that of GRIP. Although the nature of the various chemical processes leading to this CO2/CH4 balance in the ice is still a major unknown, such values of the ratio could be indicative of similar sub-or pre-ice-sheet environmental conditions. In the case of GRIP, several arguments (see, e.g., Reference Souchez, Lemmens and ChappellazSouchez and others, 1995; Reference SouchezSouchez, 1996; Reference Tison, Souchez, Wolff, Moore, Legrand and de AngelisTison and others, 1998) are in favour of biologically mediated redox reactions with organic matter, drastically increasing the CO2 concentration relative to the CH4 in the local end-member. the observed methane concentration in this local end-member could result either from local bedrock gas diffusion or from biological processes.
(e) Unit 3, being the lowest, is likely to be the youngest, and built from interactions with the local end-member in the vicinity of the Dye 3 ice–bedrock interface. This local end-member obviously has a much lower CO2 content for equivalent CH4 concentration, because the slope of the unit 3 regression line is smaller than the others. This could be explained by a different balance between bedrock gas diffusion and biological processes in the local end-member.
(f) Samples from unit 4, although close to those of unit 2 (Fig. 2), show a much stronger CO2/CH4 correlation. They also systematically have higher CO2 concentration than unit 2 and show a somewhat higher dirt content (0.05 weight per cent vs a mean value of 0.03 for unit 2 (Reference ThorsteinssonThorsteinsson, 1990)). the slope of the CO2/CH4 regression line is nearly identical to those at GRIP and in unit 2.
Bearing these characteristics in mind, we propose two plausible build-up scenarios, as schematically illustrated in Figure 4. A first step, common to both scenarios, occurs close to the central part of the ice sheet. Mixing interaction between the ice-sheet ice and a local ice component at the ice–bedrock interface builds a complete unit 2, resulting in a profile similar to that observed at GRIP, for example. Whilst the lower part of this unit remains in a local low-bedrock area, decoupling occurs and the upper part of unit 2 is entrained further downstream. Deformation around subsequent bumps is likely to result in the vertical thickening of unit 2 by further incorporation and mixing with higher levels from unit 1. Dilution of the signal (i.e. gas concentration) and hence dispersion of the sample points around the mixing trend line occurs along the flowline, eventually combined with small-scale diffusion and chemical reactions within the ice. Further downstream, in the next suitable area, the process is repeated twice to integrate either unit 4 and then unit 3 (Fig. 4A) or unit 3 and then unit 4 (Fig. 4B). In both alternatives, shearing and folding associated with an irregular bed are needed to explain the observed stratigraphy.

Fig. 4 Schematic sketch of the progressive build-up of basal ice through time and space, along a streamline that passes by the Dye 3 core. Depths of boundaries between units are arbitrary. Dashed line stands for a given tracer (e.g. gas concentration).
Our experience from the GRIP core shows that, in the course of a single flow-induced mixing event, the general trend is towards higher concentration of the gas tracers closer to the bedrock. This lends some support to scenario A, since in scenario B, unit 4, which is the youngest in the sequence and the closest to the bedrock, shows low concentration levels of the order of magnitude of those encountered in the upper part of unit 2, and in the top metre of the GRIP basal-ice sequence. Unfortunately, the mixing trend lines of Figure 2 do not bring any further decisive argument since the top end-member of unit 3 could undiscernibly be issued from bottom layers of unit 2 (B scenario) or unit 4 (A scenario). It is interesting to note, in this regard, that in both cases, the best candidates for the upper end-member of unit 3 (point A or B in Fig. 2 depending on the scenario) are not observed in the profile. Furthermore, our high-resolution record lacks sample points showing mixing signatures close to these end-members. This suggests important lamination of the bottom of units 2 and 4 after the building of unit 3. the same process probably explains that no sample with unit 4 characteristics is detected on the top of unit 3 (note, however, that sample 22, located at the hinge, is intermediate between units 2 and 4 in the insert of Figure 2).
In both scenarios, it is clear that similar heavier isotopic values, not related to climate, characterize the local end-member of all mixing processes. Finally, if scenario A applies, it appears (Fig. 4) that there might be a strong contrast in the environmental conditions characterizing the local end-members of the mixing processes between the central and the marginal parts of the ice sheet. These conditions result from the balance between gas diffusion from bedrock and the effective set of redox reactions occurring in the ice, which strongly depends on the local type and availability of the oxidizer (O2, NO3 –, H2O, SO4 2–, fermentation).
Conclusion
The CO2 /CH4 relationship in the basal ice of the Dye 3 core can be used as a powerful tool to decipher the complex rheological behaviour of the basal part of the ice sheet along a given flowline. It involves a progressive build-up and strong deformation of a basal ice layer, reaching 425 mthickness at the site. These processes take place as a succession of local ice accretion and mixing events in zones of high deformation and relatively low displacement. Decoupling at some level of the local mixing sequence results in the downstream export of its upper part, which undergoes both thinning at its base from severe laminations and thickening, through further mixing with the unit above, around larger-scale obstacles. Further downstream, in a suitable location, the bottom of the mixing unit forms the top end-member of a new accretion–mixing event. the contrasted slopes of the various mixing trend lines observed at Dye 3 reflect the different environmental conditions characterizing the local end-members. the basal ice build-up process we describe here is coherent with the large bedrock undulations observed upstream from the drilling site (Reference Overgaard, Gundestrup, Langway, Oeschger and DansgaardOvergaards and Gundestrup, 1985) and with Reference Reeh, Johnsen, Dahl-Jensen, Langway, Oeschger and DansgaardReeh and others’ (1985) choice of a perturbation flow model to date the Dye 3 ice core.
Acknowledgements
R. Souchez is acknowledged for his constructive comments. the authors wish also to thank the two anonymous reviewers for markedly improving the quality of the manuscript. J.-L. Tison is Research Associate at the Belgian National Fund for Scientific Research (FNRS).


