


INTRODUCTION
Meta-analysis has and will very likely continue to gain momentum in second language (L2) research. A key requirement for developing replicable meta-analytic L2 research, however, is that at least two independent L2 experts would agree on the assignment of the study features (i.e., moderators) in their coding scheme to the actual studies collected from the literature. Establishing such interrater reliability (IRR) has at least two crucial functions. First, it helps to determine the degree to which assignment of codes to studies has resulted from expert judgment rather than occurring by chance (reliability function). Second, it allows the meta-analysts to locate the source of their disagreements and modify their code assignments in their coding sheets accordingly (diagnostic function). Despite these two critical functions, research (e.g., Belur et al., Reference Belur, Tompson, Thornton and Simon2018; Raffle, Reference Raffle2006) has consistently shown that the use of IRR analyses is largely absent in many meta-analyses.
Indeed, an inspection of the recent L2 meta-analyses (N = 34) published between 2014 and 2019 in 14 L2 journalsFootnote 1 reveals a similar trend in L2 research. This trend is depicted in Figure 1 (to reproduce Figure 1 see: https://github.com/hkil/m/blob/master/1.r). As can be seen, more than 35% (n = 12) of the L2 meta-analyses published in the aforementioned period either did not report any measure of IRR (i.e., NA) or did not specify what IRR measure they used and what their results were (i.e., Unclear). Nearly 53% (n = 18) only relied on the raw agreement percentage (i.e., %Agreement) that has been historically criticized for its inappropriateness (Cohen, Reference Cohen1960; also see next section). And only less than 12% (n = 4) of the L2 meta-analyses used Kappa statistic or mixed that with a raw agreement percentage (i.e., Mixed).
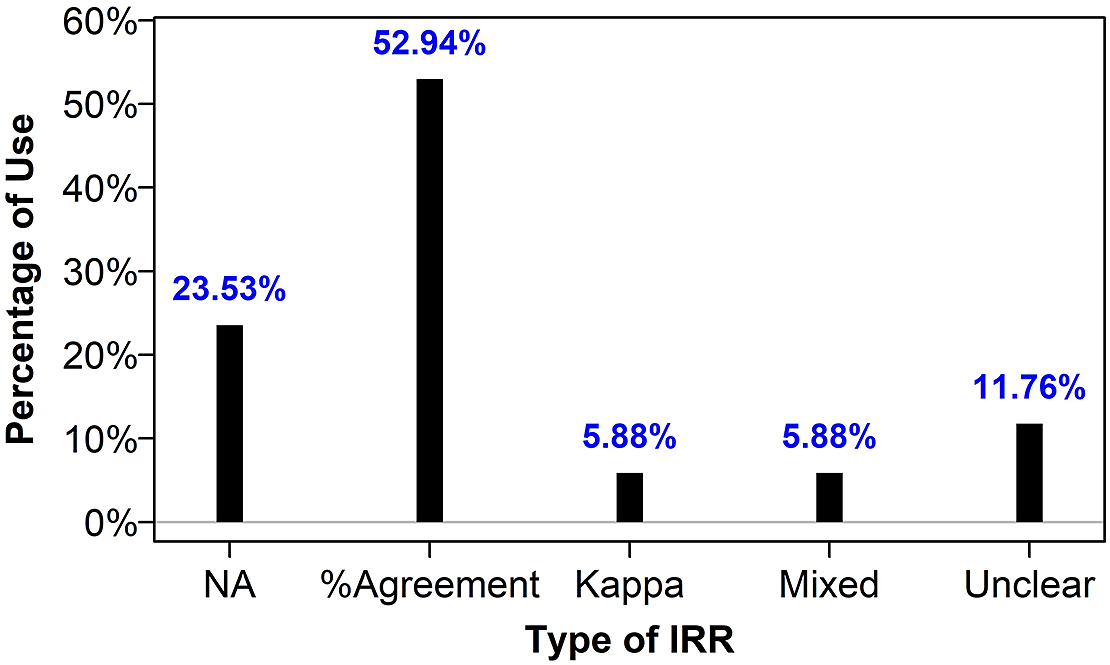
FIGURE 1. IRR reporting in L2 meta-analyses (2014−2019).
In this article, I argue that the limited use of appropriate IRR measures particularly in L2 meta-analyses is rooted in two issues: (a) the paucity of nontechnical information regarding the role of IRR in meta-analytic studies and, (b) the practical difficulty in implementing the two aforementioned functions of IRR in meta-analytic research given the number and nature of the categorical moderators employed in L2 meta-analytic research. To respond to these needs, I cover six important areas in this article. First, I discuss the foundation of IRR in the context of meta-analytic research. Second, I introduce two IRR measures (i.e., S index and Specific Agreement [SA]) that fulfill the reliability and diagnostic functions of IRR in meta-analytic research in a nontechnical (i.e., without emphasizing formulae or distributional properties of IRR measures) manner. Third, I discuss an IRR measurement difficulty that arises due to the specific nature of categorical moderators used in meta-analysis. Fourth, I offer a flexible R program, meta_rate, that efficiently accommodates the two functions (i.e., reliability and diagnostic) of IRR taking into account the specific nature of each moderator. Fifth, I apply the IRR program to an actual L2 meta-analytic coding sheet to demonstrate the practical use of the IRR methods discussed in the present article. Finally, I provide interpretive guidelines as well as a standard reporting protocol (i.e., appropriate tables and figures) to promote transparent reporting of IRR measures in L2 meta-analyses.
THE FOUNDATION OF INTERRATER RELIABILITY IN META-ANALYSIS
Many L2 researchers appreciate the ability of meta-analytic methods to provide a systematic way of synthesizing a body of L2 research. However, replicability of such research crucially depends, among other things, on the quality of the human coders’ judgment who prepare the meta-analytic coding sheets (see Krippendorff, Reference Krippendorff2019; Raffle, Reference Raffle2006). The quality of coders’ judgment, nonetheless, seems to depend on a host of competing factors. For example, it is expected that as coders code more studies, they make more accurate use of their coding scheme. However, such gains in accuracy may be adversely affected by, for example, a fatigue factor that accumulates over time during the coding process (see Clark, Reference Clark2008; Lombard et al., Reference Lombard, Snyder‐Duch and Bracken2002; Rousson et al., Reference Rousson, Gasser and Seifert2002). Furthermore, even when coders fully agree on the definition of a study moderator before coding, they may each make different inferences as to how that definition may apply to each individual study at the time of coding (see Armstrong et al., Reference Armstrong, Gosling, Weinman and Marteau1997; Cooper, Reference Cooper2017; Krippendorff, Reference Krippendorff2019).
No matter the source, such differential application of the coding scheme to individual studies could both systematically (e.g., misapplying moderators to studies in consistent ways) and unsystematically (e.g., occasional irregularities in coding) bias the results of meta-analytic research weakening the prospects for its replicability. The extent to which such unreliability might be present in a meta-analytic coding sheet must be closely understood, evaluated, and addressed using appropriate IRR measures (Cooper, Reference Cooper2017).
APPROPRIATE IRR MEASURES IN META-ANALYSIS: RELIABILITY FUNCTION
Coding schemes developed for L2 meta-analyses predominantly involve categorical moderators that are informed by researchers’ substantive knowledge as well as the actual realizations of those categories in the published literature. Categorical moderators may also arise in situations where naturally continuous variables (e.g., the time interval between a treatment and a posttest in weeks) may (a) occur in a fairly piece-wise and spread-out fashion (e.g., when sorted: 2, 4, 8, 10, 25, 28 in weeks) in the literature and/or (b) need to be categorized to create theoretically informative benchmarks (e.g., 4 ≤ short, 5 ≤ medium ≤ 10, long ≥ 11 in weeks) in any specific domain of L2 research. Either way, because such moderators will eventually determine the magnitude of the meta-analyzed effect size (classic meta-analysis) or serve as predictors of effect sizes (meta-regression), it is essential that they be reliably applied to each study.
One of the traditional ways to ensure that coders’ agreements on a categorical moderator have not arisen simply from random assignment of codes to the collected studies but rather from expert judgment is to use the Kappa statistic pioneered by Cohen (Reference Cohen1960) but modifiedFootnote 2 and generalized to any number of coders by Fleiss (Reference Fleiss1971). Given the generalizability of Fleiss’s Kappa to any number of raters (Fleiss, Reference Fleiss1971; Fleiss et al., Reference Fleiss, Levin and Paik2003, chapter 18; Hale & Fleiss, Reference Hale and Fleiss1993), throughout the present article, I only use Fleiss’s Kappa and for brevity refer to it as Kappa. Succinctly put, Kappa is designed to remove the excess intercoder agreements that may be attributed to chance. How reasonably Kappa can fulfill its reliability function in the context of a meta-analysis, however, is best illustrated using a simple example.
Suppose two L2 meta-analysts have coded 10 studies to determine whether their English language learning setting was one of English as a Foreign Language (EFL) or English as a Second Language (ESL). As shown in Table 1, except for two studies, studies 9 and 10, there is a perfect agreement in the coding of this moderator by the two coders.
TABLE 1. Coding results for two coders

Note: Disagreements are in boldface.
While a raw measure of intercoder agreement would simply assume that there is 80% (8 out of 10 studies) overall agreement, Kappa statistic would also account for a superficial agreement that might have occurred purely by chance between the coders. At this point, to better explore the Kappa statistic, I suggest using my suite of R functions accessible by running the following in R or RStudio®:
source("https://raw.githubusercontent.com/rnorouzian/m/master/r.r") (R code 1)
The reader should now automatically have access to the coding sheet shown in Table 1 in R or RStudio® under the name of table1. To compute a Kappa statistic for Table 1, we can use the R function irr:
irr(table1) (R code 2)
The R function returns a Fleiss’s Kappa of .375 or 37.5% as the chance-free intercoder agreement. But having obtained this result, a question may quickly form in one’s mind. Why does the result (i.e., Kappa of 37.5%) indicate such a sharp departure from the raw intercoder agreement (i.e., 80%; 8 out of 10 studies) that naturally exists between the coders in Table 1?
To explore this question, let us suppose instead of Table 1, our two L2 meta-analysts coded their 10 studies the way shown in Table 2. The reader should again have immediate access to Table 2 data (i.e., named table2) in R.
TABLE 2. Coding results for two coders

Note: Disagreements are in boldface.
As before, coding of 8 out of 10 studies is in perfect agreement between the coders (i.e., 80% raw agreement). To compute a Kappa statistic for Table 2, we can again use the R function irr:
irr(table2) (R code 3)
But this time Kappa is estimated to be .6. Indeed, it can be shown that Kappa could still drastically change despite 8 out of 10 studies being always in perfect agreement between the coders in the coding sheet. Figure 2 (to reproduce Figure 2 see: https://github.com/hkil/m/blob/master/2.r) visualizes this troubling dynamic for various configurations of our coding sheets in Tables 1 and 2 while keeping 8 out of 10 studies always in agreement.
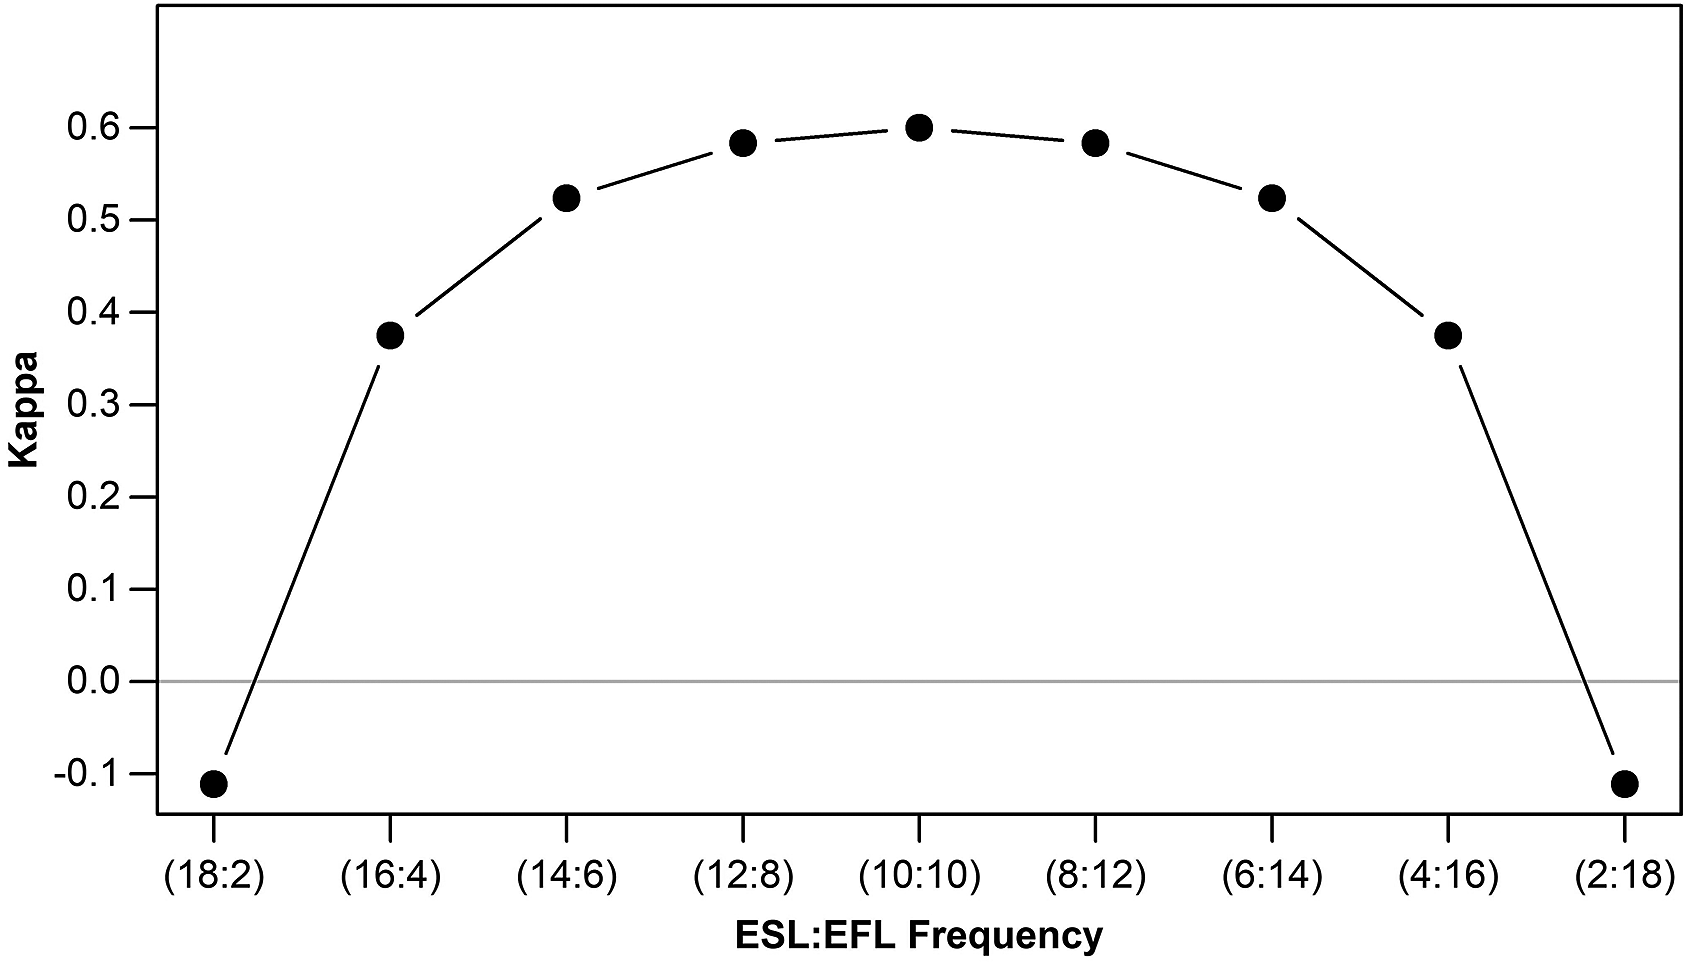
FIGURE 2. Kappa behavior relative to category frequencies.
Put briefly, Kappa is highly sensitive to the distribution of a moderator’s categories in different coding sheets regardless of the same amount of raw intercoder agreement present in them. Consequently, Kappa for each coding sheet yields a different value. For example, when the overall frequency of EFL category equals that of the ESL category in a coding sheet (each occurring 10 times), Kappa reaches a high of .6. However, as the two categories begin to differ in frequency from one another, Kappa starts to shrink at an alarming rate. In its most paradoxical form, Kappa could even become negative (i.e., real agreements being trumped by those expected by chance) despite 8 out of 10 studies being still in perfect agreement. This is simply because ESL and EFL categories have occurred in a very imbalanced manner (i.e., one occurring 18 times, the other occurring only 2 times) in the coding sheet.
Therefore, despite its popularity, Kappa has a paradoxical behavior (Feinstein & Cicchetti, Reference Feinstein and Cicchetti1990) and can underestimate the agreement among coders to varying degrees. More recently, an IRR measure to avoid the paradoxes of Kappa, S index, has been proposed (Falotico & Quatto, Reference Falotico and Quatto2010, Reference Falotico and Quatto2015) that theoretically ranges from −1 to 1 for two coders.Footnote 3 Importantly, the S index remains unaffected by how categories of a moderator are distributed across different coding sheets with the same amount of raw intercoder agreement. Figure 3 (to reproduce Figure 3 see: https://github.com/hkil/m/blob/master/3.r) shows this desirable feature of S index in conjunction with the paradoxical behavior of Kappa.
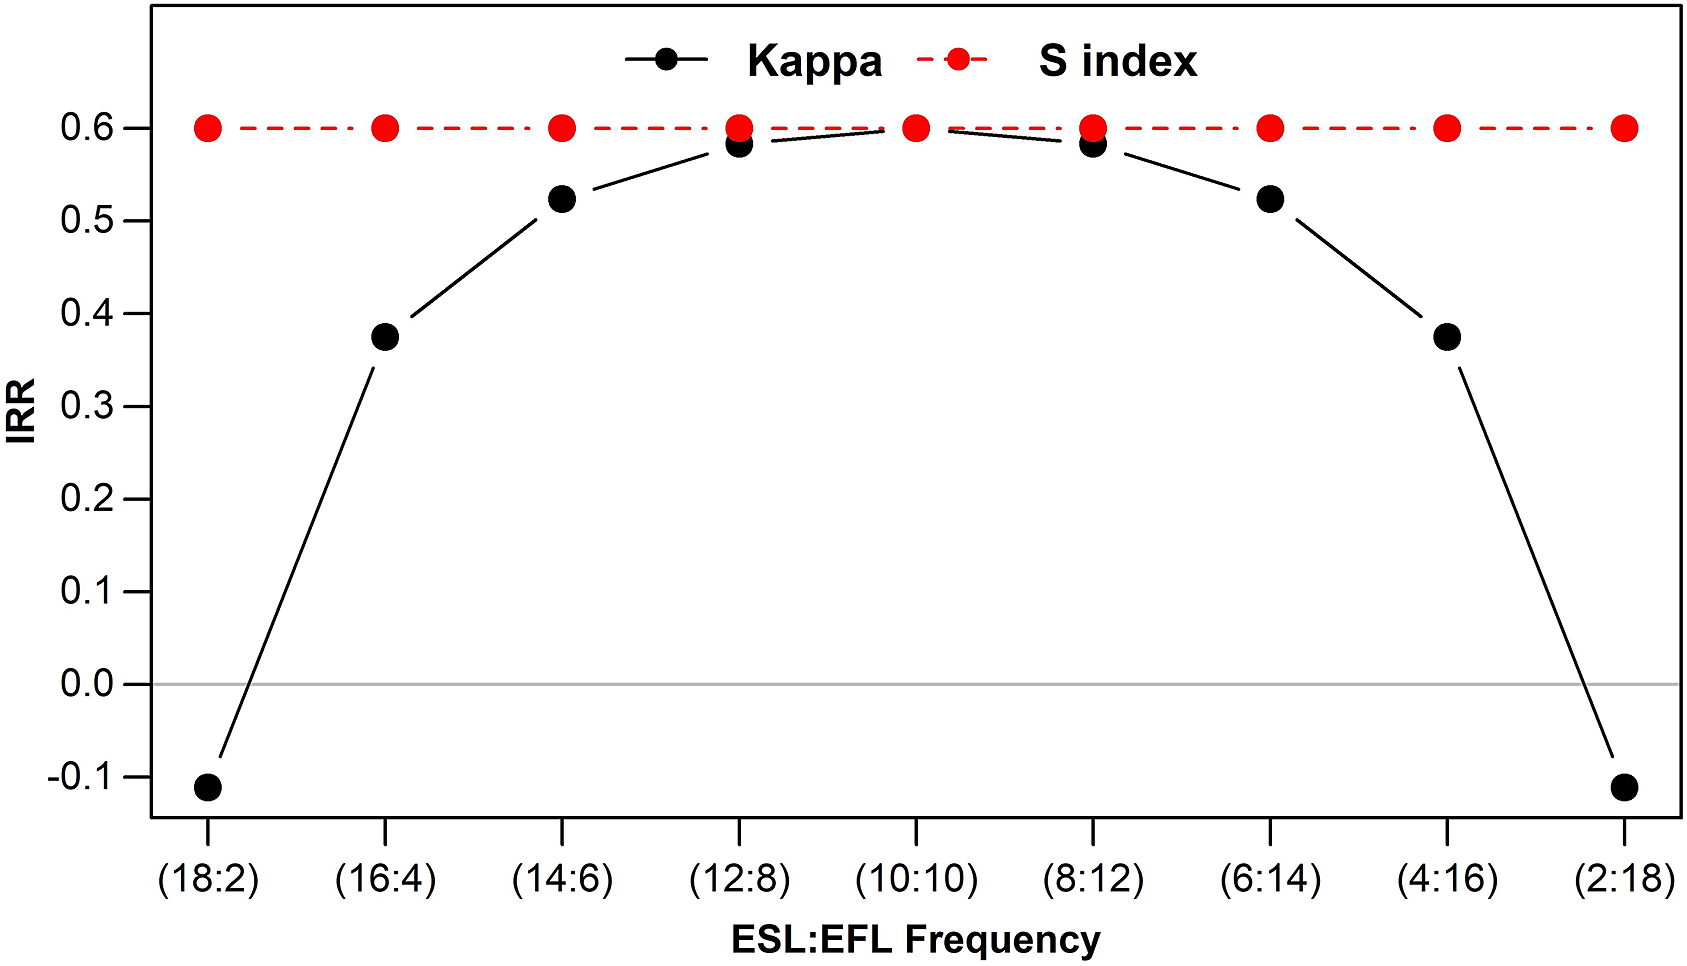
FIGURE 3. Behavior of Kappa and S index relative to category frequencies.
As shown in Figure 3, S index always yields the same amount of chance-free, intercoder agreement for all configurations of our coding sheets in Tables 1 and 2. In other words, S index does not differentially penalize coding sheets with the same amount of intercoder agreement to remove the excess chance-based agreements. As a result, S index seems to be a reasonable statistic to fulfill the reliability function of IRR measures.
APPROPRIATE IRR MEASURES IN META-ANALYSIS: DIAGNOSTIC FUNCTION
In many meta-analytic situations, when an IRR measure tends to be imperfect or relatively low for a categorical moderator, the next question is which category or categories within that moderator are responsible for the disagreements. For example, if most agreements center on one category while there also are a few disagreements on other categories, L2 meta-analysts will benefit from knowing what those other categories are to address the source of their disagreements. A diagnostic (i.e., category-specific) version of the Fleiss’s Kappa statistic is what is often used in practice (see Gamer et al., Reference Gamer, Lemon, Fellows and Singh2019) to perform this function (see Fleiss et al., Reference Fleiss, Levin and Paik2003, chapter 18). However, this version of Kappa suffers from the exact same flaw that was discussed in the previous section plus an additional flaw that manifests itself in the case of binary moderators (e.g., EFL vs. ESL). To see both these flaws together, suppose in our running example, one coder coded all 10 studies “EFL” with the other coder agreeing throughout except for the last three cases. The resulting coding sheet is shown in Table 3.
TABLE 3. Coding results for two coders

Note: Disagreements are in boldface.
One would expect that a diagnostic measure of IRR would capture the reality that there is a considerable amount of agreement on the “EFL” category (i.e., up to study 7) between the coders while no agreement is observed with regards to the “ESL” category. However, we can use the R function irr.diag (i.e., irr.diag(table3)) only to find out that the diagnostic Kappa for both “EFL” and “ESL” categories is −0.176. In other words, the diagnostic Kappa is problematic because it (a) can be negative regardless of the considerable agreements on some categories (i.e., “EFL” in this case) and, additionally, (b) always yields the same value for both categories, which does not even help in locating the low- or no-agreement category (i.e., “ESL” in this case).
To overcome these shortcomings, a more efficient diagnostic IRR measure, SA, was introduced by Cicchetti and Feinstein (Reference Cicchetti and Feinstein1990). As a diagnostic IRR measure, SA ranges from 0 to 1 and thus it can be easily expressed in percentages for each category of a moderator. The R function irr.diag can be used once again to obtain SA for our Table 3 coding sheet:
irr.diag(table3) (R code 4)
The function estimates the SA to be .824 for the “EFL” category and 0 for the “ESL” category. This result seems to closely match the reality reflected in Table 3. Given that language setting (i.e., EFL vs. ESL) is not often considered a high-inference moderator (see Cooper, Reference Cooper2017, chapter 4), it is possible that a fatigue factor might have played a role in such a disagreement. But in any case, focusing on why there is no agreement on the “ESL” category would help the two coders make the necessary modifications in their final coding sheet and if needed further clear up possible ambiguities in the definition of this moderator in their coding scheme. As a result, SA seems to be a reasonable statistic to fulfill the diagnostic function of IRR measures.
IMPLEMENTING IRR ANALYSIS IN L2 META-ANALYSES
As noted in the “Introduction,” while developing a foundational understanding of what IRR does is essential, practical difficulty in implementing both functions of IRR in meta-analytic research, nonetheless, remains a formidable impediment to the common use of IRR measures in L2 meta-analyses. In this section, we will be building toward removing this impediment by clarifying the nature of the items coded for measuring IRR indices in meta-analysis.
NATURE OF THE ITEMS CODED FOR IRR IN META-ANALYSIS: STUDY-LEVEL VERSUS SUBLEVEL
Let us operationally define coding in the context of IRR. Coding involves assigning a well-defined code (numerical or otherwise) to an item using expert judgment. Importantly, the combination of the terms item and judgment produces a specific effect in the meta-analytic coding sheets. For example, in Tables 1–3 in the previous sections, the moderator Language Setting (i.e., EFL vs. ESL) represented a feature that referred to an entire study. Therefore, each study—regardless of how many treatment groups it involved—was overall counted as one item for coding and thus required one count of judgment on the part of each coder. Let us call moderators of this kind study-level moderators. But this is not how all the moderators appear in a meta-analytic coding sheet. Suppose, for example, that two L2 coders have examined five L2 writing-related studies to determine whether the writing tasks used in them were timed or untimed (i.e., moderator Time Restriction). The coding results are shown in Table 4.
TABLE 4. Coding results for two coders

Note: Groups denote treatment groups.
In Table 4, moderator Time Restriction seems to be able to vary (i.e., be different) among the treatment groups within the same study. For example, Group 1 in Study 1 seems to have had a timed writing task while Group 2 in the same study appears to have used an untimed writing task. Therefore, each study as a whole cannot be counted only as one item for coding requiring one count of judgment. Rather, it is the number of treatment groups within the studies that determine how many items and how many counts of judgment each study presents for coding. Let us call moderators of this kind substudy-level or sublevel moderators. Understanding this distinction will prove crucial when performing IRR analysis for meta-analysis. This is because meta-analytic coding sheets often consist of a mix of both study-level and sublevel moderators together, and IRR measures (e.g., S index and SA) should be able to distinguish between these types of moderators for accurate estimation of intercoder agreement. To illustrate the importance of this dynamic, Table 5 presents the coding results of two coders on two L2 moderators in the same coding sheet. The reader can access Table 5 by running table5 in R or RStudio.
TABLE 5. Coding results for two coders on two moderators

Note: Item numbers in boldface denote rows formally coded for moderator Language Setting.
As noted earlier, moderator Language Setting (i.e., EFL vs. ESL) is a study-level moderator, and moderator Time Restriction (i.e., timed vs. untimed) is a sublevel moderator. As a result, in Table 5, although coders must have used expert judgment on every row of the coding sheet for moderator Time Restriction (i.e., 10 items formally coded), for each study as a whole they have used only one count of judgment for moderator Language Setting regardless of the number of rows for that study (i.e., 5 items formally coded). Thus, the mere presence of “ESL” and “EFL” codes on every row of the coding sheet (e.g., perhaps by copying from the preceding cell) does not simply denote that every row has been formally coded using expert judgment (see definition of IRR coding in the preceding text). In the case of Table 5 coding sheet, if we ignore this fact, the S index for moderator Language Setting Footnote 4 will be .4. However, if we correctly take into account the nature of the moderator Language Setting, then the S index will turn out to be .6. This difference in results occurs because if we disregard the nature of the moderator Language Setting, then the disagreements on the moderator’s categories in the coding sheet will be incorrectly exaggerated and hence an unjustifiably shrunken IRR measure. Conversely, it is also possible that ignoring the nature of the moderator would lead to inflating or even not changing the IRR measure depending on the distribution of the categories in the coding sheet. However, it is always wiser to avoid such complications in the context of high-stake research such as meta-analysis.
The details provided so far in the present article seem to call for a specialized software program that would possess at least four main capabilities. First, the software should be able to use appropriate IRR measures to fulfill both the reliability and the diagnostic functions discussed earlier. Second, it should be able to perform IRR analyses using one combined or separate coding sheets from any number of coders containing any number of moderators. Third and importantly, it should be capable of distinguishing between the study-level and the sublevel moderators and run the correct IRR analyses separately in each case. Finally, the software should be able to produce a full range of tabular as well as visual information to aid modifying the coding sheet at hand for achieving more replicable meta-analytic research. In the next section, I provide the details of such a software program.
FLEXIBLE SOFTWARE FOR IRR IN L2 META-ANALYSIS
To my knowledge, none of the four capabilities stated in the previous section are found in existing reliability packages. For example, the R packages irr (Gamer et al., Reference Gamer, Lemon, Fellows and Singh2019), and psych (Revelle, Reference Revelle2017) do not provide any of the IRR measures (i.e., S index and SA) discussed in the present article. Additionally, none of the packages can handle meta-analytic coding sheets or distinguish between the moderator types. Other R packages such as rel (LoMartire, Reference LoMartire2020) either provide a limited version of S index suitable only for a two-coder case or like the R package raters (Quatto & Ripamonti, 2014) have no power to handle IRR in meta-analytic coding sheets or to provide additional diagnostic IRR measures and graphical aids. Overall, many L2 meta-analysts may find conducting a comprehensive IRR analysis on their coding sheets practically infeasible.
I have developed a flexible, open-source software program in R (R Development Core Team, 2020), meta_rate, intended to specifically accommodate the goals stated in the previous section and particularly tailored to the needs of L2 meta-analysts with minimal familiarity with R. The software can be freely accessed by the running the first R code (i.e., R code 1) provided earlier. Once the data requirements are correctly met, meta_rate performs the full range of IRR analyses discussed in this article for any number of moderators and raters with a single click. In the next section, I will describe these requirements in detail.
PRELIMINARY REQUIREMENTS OF meta_rate
The R function meta_rate requires the Excel sheets containing the coded studies for IRR analysis to have a column named study.name. Under this column, coders may consistently select any desired study name (e.g., authors’ names). If the exact same author(s) contribute(s) more one than one study to the studies chosen for IRR analyses, the study names must be distinguished from one another accordingly (e.g., Author X_a and Author X_b) under the study.name column. Although not required by the program, I also strongly recommend that coders create a second column named based on a relevant substudy feature (e.g., group.name) to include the names of treatment groups or other relevant substudy features in each study. Doing so allows comparability across the rows in different coders’ coding sheets and avoids confusion on the part of the coders. The function meta_rate accepts either a combined Microsoft Excel sheet containing all coders’ coding results side by side (see Table 5) or any combination of separate Excel sheets for different coders. For example, if two coders deliver one combined coding sheet (i.e., side by side) but a third coder presents a separate coding sheet for the purpose of IRR analyses, all the coding sheets can be fit to the program at once. Also similar to study names, all coders must consistently pick the same moderator names (e.g., “setting” from coder 1 and “setting” from coder 2) in their coding sheet(s). It is also helpful to know that meta_rate has a built-in data-cleaning feature. Therefore, if, for example, some coders habitually allow some blank rows to separate the studies or some blank columns to separate the moderators from one another, they will not need to remove them in their IRR coding sheets as meta_rate will do so by design.
When coders intend to input separate Excel sheets to meta_rate, it is essential that the rows representing each study’s treatment groups (or any other substudy grouping) have one-on-one correspondence across the coding sheets.Footnote 5 For example, if, say, study 4 has two rows representing its two treatment groups, Y and Z, it is necessary that these two treatment groups be ordered in the same way across all the coding sheets (e.g., from top to bottom first Y, then Z). That said, it would not matter if whole studies, keeping their row orders, appear in different places in the coding sheets for different coders. This is because meta_rate locates the studies based on their study.name. Thus, no matter where the whole studies appear in each coding sheet across the coders, they will be correctly located by the program. For example, Table 6 provides two coders’ coding results that despite their asymmetrical appearance still meet the requirement of meta_rate.
TABLE 6. Two asymmetrical coding sheets for two coders on moderator Time Restriction

Notes: Like all other studies, rows in Study 4 are ordered the same way across the two coding sheets. time.rest = time restriction.
Finally, all Excel coding sheets must be saved as CSV Excel files (i.e., comma delimited) before being input to meta_rate. This can be easily achieved using the Save As function in Excel. This would also mean that the user cannot use nested Excel Workbooks (i.e., spreadsheets with multiple subsheets) but only one or more CSV-formatted Excel files.
L2 META-ANALYSIS DATA DEMONSTRATION WITH meta_rate
It is best to explore the main capabilities of meta_rate by applying it to actual coding sheets for an L2 meta-analysis. I trained a research assistant (RA) in a coding scheme inspired by Kang and Han (Reference Kang and Han2015) for a meta-analytic study focused on the effectiveness of written corrective feedback in developing grammatical accuracy of L2 writers (see Norouzian & Farahani, Reference Norouzian and Farahani2012). For the purpose of the present demonstration, my RA and I focused on six moderators whose general, categorical, and coding definitions appear in Table 7.
TABLE 7. Coding scheme for six selected moderators

Note: “Not available” denotes that the feature in question was not reported or inferable.
I started the IRR preparation process by selecting a random sample of 10 studies from my study pool. This sample included two PhD dissertations and eight journal articles with a total of 21 treatment groups employed in them. Also, the sample accounted for nearly 32% of the studies collected for the entire meta-analysis. Next, I prepared a blank Excel sheet with 21 rows corresponding to the 21 treatment groups in the 10 studies as well as two columns named study.name (required by meta_rate) and group.name (recommended by meta_rate). Then, I populated the study.name column using the abbreviated form of the authors’ names and the group.name column using the abbreviated form of the treatment groups’ names. Finally, I shared a copy of this Excel sheet with my RA for coding, provided some clarification regarding how I abbreviated the treatment groups’ names, asked her not to change the order of the rows, and discussed other data requirements of meta_rate that were detailed in the previous section.
The reader can have immediate access to the individual as well as the combined coding sheets for my RA and I under the names c1, c2, and c3 respectively in R or RStudio. We can now input either the individual coding sheets (i.e., c1 and c2) or the combined coding sheet (i.e., c3) to meta_rate to conduct the full IRR analyses discussed in the previous sections. That is:
meta_rate(c1, c2) (R code 5)
or:
meta_rate(c3) (R code 6)
UNDERSTANDING THE TABULAR OUTPUT: RELIABILITY FUNCTION
In either case, meta_rate will output a range of tabular information similar to what is displayed in Table 8. The variety of information provided in the output mainly serves to assess the reliability function of each moderator coded in the coders’ coding sheets.

First, the S index column lists the intercoder agreements between the two coders on all moderators. Examining this column in our case, we realize that the two coders do not agree much specifically on moderators Feedback Type (S index = 0.492) and Random Assignment (S index = 0.55). It is important that, in the context of meta-analysis, any imperfect S index (i.e., less than 1) for a moderator be further inspected to reveal the category or categories responsible for the disagreements. In the next section, Understanding the visual output, we will learn how to obtain such information for our imperfect IRR measures.
Second, the columns titled Lower and Upper are the 95% bootstrapped confidence intervals (CI) for the S indices which carry important inferential information. Gwet (Reference Gwet2014, chapter 5) argues that these intervals tell us about what we could expect our IRR estimates (e.g., S indices) to be if other similar coders and items were involved in our IRR coding process over large repetitions (cf. Norouzian et al., Reference Norouzian, De Miranda and Plonsky2018, Reference Norouzian, De Miranda and Plonsky2019). With a limited number of coders and items, however, these intervals often tend to be fairly wide and uncertain. For example, even though moderator Random Assignment currently has an S index of 0.55 in Table 8, it is expected that coding other similar items by other similar coders could change its current value to anywhere between 0.1 and 0.854. Clearly, having, especially, more coders (see Gwet, Reference Gwet2014) helps achieve narrower CIs (see Norouzian, Reference Norouzian2020), and hence more precise estimates of S index.
Third, the column titled Rows Compared is where meta_rate looks at the coding patterns of coders on each moderator to ascertain whether that moderator is a study-level moderator or a sublevel moderator (see Nature of items coded for IRR section). For example, meta_rate has decided that moderator Proficiency is a study-level moderator. As a result, it has only counted the 10 rows of the coding sheet representing the 10 studies not the 21 rows representing the 21 treatment groups within the 10 studies. If we, as human coders, disagree with this decision for legitimate reasons, we can override it using the argument sub.level resulting in Proficiency being analyzed as a sublevel moderator:
meta_rate(c3, sub.level = "prof") (R code 7)
Fourth, the column titled Minimum Category provides the name of the least agreed upon category in each moderator. This nominal information serves to alert the coders to further explore the SA indices and locate their specific disagreements (see the next section). Needless to say, when there is perfect agreement among coders (i.e., S index = 1), speaking of Minimum Category is irrelevant. That is why meta_rate has placed a -- symbol for moderator Setting: because the two coders perfectly agree on all categories of this moderator.
Finally, the titles of the last two columns (i.e., Number of Coders and Study Level) should reveal what these columns represent. However, I recommend always inspecting these columns to ensure that coders and moderators have been properly picked up and processed by meta_rate.
As a side note, if desired, coders can request an Excel file of the tabular output of meta_rate by providing a file.name such as:
meta_rate(c3, file.name = "output") (R code 8)
Now, the coders will have an Excel file named output saved in the working directory of their computers containing the output presented in Table 8 that can be transferred over to other documents for formal presentation of the IRR findings. The software will indicate the exact location of the file by generating a message containing the working directory folder name.
UNDERSTANDING THE VISUAL OUTPUT: DIAGNOSTIC FUNCTION
While the tabular output provides an overall measure of intercoder agreement (i.e., S index) for each moderator, understanding what category or categories within each moderator are responsible for the disagreements among the coders can be best explored visually. Figure 4 is automatically generated by meta_rate to serve this purpose.

FIGURE 4. Specific agreement indices for specific categories within six moderators.
Let us focus on our two low-IRR moderators from the previous section (i.e., Feedback Type and Random Assignment). In the case of Feedback Type, we see that one of the coders has used “3” (i.e., meta-linguistic feedback) for one or more treatment groups that the other coder has never assigned to any groups (also see Table 3). This is captured by the plot titled type not showing any vertical bar for category “3” (i.e., SA = 0). Categories “1” (i.e., direct feedback) and “2” (i.e., indirect feedback) also seem not to have been highly agreed upon by the coders (SA = 0.53 and 0.66, respectively). However, the perfect agreement (i.e., SA = 1) seen on category “4” (i.e., mixed feedback) appears to have helped the overall S index for this sublevel moderator to be relatively comparable to that for Random Assignment.
In the case of Random Assignment, we see that the main culprits are the “NA” and “1” categories. This is captured by the plot titled random showing lower vertical bars for the categories “NA” (SA = 0.57) and “1” (SA = 0.66). However, we also see that category “0” (SA = 0.84) has seen minor disagreements on perhaps one or two studies as a study-level moderator. Collectively, these disagreements have caused the overall S index for Random Assignment to be as low as 0.55.
The reader should be able to make similar diagnostic interpretations for the other four moderators in question. During the deliberations following the full understanding of IRR analyses similar to what I showed in the preceding text, coders can efficiently look for the substantive roots of their disagreements. For example, coders may realize that some of the disagreements in their coding sheets may have occurred purely by mistake. However, other problems may go well beyond being mistakes. For example, curious to know why we agreed so poorly on Feedback Type, we realized that the definition of meta-linguistic feedback (coded “3”), as defined in our coding scheme, did not necessarily correspond to all the studies labeling their treatment groups as such in our selected studies. As a result, one of the coders opted for “Indirect” feedback, as a cover category, to account for this discrepancy while the other elected to follow what the primary authors had labeled “Meta-Linguistic” for those treatment groups. This was the source of our disagreement. The important point is that meta_rate makes it possible to precisely identify these disagreements and make the necessary changes both in our coding schemes as well as our coding sheets thereby improving the replicability of our meta-analyses.
Another practical problem that might arise when conducting IRR analysis in the context of meta-analyses is disproportionate coding of moderators by different coders. This situation often occurs when coding of studies overlaps in a variety of ways among different coders. In the next section, I explore this issue in more detail.
DISPROPORTIONATE CODING OF MODERATORS
In labor-intensive research works such as meta-analysis, it is not uncommon to receive disproportionate contributions from different collaborators. For example, some coders may assist in coding studies only for certain moderators due to their time limitation. Conversely, it is also possible that new moderators are added to the coding scheme and coded by a combination of older and newer coders. In all such cases, a disproportionate number of coded moderators by different coders may be available to the primary researcher(s). It will be desirable if the primary researcher(s) could subject all such coding sheets to IRR analyses for more precise estimation of IRR of the moderators that overlap among different coders. By design, meta_rate detects the coders in the coding sheet(s) fit to it, selects the moderators that have been disproportionately coded by different coders, and performs the IRR analyses accordingly.
For example, in the case of the L2 meta-analysis example from the previous section, suppose we add two new moderators to the coding scheme shown earlier in Table 7. First, whether each study (i.e., a study-level moderator) included a control group (coded “1”) or not (coded “0”). Second, whether participants in each treatment group (i.e., a sublevel moderator) had the opportunity to revise their essays after receiving feedback (coded “1”) or not (coded “0”). Further suppose that these two new moderators along with two older ones from Table 7 (i.e., Feedback Type and Proficiency) are now coded by a new RA (RA 2) for the same 10 studies. Having new coders code a couple of older moderators can not only help improving the reliability estimates for those moderators but it may also be a good way to introduce the new coders to the nuances of the project. Now as the primary researcher, I only need to code the previous 10 studies for the two newly added moderators. Naturally, this form of disproportionate coding results in some older moderators (i.e., Feedback Type and Proficiency) being coded by three coders (the two RAs and I), but others by only two coders (RA 2 and I).
A disproportionate coding sheet akin to what was described in the preceding text is accessible by running c4 in R or RStudio (see online version at: https://github.com/hkil/m/blob/master/c4.csv). This coding sheet consists of all three coders’ disproportionate coding of the aforementioned moderators. We can input c4 to meta_rate as before using the following with the results shown in Table 9:
meta_rate(c4) (R code 9)
TABLE 9. Tabular output of meta_rate for disproportionate coding

Notes: Moderators’ names are abbreviated per Table 7. Moderator names in boldface are the new moderators. Moderator names in italics are coded by three coders. The moderator underlined must be overridden by user (see the following text).
It is instructive to see how the new tabular output shown in Table 9 differs from the one presented earlier in Table 8. Specifically, four changes are observed in the new tabular output.
First, notice that meta_rate has properly picked up the number of coders for Feedback Type and Proficiency moderators as well as the other moderators in a disproportionate way. That is, for some moderators we see two coders while for others we see three coders.
Second, the S index for Proficiency has now increased from 0.867 to .911 by the addition of a third coder. More important yet is that the 95% CI for Proficiency is now narrower (i.e., [0.733, 1]) than what it was in Table 8 (i.e., [0.6, 1]) using two coders. Together, these two improvements indicate that moderator Proficiency is going to enjoy a high level of replicability among other similar coders.
Third, despite the increase in the S index for Feedback Type from 0.492 to 0.577, the S index for this moderator is still low. Interestingly, the least agreed upon category is still category “3” (i.e., meta-linguistic feedback) indicating the need to either modify this moderator in the coding scheme or to add a new category to more clearly distinguish among treatment groups in the collected studies.
Fourth, we see that software has decided, based on the coding pattern of the coders, to treat one of the new moderators, Revise, as a study-level moderator. However, as indicated in the preceding text, this moderator is a sublevel moderator whose coding pattern, in this case, happens to resemble that of a study-level moderator in the coding sheet. We can easily override this decision by explicitly designating Revise as a sublevel moderator:
meta_rate(c4, sub.level = "revise") (R code 10)
In this case, overriding meta_rate results in a slight change in the S index for Revise (i.e., from .8 to .81). As discussed earlier, L2 researchers should recognize the nature of their moderators and make sure that moderators are treated accordingly when conducting IRR analyses for their meta-analyses.
INTERPRETIVE GUIDELINES FOR IRR IN META-ANALYSIS
A final practical issue for L2 meta-analysts may relate to interpreting the IRR estimates using descriptive benchmarks. While the “choice of such benchmarks … is inevitably arbitrary” (Sim & Wright, Reference Sim and Wright2005, p. 264), to preserve uniformity in interpretations, I recommend the set of benchmarks presented in Table 10.
TABLE 10. Interpretative guidelines for S index and SA

These benchmarks are motivated by but more conservative (i.e., set to be higher) than those for Fleiss’s Kappa for commonly encountered rated item numbers of 25 to 40 (Hale & Fleiss, Reference Hale and Fleiss1993). However, it is harmless for them to be conservative given the possible overreliance on these descriptive qualifiers. Particularly, it must be noted that when only a small portion of a meta-analysis study pool is subjected to IRR analyses, even “High” and “Very Strong” IRR estimates demand further attention on the part of the coders. This is because it is possible that if two or more coders only marginally disagree on a few studies, their disagreements start to grow as they code other studies. Therefore, the validity of these descriptive qualifiers increases as, among other things, the number of studies used for IRR analyses approaches that of the entire pool of the studies collected for meta-analysis. Stated another way, one should not solely rely on these or any other similar descriptive qualifiers at the expense of ignoring the width of the relevant CIs (see Cumming & Calin-Jageman, Reference Cumming and Calin-Jageman2017; Norouzian, Reference Norouzian2020).
CONCLUSION
Recently, there has been a surge of interest in improving the replicability of L2 research (see Marsden et al., Reference Marsden, Morgan‐Short, Thompson and Abugaber2018; Porte, Reference Porte2012; Porte & McManus, Reference Porte and McManus2018). However, less attention seems to have been paid to the issue of replicability in L2 meta-analyses, which often impact wide-ranging audience in the language learning and teaching world. In this article, I provided principled solutions to improving replicability in L2 meta-analyses. I also demonstrated these solutions using actual L2 meta-analysis data. Realizing this effort under the methodological reform movement that is currently taking place in L2 research (Gass et al., Reference Gass, Loewen and Plonsky2020; Norouzian & Plonsky, Reference Norouzian and Plonsky2018a, Reference Norouzian, Plonsky, Phakiti, De Costa, Plonsky and Starfield2018b; Norouzian et al., Reference Norouzian, De Miranda and Plonsky2018, Reference Norouzian, De Miranda and Plonsky2019), I hope that L2 meta-analysts routinely employ the practical methods detailed in the present article. It is also my hope that L2 journals require meta-analytic research submitted for publication to provide the key IRR information needed for replicability purposes. Tables 8 and 9 as well as Figure 4 offer informative and efficient ways to meet that requirement.


 Open access