


Introduction
Large ungulates influence forest structure and functioning (Gopalaswamy et al., Reference Gopalaswamy, Karanth, Kumar and Macdonald2012), and the density and spatial distribution of apex predators such as the tiger Panthera tigris. The occurrence of tigers is primarily determined by the abundance of ungulate prey (Karanth et al., Reference Karanth, Nichols, Kumar, Link and Hines2004; Harihar & Pandav, Reference Harihar and Pandav2012), and by levels of human disturbance (Linkie et al., Reference Linkie, Chapron, Martyr, Holden and Leader-Williams2006). In the Himalayan region, ungulates such as the sambar Rusa unicolor, wild boar Sus scrofa, barking deer Muntiacus muntjak, chital Axis axis and gaur Bos gaurus are the principal prey of tigers, with some variations between localities and habitat types (Karanth et al., Reference Karanth, Nichols, Kumar, Link and Hines2004; Harihar & Pandav, Reference Harihar and Pandav2012; Hayward et al., Reference Hayward, Jedrzejewski and Jedrzewska2012; Tempa, Reference Tempa2017). These prey species constitute an important structural component of tiger habitats and movement corridors, and their occupancy is influenced by environmental parameters such as elevation, forest coverage, and distance from water, and by levels of human interference (Tempa, Reference Tempa2017).
Bhutan is a hotspot of wild felid diversity (Tempa et al., Reference Tempa, Hebblewhite, Mills, Wangchuk, Norbu and Wangchuk2013; Dhendup & Dorji, Reference Dhendup and Dorji2018), with the tiger being of particular conservation concern (DoFPS, 2015a). Tigers are widely distributed in Bhutan from subtropical to alpine regions (Tempa, Reference Tempa2017). The first nationwide tiger survey, using camera traps, was completed in 2015, with the number of tigers estimated to be 103, at a density of 0.46 tigers per 100 km2 (DoFPS, 2015a). Tiger density was high (2–3 tigers per 100 km2) in protected areas in central Bhutan such as the Royal Manas and Jigme Singye Wangchuck National Parks (Tempa, Reference Tempa2017). In Bhutan, tigers successfully breed at altitudes from near sea level to > 4,000 m (Jigme & Tharchen, Reference Jigme and Tharchen2012). Provided that corridors between tiger habitats ensure structural and functional connectivity, Bhutan could make a significant contribution towards global tiger conservation goals such as doubling global tiger numbers by 2022 (compared to 2010; GTRP, 2011). The functional connectivity of a landscape is determined by its structure and composition (Rudnick et al., Reference Rudnick, Ryan, Harmon, Birdsey, Giardina and Heath2012), and the term structural connectivity describes the physical characteristics of a landscape that facilitate or hamper wildlife movement, including topography, hydrology, vegetative cover and human land-use patterns (Metzger & Décamps, Reference Metzger and Décamps1997).
Bhutan has 10 protected areas, including five national parks, four wildlife sanctuaries and one strict nature reserve (DoFPS, 2015b). Eight biological corridors, numbered 1–8, were established in 1999, to connect protected areas and facilitate wildlife movement and dispersal (Sherpa & Norbu, Reference Sherpa and Norbu1999; Wangchuk, Reference Wangchuk2007). The biological corridors were designated based on vegetation cover derived from Landsat images, land-use maps and evidence of tiger occurrence. Evidence suggests corridors facilitate dispersal of smaller mammals and birds elsewhere (Littlewood et al., Reference Littlewood, Rocha, Smith, Martin, Lockhart and Schoonover2020), but the biological corridors in Bhutan were not validated with fieldwork, mainly because of a lack of trained personnel and resources (Thinley, Reference Thinley2010). To assess the functional connectivity of these biological corridors for the movement of large carnivores such as the tiger, it is important to document the occurrence of prey species, as a proxy for structural connectivity. Well managed biological corridors are likely to enhance dispersal of tigers and other carnivores, thus providing connectivity between habitats (Harihar & Pandav, Reference Harihar and Pandav2012; Letro & Duba, Reference Letro and Duba2019).
Species distribution models can be used to assess the impacts of ecological and anthropogenic covariates on the distribution and habitat use of species of conservation concern (Elith & Leathwick, Reference Elith and Leathwick2009). Environmental variables affect species distributions and can thus be used to predict distributions across landscapes. In addition, environmental variables such as habitat type or proximity to water influence fine-scale habitat use (Harihar & Pandav, Reference Harihar and Pandav2012), and can be used to identify essential conservation areas (Penjor et al., Reference Penjor, Macdonald, Wangchuk, Tandin and Tan2018, Reference Penjor, Tan, Wangdi and Macdonald2019) and guide conservation actions at the local level (Sunarto et al., Reference Sunarto, Kelly, Parakkasi, Klenzendorf, Septayuda and Kurniawan2012; Srivathsa et al., Reference Srivathsa, Karanth, Jathanna, Kumar and Karanth2014).
Here, we use detection/non-detection data of prey species collected through camera trapping in Bhutan's biological corridor no. 8 for occupancy modelling (Mackenzie et al., Reference Mackenzie, Nichols, Lachman, Droege, Andrew and Langtimm2002), to assess the probability of site occupancy of the tiger's principal prey species, accounting for imperfect detection. Our objectives were to ascertain occupancy probability and its determinants for three principal prey species (sambar, wild boar and barking deer), and to develop predictive distribution maps for the study area based on spatially explicit occupancy models for the three prey species, to assess landscape connectivity for tiger dispersal. No studies have previously been carried out on prey species distribution and habitat use for any of the biological corridors in Bhutan. Our study thus contributes to a better understanding of the role that biological corridors play in enhancing landscape connectivity in Bhutan.
Study area
We conducted this study in the parts of biological corridor no. 8 that connect Jigme Singye Wangchuck and Wangchuck Centennial National Parks, covering c. 240 km2 (Fig. 1). The area is at an altitude of 1,850–4,180 m, with a warm-temperate climate, mean annual temperature of 14 °C and a mean total annual rainfall of 1,956 mm (NCHM, 2018). The landscape is undulating and mainly covered with various forest types, including broadleaved, fir, blue pine Pinus wallichiana and mixed conifer forests, and alpine scrub. Past surveys documented the presence of apex predators such as the tiger, the common leopard Panthera pardus and the Asiatic black bear Ursus thibetanus, and several prey species including the sambar, wild boar, Himalayan serow Capricornis thar, barking deer, Himalayan goral Naemorhedus goral, musk deer Moschus chrysogaster and takin Budorcas taxicolor whitei (DoFPS, 2015a). Human land-use types in the study area comprise pastures and built-up areas (roads and permanent human settlements). Seasonal livestock grazing and collection of forest resources in and around the study area exert anthropogenic pressures on the biological corridor (Letro & Fischer, Reference Letro and Fischer2020). The eastern and western sections of the corridor differ in the level of human interference, with more human settlements and roads, and more grazing pressure from domestic animals, in the western section.

Fig. 1 (a) Biological corridor no. 8 in central Bhutan, connecting Jigme Singye Wangchuck National Park (JSWNP) and Wangchuck Centennial National Park (WCNP) and (b) location of camera traps in biological corridor no. 8.
Methods
Data collection
To estimate the occupancy of tiger prey species, we conducted a camera-trap survey during March–June 2018. We divided the study area into 35 grid cells of 2.5 × 2.5 km, with grid cell size chosen to account for the expected daily movements of prey species, based on their known home range sizes (Table 1) and movement rates (Odden & Wegge, Reference Odden and Wegge2007; Gopalaswamy et al., Reference Gopalaswamy, Karanth, Kumar and Macdonald2012; Thapa & Kelly, Reference Thapa and Kelly2016). Using a sufficiently large grid cell size is important, to minimize the risk of violating the assumption of closure when estimating occupancy (Mackenzie et al., Reference Mackenzie, Nichols, Lachman, Droege, Andrew and Langtimm2002). We set up camera-trap stations in 27 of the 35 grid cells (77%), 14 and 13 in the eastern and western sections, respectively, at 2,085–3,900 m altitude (Fig. 1). To increase the probability of photo-capturing prey species and tigers, we installed camera traps along game trails leading to streams and salt licks, and at trail junctions and ridge tops. We placed one automated HCO-ScoutGuard (Professional Trapping Supplies, Molendinar, Australia) camera-trap unit at each station, fastened on a wooden post 45 cm above ground level, and at a distance of c. 2.0–3.5 m from the centre of the trail. Camera traps were active during 27 March–6 June 2018, for 33–55 days per location. We recorded the geographical coordinates of the location of each camera-trap station. We defined independent images of a species as those that were taken at least 5 minutes apart.
Table 1 The characteristics of the three ungulates that are the principal prey species of the tiger Panthera tigris in biological corridor no. 8 (Fig. 1), adapted from McShea et al. (Reference McShea, Davies and Bhumpakphan2011).

Data analysis
Occupancy data may be affected by the detectability of target species. We examined the impact of trap effort (the number of days the camera trap was active) and study site (eastern vs western section), as we expected these covariates to influence detection probability of prey species. With regard to occupancy probability, we tested the impact of various site covariates, including altitude, slope, aspect, land-use type, and distances to the nearest river, protected area, road and human settlement. We selected these variables based on prior studies of the tiger and its prey in this region (Kushwaha et al., Reference Kushwaha, Khan, Habib, Quadri and Singh2004; Linkie et al., Reference Linkie, Chapron, Martyr, Holden and Leader-Williams2006; Kanagaraj et al., Reference Kanagaraj, Wiegand, Kramer-Schadt, Anwar and Goyal2011; Harihar & Pandav, Reference Harihar and Pandav2012; Tempa, Reference Tempa2017). Altitude, aspect, slope and distance to river characterize physical properties of the environment, whereas land-use type and distances to the nearest protected area, road and settlement describe human impact. We determined the value of each site covariate as the mean of raster cells within circles of 500 m radius around each camera-trap station, using the zonal statistics tool in QGIS 3.2.1 (QGIS Development Team, 2018). We extracted altitude, slope, and aspect values from digital elevation raster data (USGS, 2018). We categorized land-use types as built-up area, farmland, broadleaved forest, conifer forest, mixed conifer forest, meadow, alpine scrub, and rocky outcrop. To determine land-use types and locations of roads, protected areas and rivers, we used the Bhutan land-use and land-cover data 2016 (FRMD, 2017). We measured distances using the Euclidean distance tool in QGIS.
Occupancy models using detection/non-detection data have two inferences: the probability of detection (P; the probability that a species appears during count statistics) and the probability of occupancy (Ψ; the probability that the species occupies a random site in a given time period; MacKenzie et al., Reference MacKenzie, Nichols, Royle, Pollock, Bailey and Hines2006). We generated detection histories (1 for detection, 0 for non-detection) for each species at each camera trap over the respective trapping period, using ReNamer 6.8 (Sanderson & Harris, Reference Sanderson and Harris2013). For occupancy modelling, we selected the optimal number of trap-days (i.e. sampling period) for each prey species based on the χ² goodness-of-fit test of the multivariate model (MacKenzie & Bailey, Reference MacKenzie and Bailey2004): 10 days for sambar, 12 for wild boar and 15 for barking deer (Supplementary Table 1).
For each prey species, we imported the detection history over the optimal sampling period and the various site covariates into PRESENCE 2.12.17 (Hines, Reference Hines2006), to run single-season single-species occupancy models (Mackenzie et al., Reference Mackenzie, Nichols, Lachman, Droege, Andrew and Langtimm2002). We z-standardized all continuous covariates to a mean of zero and one standard deviation using the formula z = (x − x')/SD , where x is the individual value, x' the mean of the factor, and SD the standard deviation, to improve model convergence (Sunarto et al., Reference Sunarto, Kelly, Parakkasi, Klenzendorf, Septayuda and Kurniawan2012). We tested covariates for collinearity using Pearson correlations in R 3.5.1 (R Core Team, Reference R Core Team2018), and for correlated covariates (|r| > 0.6) removed one of the two covariates, to avoid biased estimates (Dormann et al., Reference Dormann, Elith, Bacher, Buchmann, Carl and Carré2013). There were high correlations between land-use type and elevation, distance to protected area and distance to river, and distance to road and distance to settlement (Supplementary Table 2). We retained the covariates that performed better in univariate occupancy models, based on a lower value of the Akaike information criterion (AIC), for multivariate modelling (Supplementary Table 3), and thus excluded land-use type, and distances from protected area and road.
We used a two-step approach (Penjor et al., Reference Penjor, Macdonald, Wangchuk, Tandin and Tan2018) to estimate probability of detection (P) and probability of species occupancy (Ψ). Firstly, we modelled detection probability (P) for each principal prey species in relation to study site (eastern vs western section) and trap effort. To identify the covariates that significantly affected detection probability, we used both univariate and multivariate detection probability models, keeping site occupancy (Ψ) constant. Secondly, we modelled the probability of site occupancy (Ψ) for each species in relation to the covariates elevation, slope, aspect, distance to settlement and distance to river. In all univariate occupancy models, detection probability was kept constant such as Ψ(covariate), P(.). Subsequently, we built best models based on AIC values (Burnham & Anderson, Reference Burnham and Anderson2004), considering all multivariate models with ΔAIC < 2 to be strongly supported by the data. We used model averaging techniques to determine the grid cell specific probabilities of occupancy considering all competing models. We examined model fit using goodness-of-fit tests with 10,000 bootstrapping steps. We used the mean untransformed beta coefficient estimate from the best multivariate model to predict site occupancy of the three prey species. The value of untransformed coefficients reflects the magnitude and direction of their influence on occupancy probability. We produced predictive maps for the entire study area using QGIS, based on inferences from the model-averaged outputs for the sampled grid cells.
Results
Of the 27 camera traps deployed, we retrieved 26 (one was lost); 14 from the eastern and 12 from the western section. The total trap effort was 1,080 trap-days. At least one prey species was recorded at 17 out of 26 camera-trap locations, yielding 368 independent images. Sambar was recorded at nine, barking deer at 11 and wild boar at 10 locations, resulting in naïve (survey-based) occupancy probabilities of 0.35, 0.42 and 0.39, respectively. Tigers were detected at five camera-trap locations.
The detection probability (P) of all three prey species was positively affected by trap effort (Tables 2 & 3). The likelihood-based analysis of sambar occupancy showed the highest support for the model that included slope, aspect and distance to the nearest settlement (Table 4), with occupancy being higher in areas that were further away from settlements, and on steeper and/or south-facing slopes. For barking deer, the model that included altitude and aspect performed best, and for wild boar, the model that included altitude and distance to the next river had the highest support. Occupancy of both barking deer and wild boar was higher at lower elevations. Barking deer occupancy was higher on south-facing slopes, and wild boar occurred mainly closer to rivers. Occupancy probability of barking deer was higher in the eastern (0.62 ± SE 0.06) than in the western (0.35 ± SE 0.07) section (Fig. 2b). This was also the case for wild boar (eastern 0.64 ± SE 0.09, western 0.24 ± SE 0.08; Fig. 2c). Sambar occupancy was higher in the western (0.57 ± SE 0.07) than in the eastern section (0.44 ± SE 0.06; Fig. 2a) The model-averaged probability of occupancy (Ψ) derived from top-ranked models (Table 5) was 0.49 ± SE 0.03 for sambar, 0.52 ± SE 0.09 for barking deer and 0.45 ± SE 0.07 for wild boar. In all cases, this was higher than the naïve occupancy (Fig. 3).

Fig. 2 Predicted occupancy probability of the principal prey species of the tiger Panthera tigris: (a) sambar Rusa unicolor, (b) barking deer Muntjacus muntjak and (c) wild boar Sus scrofa in biological corridor no. 8, which connects Jigme Singye Wangchuck National Park (JSWNP) and Wangchuck Centennial National Park (WCNP).

Fig. 3 Naïve (dark grey) and modelled (light grey) occupancy for the principal prey species of the tiger Panthera tigris in biological corridor no. 8.
Table 2 Detection probability (P) models, with the study site (eastern vs western section of the corridor) and trap effort (total number of active camera-trap days) as detection covariates, and with the Akaike information criterion (AIC), difference between AIC and the best-performing model (ΔAIC), model weight and likelihood, number of parameters (K), and twice the negative log-likelihood (−2LogLik) for each model. Occupancy probability (Ψ) was held constant.
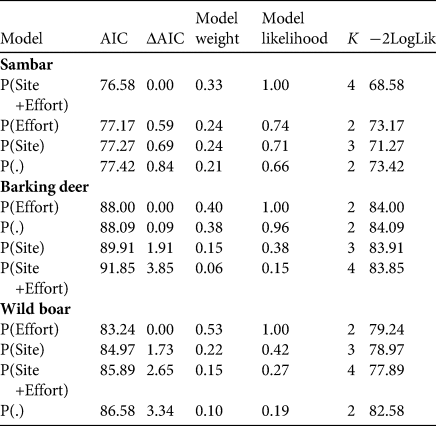
Table 3 Estimates of β-coefficient values for covariates influencing the detection probability (P) of prey species in the biological corridor in the top-ranking models (Table 2).
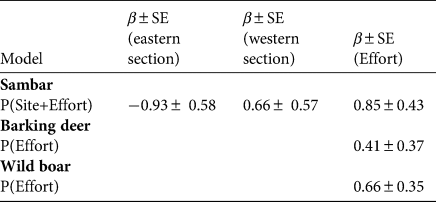
Table 4 Estimates of β-coefficient values for covariates influencing the occupancy of prey species (Ψ) in the biological corridor based on the top-ranking models (Table 2).
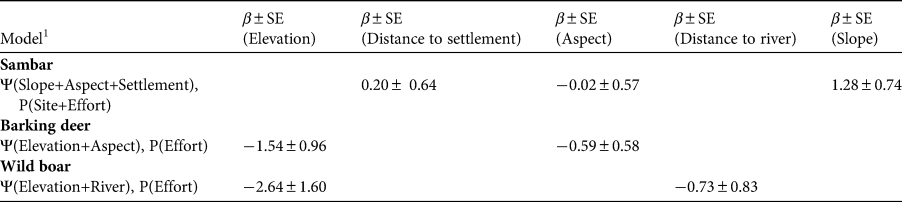
1 River, distance to nearest river; Settlement, distance to nearest settlement.
Table 5 Multivariate model selection results for the effects of various covariates on the occupancy probability (Ψ) of principal prey species. The table shows the Akaike information criterion (AIC), difference between AIC and the best-performing model (ΔAIC), model weight and likelihood, number of parameters (K), and twice the negative log-likelihood (−2LogLik) for each model. The top three models for each species are shown.
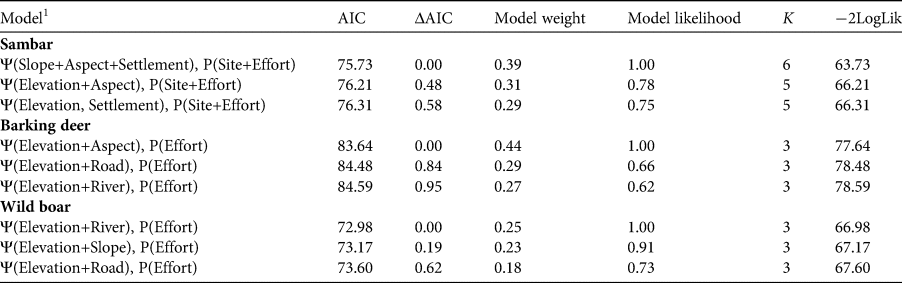
1 River, distance to nearest river; Road, distance to nearest road; Settlement, distance to nearest settlement.
Discussion
Our findings on the occurrence of the principal prey species of the tiger suggest that biological corridor no. 8 provides sufficient structural connectivity between Jigme Singye Wangchuck National Park and Wangchuck Centennial National Park to facilitate tiger movements between these areas. Overall, prey occupancy was relatively high in the study area, with at least one prey species photo-trapped at 17 out of 26 grid cells, and naïve occupancy for each species 0.35–0.42. Occupancy estimates were highest for barking deer, followed by sambar and wild boar. The fact that habitat covariates retained in the best models differed between species suggests niche partitioning between these three sympatric ungulates. This is important for maintaining a balance between predator species abundance and resource availability (Cooke et al., Reference Cooke, Woodfine, Petretto and Ezard2016).
Barking deer and wild boar, and to a lesser extent sambar, preferred lower elevations (for sambar, see models in Table 3 with ΔAIC < 2). This corroborates Tempa's (Reference Tempa2017) findings for these species across Bhutan, showing a negative influence of elevation on occupancy. All three species have a wide altitudinal range, but with few records above 3,000 m for barking deer and wild boar (Oliver & Leus, Reference Oliver and Leus2015; Timmins et al., Reference Timmins, Duckworth and Hedges2016). Sambar may occur up to 3,800 m (Timmins et al., Reference Timmins, Kawanishi, Giman, Lynam, Chan and Steinmetz2015). We recorded sambar, barking deer and wild boar at a maximum of 3,686, 3,652, and 3,521 m, respectively. Sambar and barking deer occupancies were higher on south-facing slopes (see also Forsyth et al., Reference Forsyth, McLeod, Scroggie and White2009 for sambar deer in Australia). It is unknown whether south-facing slopes are preferred for thermal reasons (temperature, wind shelter; Moore, Reference Moore1994) or associated vegetation structure and composition. Sambar deer were recorded more frequently on steeper slopes, supporting the findings of Johnsingh et al. (Reference Johnsingh, Qureshi, Goyal, Rawat, Ramesh and David2004) and Kushwaha et al. (Reference Kushwaha, Khan, Habib, Quadri and Singh2004), who documented a preference for hilly terrain. This could be because such areas are less accessible for people. Wild boar occupancy was positively affected by rivers, reflecting the species’ preference for moist habitats such as riverine forests or marshes (Graves, Reference Graves1984). In addition, agricultural fields, to which wild boars are often attracted, are generally located near rivers in Bhutan. Elevation had a stronger effect on the occurrence of all three species than land-use or forest type, which is surprising as vegetation type is expected to be an important factor affecting the availability of shelter and food (e.g. Moore, Reference Moore1994). However, this finding agrees with an earlier study on sambar (Forsyth et al., Reference Forsyth, McLeod, Scroggie and White2009), and can probably be explained by the fact that all three species are opportunistic generalists and able to thrive in a broad range of forest types and environmental conditions (Oliver & Leus, Reference Oliver and Leus2015; Timmins et al., Reference Timmins, Kawanishi, Giman, Lynam, Chan and Steinmetz2015, Reference Timmins, Duckworth and Hedges2016).
Sambar showed a slightly higher occupancy in the western section of the corridor, whereas barking deer and wild boar were more common in the east. The overall higher prey occupancy in the east is probably related to its lower mean elevation and proximity to a river and agricultural fields (the latter located outside the study area). In Bhutan, the relative abundance of wild boar and barking deer is highest in areas close to croplands (Thinley et al., Reference Thinley, Lassoie, Morreale, Curtis, Rajaratnam and Vernes2017). Both species regularly damage agricultural fields (Wang et al., Reference Wang, Curtis and Lassoie2006) and are relatively tolerant of human disturbance (Tempa, Reference Tempa2017). In addition, the high intensity of seasonal grazing in the western section (Letro & Fischer, Reference Letro and Fischer2020) may negatively affect prey species abundance.
The occupancy patterns of these three principal prey species of the tiger suggest that biological corridor no. 8 is potentially important for facilitating tiger movements between the two adjoining national parks. The eastern section of the corridor may be more suitable for tiger movements because of higher probability of prey occupancy. However, tigers were recorded at three and two locations in the eastern and western sections, respectively. This could be because of variation in other factors such as the availability of domestic prey, which also influence tiger movements (Bagchi et al., Reference Bagchi, Goyal and Sankar2003; Sunarto et al., Reference Sunarto, Kelly, Parakkasi, Klenzendorf, Septayuda and Kurniawan2012). Letro & Fischer (Reference Letro and Fischer2020) reported frequent incidences of livestock depredation by tigers in the corridor. To ensure the connectivity of tiger populations in the two national parks through this biological corridor, we recommend assessing prey species density, and protection of prey species through patrolling. The management of the biological corridor should be enhanced through the development of conservation management plans. These should include adequate land-use planning and local forest management plans, to reduce anthropogenic disturbances and minimize habitat fragmentation.
Acknowledgements
We thank the management of Jigme Singye Wangchuck National Park and the Nature Conservation Division, Department of Forests and Park Services, for their support; the National Geographic Society, the Mohamed Bin Zayed Species Conservation Fund and The Rufford Foundation for funding; Wangchuk Dorji, Tshering Dorji and Thinley Lhendup for assistance with data collection; and the anonymous reviewers and the editors for their help with improving the article.
Author contributions
Study conception and design: LL, KF; securing research funds: LL; data collection: LL, DD; data analysis: LL, KF, TT; writing: all authors.
Conflict of interest
None.
Ethical Standards
This research abided by the Oryx guidelines on ethical standards and was approved by the Research Steering Committee of the Department of Forests and Park Services, Ministry of Agriculture and Forests of the Royal Government of Bhutan (application ID: 5841017285A0C0133DD581). The fieldwork was conducted with approval of the Honourable Director, Department of Forests and Park Services, Thimphu, Bhutan (no. DoFPS/NCD/Adm-01/2018/8269).


 Open access