

The Chairman (Mr R. A. Galbraith, F.I.A.): I am Richard Galbraith. I am a member of the Institute and Faculty of Actuaries (IFoA) Council, the Risk Management Board, and I am Chief Risk Officer at Mobius Life.
To introduce the topic tonight we have the Risk Measures Working Party. Susan Siew is a qualified actuary with over 12 years of experience. She joined Aviva in 2011 and is currently a Senior Risk Actuary within the Actuarial Function Team. She focuses on economic capital calibrations. Prior to that, she was a consultant at Ernst and Young for 5 years, and she has extensive experience in assumption-setting and reviewing results across all reporting metrics. In recent years, she has been working in areas which focus on credit-related assumptions.
Belinda Hue is chair of the working party and is a qualified actuary with experience in the life insurance industry. She is also an investment professional and experienced investor. She covers a number of asset classes including equities, fixed income, and alternative investments. As an author and researcher, she has been, inter alia, a founding member and chair of the IFoA Risk Measures Working Party since 2016.
Andy Jinks is one of the Chief Actuaries in the Government Actuary’s Department (GAD) Insurance and Investment Team, and leads GAD’s advice on a number of investment-related issues including the GAD asset liability modelling, in particular in relation to providing support to the pension protection fund (PPF) and the pensions regulator. He has also worked on the transfer of Royal Mail’s pension scheme liabilities and assets to the government and the subsequent sell-off of transferred assets. Further, he has also been involved in the launch of a new asset class for the sale of student loans, and also forthcoming support to the Lord Chancellor as part of the review of the personal injury discount rates, the Ogden rates.
Jon Spain spent 16 years with Duncan C. Fraser and Clay & Partners. After that, Jon spent 28 years at GAD. His whole career was spent in Defined Benefit (DB) pensions, previously advising a range of private sector trustees on sponsors and scheme funding in mergers and acquisitions. At GAD, he acted for a wide range of public sector pension clients with diverse problems. Apart from gaining his FIA in 1977, he has qualified as fellow of the Chartered institute of Arbitrators in 1997. No longer acting for clients, he is continuing personal research, focusing on long-term budgeting.
Mahesh Bora is a member of the IFoA, and he is nearing qualification as an actuary. He is also certified Financial Risk Manager (FRM) and Association of Chartered Accountants (ACA). He has extensive experience in the banking industry across varying areas, namely capital stress testing, asset liability management, financial planning, and analysis. Currently, he is working in treasury, in the liquidity risk management function of the sales and trading business at Citibank.
Ms B. Hue, F.I.A.: Welcome to investment risk for long-term investors. The subject matter we are dealing with is inherently subjective, and all views expressed are those of the individual authors and presenters, and not those of the employers or affiliated organisations. We are not giving any form of investment advice. This is simply a reminder to be extremely cautious when visiting this material at a later date.
So, the scope of our research is very simple, in terms of framework. There are just two things you have to ask yourself, or remember. One is, “What risk are we dealing with?” The other is, “From whose perspective?” We are dealing with the topic of investment risk from the perspective of the investor, the primary and most important stakeholder, without whom the investments would not exist. So, what, then, is investment risk? Figure 1 shows cash flows available at a given future point in time.
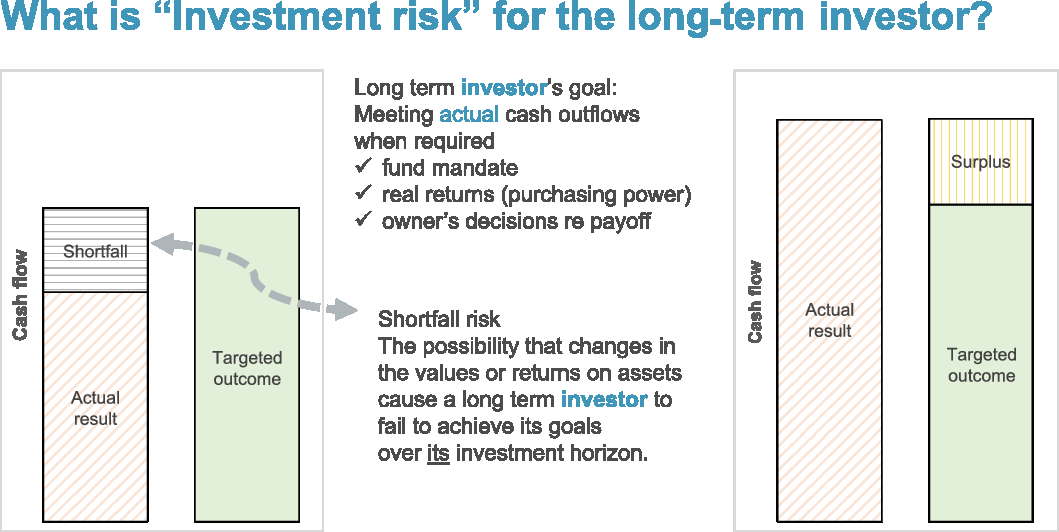
Figure 1. What is investment risk for the long-term investor?
They are not present values or reserves on a balance sheet. They are just single cash flow amounts at a given point in future time. So, the green-shaded bars are the targeted outcome. On the charts on the left and right, the height of the green-shaded bars is the same, because this is one targeted outcome for one single point in time. On the chart on the left-hand side, that is the scenario where the actual result is less than the targeted outcome, so there is a shortfall generating shortfall risk. In the scenario on the right-hand side, the actual result exceeds the targeted outcome. So, in this case, there is not a shortfall but, in fact, there is a surplus.
We are dealing in the world of people, of humans, of emotions, of social transmission and institutional structure. Some ideas are set out in Figure 2.
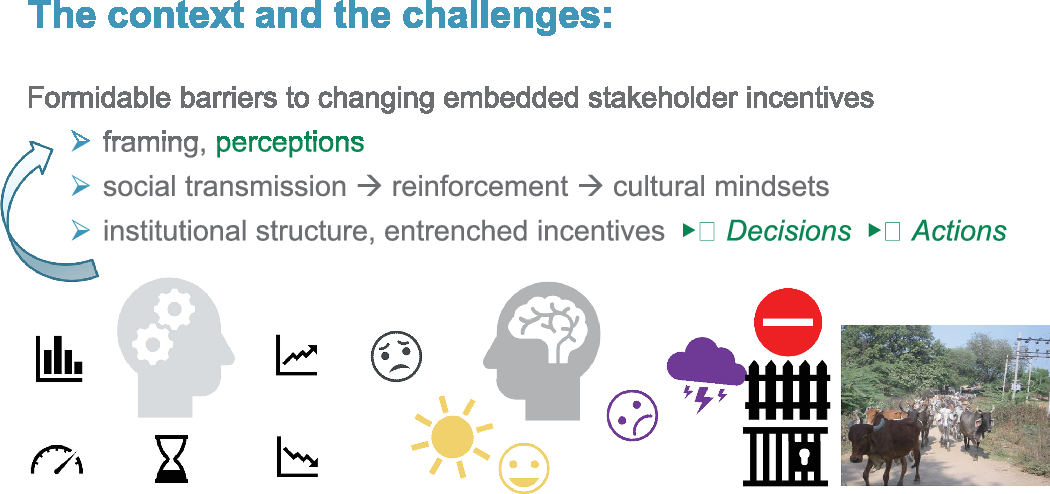
Figure 2. The context and the challenges.
Mr J. G. Spain, F.I.A.: While I would not want to suggest that anybody breaks the law, I hope you will agree that regulations ought to be fit for purpose, and you should not be just following regulations blindly.
One of the problems over the past 15 years is that DB pension schemes have had their funding assessments based on, essentially, what is a form or interpretation of financial economics, which has not worked. In fact, there is no evidence anywhere that financial economics can be applied successfully to long-term entities. If anybody can find such evidence, please let us see it. I have asked a couple of people to find it for me, and they have not been able to. This idea is not new. Simon Carne wrote this in a Staple Inn Actuarial paper in 2004. I agree with him on that. It would have been good if some of the papers on applying financial economics to DB pension schemes had included some sort of back testing or future stochastic processes, but they did not.
One of the things that we are told, in the DB pension space, is that we should be aiming at prudence. The trouble with that is that, unless we know what the best estimate is, we do not know if we are being prudent, or over-prudent. I do not believe there are many, if any, such estimates of best value. IAS 19 is not a best estimate. One of the things, also, about financial economics is that volatility is expressed as being a risk, leading to volatility, leading to deficits. Unfortunately, the assumption is then made that there will be no volatility, everything will be the same, so whatever was in The Financial Times this morning about conditions last night will stay the same. This seems to me to be inherently contradictory.
Now, that is not the major problem. The major problem is the discounting process that has been applied, present values, v n, and so on. We claim to understand risk, but there is very little information ever provided to stakeholders in the DB pension space about the risks. As far back as 1977, a New York University professor said that. As recently as 2012, together with ACCA and CISI, Long Finance produced a report on accounting on a confidence basis. Not everybody believes that is a good idea, but the idea that points in time, and what you see, or you think you see, at points in time, may not be terribly helpful but is definitely still around.
One of the other things is that when we produce a number that is based on v n, we do not actually say what that represents. Is it a mean or a mode? Is it a specified percentile?
You could say that the pension fund liability might be best looked at as a probability distribution. That is not my original thought at all. Tom Shucksmith said that back in 1948 on Colin Puckridge’s 1948 paper. I was not there, but it is in the JIA literature and is well worth reading. Risk quantification is very poorly captured by scalars. We should be moving more and more, if not completely, towards stochastic approaches. Yes, all we had was capitalisation. We have had it for 2,000 years. We can do better now, and we ought to. Compression, over time, destroys information, and that leads to fake news. For long-term projects, we should not be using discounting alone.
Finally, and as our chairman is on Council perhaps I can ask him to take this back to Council, could the profession please start looking more closely at what our unique selling point (USP) is? I have wondered about this for over 30 years. I have been asking presidents for the past 10 years, not all of them, to start concentrating upon that, because the USP is not teaching mathematics. It is not about doing clever stuff such as algebra, because anybody can do that. Anybody can play with big data. We should be contributing judgement, which is better informed than we can ever obtain from discounting. There is one unique future, but none of us know what that will be, so we need assumptions. If we are going to use assumptions, let us use them intelligently.
Ms S. Siew, F.I.A.: I am covering this topic from an insurance perspective. So, the first things that I want to talk about are some of the factors that might be driving changes in investments in real assets. There has been a shift in, or a change in, product demand over the years. In particular there has been a shift away from with-profit products where, traditionally, we have had quite a lot of investments in equities and property, towards unit-linked products which have gained favour over time. A lot of this is driven by the fact that consumers started to lose confidence in with-profit products following the fall of Equitable Life and the mortgage endowment mis-selling scandal.
Now, unit-linked has still a relatively large proportion of investment in equities and property. However, this is not really within the control of the insurer. It is all driven by consumers and what they want to invest in. So, some of the things that we looked at were around Solvency II requirements. The Solvency II formula capital charge for type one equities is 39%, and 49% for type two equities. You can look at that and think, “Oh, gosh, that is a very big amount.” Now, within the equity shock, they do include this symmetric adjustment of ±10%. That is something that has only been adopted by standard formula firms so far. We are not aware of internal model firms using it. That symmetric adjustment is calibrated based on how current index values compare with the index over the past 3 years.
The other area where Solvency II requirements may affect how insurers invest in real assets is how the Solvency II solvency capital requirement is calibrated. It is now based on a 1-year value at-risk (VaR) approach. We should really be asking, “Could this be putting too much emphasis on short-term volatility, rather than thinking about long-term volatility?” Insurers have liabilities which are very long term. Having a 1-year VaR framework, could this be incentivising insurers to sell in the short term, when the market is very volatile, rather than holding on, and withstanding that volatility?
The other thing around the Solvency II framework is that it requires assets and liabilities to be valued on a market-consistent approach. Again, could this be leading to pro-cyclicity, where in times of falling market values, this could be getting insurers to sell higher-risk assets to fund purchases of lower-risk assets. Again, it is thinking about, “Should they be riding out the volatility?”
Between 2016 and 2017, the UK Treasury Select Committee carried out an inquiry into the Solvency II directive, to understand how it impacts the insurance industry. Here are some of the comments that the insurance industries have made to the UK Treasury Select Committee. There has been some criticism of the market-consistent techniques, where it has been unique that market-consistent techniques are neither stable nor verifiable for the full range of assets and insurance liabilities. In particular the requirement of a market-consistent technique is that it assumes that the market-consistent hypothesis holds at any point in time, and assumes that prices reflect all available information to the market. This may not necessarily hold true in a crisis.
Another comment has been that market-consistent approaches have discouraged investment in equities other than when policyholders bear the risk, such as on unit-linked business. Now, we could look at it from the positive and the negative angles. Where it is positive, it could be that this discourages firms from giving over-generous guarantees. However, this could also be viewed to be discouraging long-term investments. So, for example, if you are looking for strong returns over 20 years, or real returns, then you might expect that this would be positively correlated with inflation, but over a 1-year period you may see that it is negatively correlated.
The other thing that is worth mentioning is that there have been some comments, or a general theme, that insurers felt that, due to the stringent Solvency II requirements, and in particular some of the matching adjustment constraints, quite a lot of companies had to jump through hoops before they could include suitable assets within the matching adjustment portfolio. Examples of this include having to restructure floating rate notes for equity release or decomposing property assets into income strips and residual property values.
So, what are the potential mitigants? Within the Solvency II requirements themselves, the long-term guarantee package, the allowance of a matching adjustment and volatility adjustment does help to balance things out a bit. Earlier, we mentioned the equity dampener but, again, the take-up tends to be from standard formula firms. These measures are still viewed by the industry as overly prescriptive. Who knows, there may be an opportunity, post-Brexit, for a principles-based approach? There was also feedback that, while the matching adjustment has a generally high take-up in the UK, the volatility adjustment was viewed, in general, as having rules that were too rigid.
So, what else could we do or think about how to reduce pro-cyclical effects? I have pulled this out from a paper from Kamran Foroughi, where he suggested four main things to consider: do not pin all your decisions purely on one metric, think about multiple metrics; recognise that the efficient market hypothesis might not necessarily hold in financial crisis; think about the regulatory crisis regime, which is a bit more flexible in times of crisis; and make sure that you shore up capital requirements during benign periods to meet losses during a crisis.
Mr M. Bora: I will be walking through the equity portfolio risk and return section. I will look at equities as an asset class, specifically in the context of a long-term investor, and basically look at the risks, as well as the returns. In Figure 3 we have illustrated the S&P 500 equity returns realised over the past century.
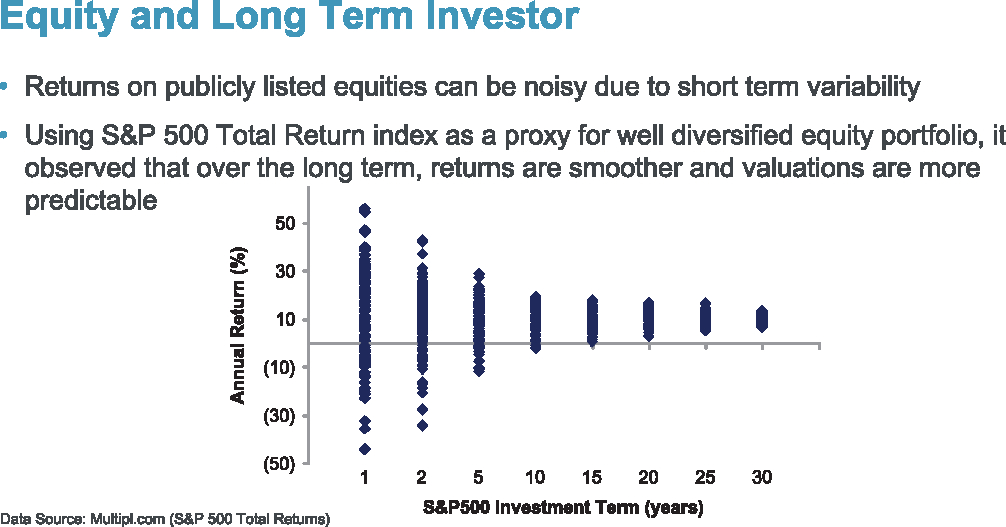
Figure 3. Equity and long-term investor.
We have chosen S&P 500 as a representation of an equity investment portfolio as it is a globally recognised benchmark of well-diversified equities. In the chart, we have illustrated the S&P 500 annual total returns for various periods of investments, ranging from around 1 year to up to 30 years. The blue dots basically indicate the annual returns we have observed over the past century.
In the 1-year period, we can see the blue dots ranging from –50% to up to more than 60%, which basically indicates that, for the past century, annual returns for a 1-year period of investments have ranged from negative 50% to positive 60%. This indicates the short-term variability of equity returns. However, as we go along, and the investment term increases, the variability of equity returns reduces significantly, which we can see from the results as the returns converge around a certain level. This is the key for a long-term investor.
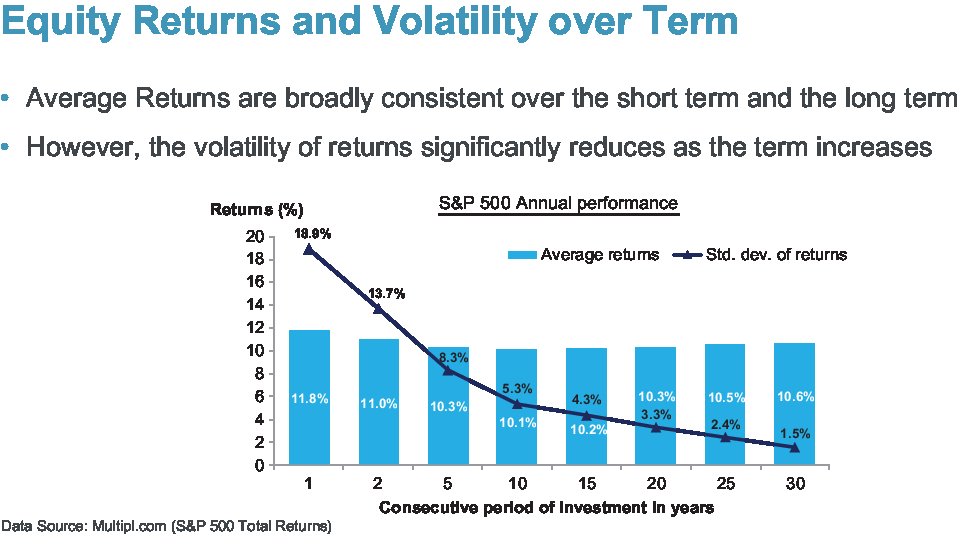
In Figure 4, we can observe the annual average S&P 500 total returns in the light blue bars, and the standard deviation of the S&P 500 returns is shown by the dark blue line. Here, again, we can see that, as the term of the investment increases, the volatility of returns reduces significantly. While the average returns of S&P 500 across all of these terms of investments is broadly consistent, within the 10–11% per annum range, indicating that returns are pretty similar, as we invest for much longer periods of time equity tends to deliver more consistent returns, with much less risk.

Figure 4. Equity returns and volatility over term.
Figure 5 looks at the performance of equities against possible desired investment outcomes, such as beating inflation. Here we compare the average annual performance of S&P 500 to the US CPI. The annual average outperformance is represented by the light tan bars, and the dark tan line represents the number of observations, during the past century, when the S&P 500 underperformed the US CPI. As we can observe from this graph, there is a very high risk that equity returns underperform inflation when the term of investment is up to 5 years. However, this risk reduces significantly as the term of investment increases beyond 5 years, and disappears when the term of investment is 20 years or more. This signifies that, over the past century, equity returns have always been higher than inflation when the investment term has at least been 20 years, with the average level of outperformance around 7%.
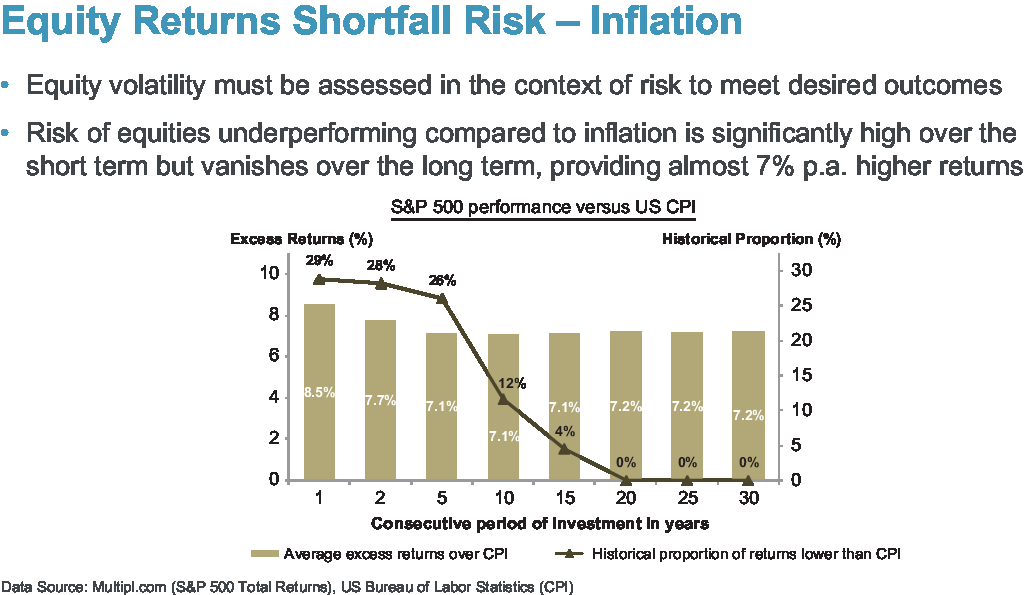
Figure 5. Equity returns shortfall risk – inflation.
In Figure 6 we compare the equity returns against alternate long-term investments, like government bonds. The average annual S&P 500 outperformance is represented by the light grey bars, and the proportion of observations in history when equities underperformed the US 10-year Treasury yields is represented by the dark grey line. Again, there is a very high risk of equities underperforming the treasuries, more than 25% when the term of investment is up to 5 years. As the term of investment increases beyond 5 years, there is a decrease in the historical proportion of underperformance, and beyond 25 years we have not had an instance, during the past century, when equity returns were lower than the US 10-year Treasury yield, with an average outperformance of around 5% per annum.
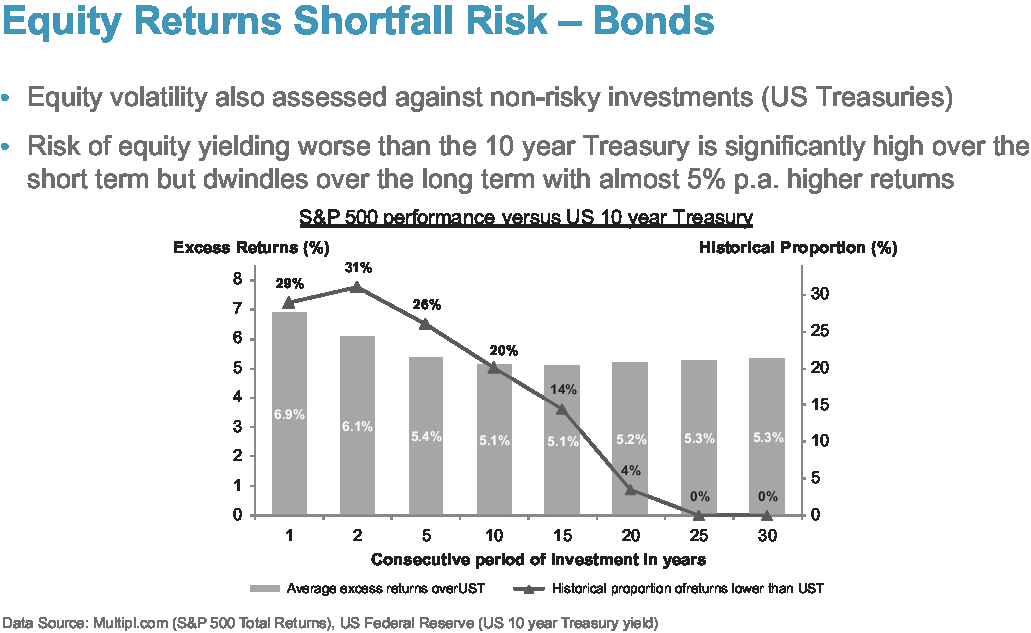
Figure 6. Equity returns shortfall risk – bonds.
This analysis basically all indicates that, in terms of equity returns, the risk needs to be taken in the right context for a long-term investor, because what is risky for a short-term investor may not necessarily indicate risk for a long-term investor. So, the risk has to be evaluated in the right context. Before we move on to the next section, I would just like to add that the analysis that we have presented here takes into account the equity performance over the past century. While we do understand that past behaviour may not necessarily hold for future performance, we believe that the conclusions are credible since this analysis uses data over a century, which basically means it has a sufficiently large number of sampling points, while it also includes periods of significant macroeconomic and geopolitical change, like the 1929 Great Depression in the US and the two world wars.
Mr A. L. Jinks, F.I.A.: So, summing up, the key ask of the working party is essentially how risk measurement approaches influence the investment decisions that entities are making, and whether that is leading to suboptimal decisions in terms of their asset allocation. So, we have heard from Jon (Spain) and from Susan (Siew) how these things are actually playing out in the industry as we speak. My job at the end here is to just try and take a step back and look across entities, and consider people facing different problems. A general point for all risk measurement approaches is that a lot of the decisions that the entities face depend on a vector of cash flows, rather than a single point. So, Jon (Spain) said that compression suppresses information, and I think that is one of the key points that applies across all the risk measures here, and we will come on to that as a limitation.
These were the areas that we think are relevant when deciding upon your risk measurement approach. For the modelling methodology, so that is in terms of the valuation method and the assumptions that you are going to use, such as the discount rate, or how you are going to place a value on the liability, you need to think about over what time horizon you are doing your projection. Are you looking at your risks over a 1-year measure or over many years? Are you projecting to when all the claims have been paid, or all the benefits have been paid? You need to think about your asset calibration. So, are you going to mark to market in your asset calibration? Your confidence level; Solvency II obviously refers to one into 200, but other areas use other confidence levels when they are looking at the level of risk.
A lot of risk measurement approaches think about applying shocks. That is the definition of risk, I suppose. In defining those shocks, we need to think about what magnitude of shocks we are going to consider, and when they are going to play out. We can assume that those risks materialise immediately, and we are interested in the recovery from that. Or are we interested in those risks emerging over a period?
Perhaps most importantly, what are we going to measure? So, are we going to measure VaR, tail VaR, expected shortfall, and so on? I think I would probably say the most important thing is how we are going to communicate it as someone has to make a decision on the back of that risk measure. A common theme across all the risk measurement approaches that we looked at and considered is that none are perfect. In particular in relation to emerging and unknown risks, like climate change, it is very hard for any risk measure to capture those.
I am going to cover briefly, at a high level, some risk measures that cut across practice areas, starting with market values. This is broadly defined as the price paid to take ownership of an entity’s assets and liabilities, and it is widely used in regulatory and accounting circles. You might argue that, strictly, this is not a risk measurement approach, it is more of a benchmark assessment of solvency, but we thought it was worthy of inclusion, of comment, because it is likely to be of particular interest during periods of stress, which are when risk measures come into their own.
The key advantage of market values is that they are objective. They are based on recent marginal trade and you can go to a Bloomberg terminal and look them up. They are simple and transparent, at least for things that are listed on a Bloomberg terminal. Market values are immediate, evolving, and updating every second.
They do, of course, come with some disadvantages. One might argue that they encourage and overly focus on accounting values. You could question whether that is truly reflective of the true economic substance of an entity’s obligations and liabilities. The fact that these things do update in seconds might provide too much of a focus on the short term, especially when, for the long-term investors that we are considering here, their liabilities are more likely to move at a more glacial pace. So, there might be a mismatch there. They also, of course, depend on marginal trades. So, the price that is paid is more reflective of that marginal trader’s circumstances, which may not be representative of the universe of investors that we are interested in. Although they are available for lots of things, they are not available for a lot of other things, not least unlisted assets and many liabilities.
Moving on to volatility. Again, maybe not strictly a risk measure, but it sometimes can be, and it is often a key assumption in other risk measures. So, we need to be clear about whether we are talking about observed and historical volatility or prospective volatility. Again, a lot of the time we are focusing, here, on prospective volatility, and how that feeds in, as an input, to other risk measures. It is also commonly used, and relatively straightforward to understand. Most of our clients or decision makers may not have actuarial qualifications, but they probably understand a standard deviation from their GCSE maths. The advantage for us is that there is plenty of data from which to set assumptions, and it also makes our life easier when we are building our models.
The disadvantages of using volatility are well known, not least asset returns not being normal, or lognormally distributed, and correlations not being constant. So, in those times of stress, when you want your risk measure to hold up, and see whether you are right, the chances are that the correlations are not constant, and that may cause you some issues. The other key thing that volatility has against it is that it does not necessarily link to the objectives of the investor, or capture all the risks that they face. So, it does not really say anything about the liquidity risks that an investor faces.
The next one that we talked about in the paper, again, may not be a risk measure, but is a way of setting a discount rate assumption in a funded pension scheme, and we think it might have relevance and read across to other measures. What we are doing in Figure 7 is considering the return on a fund for a pension scheme investor over the full term of the liabilities, and essentially what we are going to do is use that distribution of returns to help set the discount rate, which is an important part of the valuation basis. Let us say that the expected return is 3%. I have said over inflation there, but it could be over gilts. It does not really matter as we are just trying to illustrate a point. How I have often seen this used is as the level of risk. One of the key considerations in setting the discount rate will be the strength of the sponsor. So, for a sponsor with a strong covenant, you might set the discount rate quite close to that expected return, say 2.25%. In that case, you are 60% certain that you will beat 2.25%. For a weaker sponsor, you might want to be a little bit more prudent in your valuation approach, and have more confidence that you are going to beat that. So, you might set the discount rate at 1.5%.
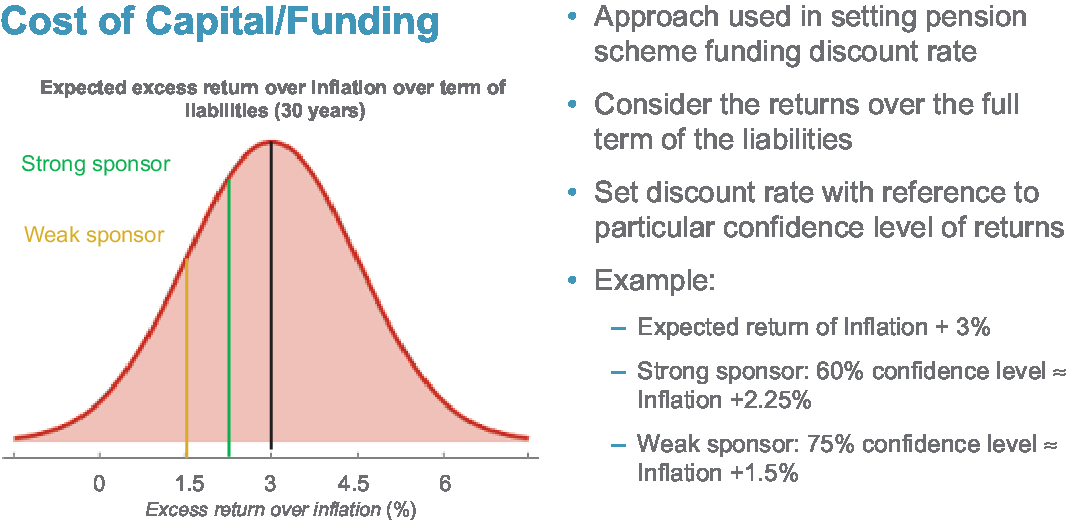
Figure 7. Cost of capital/funding.
The advantage of this approach is that you are being more explicit about the level of prudence that you are setting, and you are articulating the level of investment risk that you are taking. What the paper discusses, briefly, is whether that could be flipped to ask the question, “What level of return would be needed to achieve a certain probability of meeting a given set of liabilities, and how might that compare to a cost of capital approach?”
The final risk measure that I am going to talk about is the probability of success and failure. The paper refers to a case study on this topic, of how the PPF use this approach. This is where Figure 8 comes from. Essentially, here, the institution starts by defining what success means to them, and what failure means to them, and being clear on when that assessment needs to take place. So, when the PPF do their assessment, they measure success or failure at the end of this chart, at 2030. Essentially, they have a stochastic model that simulates the position of the entity. Scenarios above this red line would count as success, and scenarios below this would count as failure.
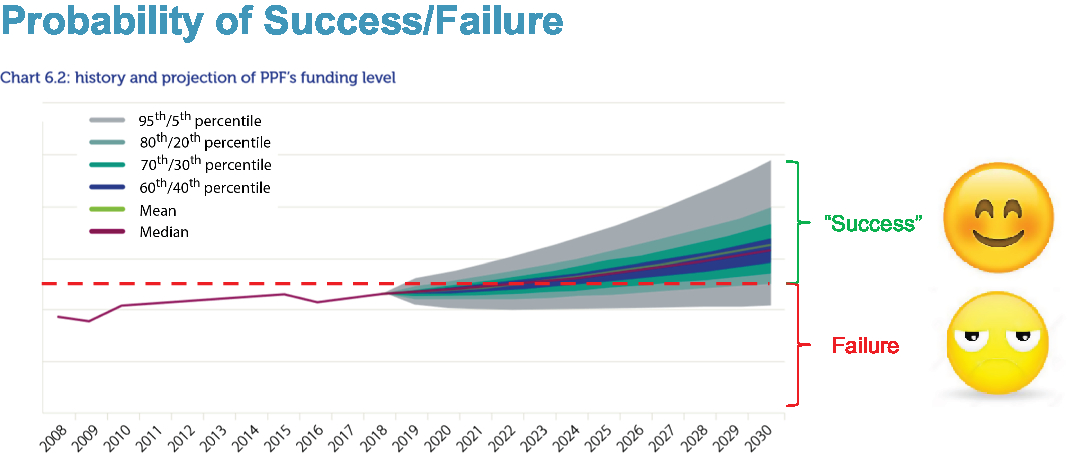
Figure 8. Probability of success/failure.
Now, the advantage that this approach has over other risk measures is that it is linked to the business objectives, in particular in respect to the time horizon. The investment period that you are making that risk assessment over is fully reflective of the period of investment.
There are drawbacks, not least building these sorts of models is a significant undertaking, and you still cannot get away from the fact that they rely on several key assumptions. So, in here are the economic scenarios that are being used, and behavioural ones that may be outside your control, but it does give you value. The other key challenge with this approach, especially when you are doing multi-year modelling, is allowing for management actions. So, you are defining success and failure in 15 or 20 years’ time, and trying to demonstrate those results to the board to allow them to make a decision, but the chances are that they will not be there in 15 or 20 years’ time, and their successors might not make the same decisions that we assume they are going to make. But that conversation can be helpful, to actually discuss and obtain agreement on that. The other potential risk is that it leads to overreliance on the modelling, and provides false comfort.
That is a very quick outline of some of the risk measures that are considered in the paper. There are some others in there. What were the key themes that we found when we doing all that work?
The first one is that these things matter. Both business management decisions and the risk measurement approaches that are mandated by regulators do have an impact on the way that entities make investments. The optics here can make an impact. So, people are either required to comply and report in a certain way, or they have a desire to comply and report in a certain way, and that does drive decisions.
The second thing is that the key risk to these entities does not depend on what they are investing in, or the risks that are associated with the investment that they are making, but on their objectives and on their ability to meet their liabilities. So, essentially what we are saying is that the fundamental economics of them needing to meet their liabilities does not get the same level of attention as regulatory risk measures, or indeed some of the behavioural biases that can come into investment decisions.
The third one is the way that investment risk is framed often puts a focus on the short term. Rarely do we say the risk of poor returns from low-risk investments, we tend to focus more on the higher-risk investments. The key point that we are trying to make there is that the market risk of investing in equities does not equal the investment risk that a long-term investor is making. The liquidity risk is not the same as being able to sell their investments quickly. It is about them being able to make sure that they can meet the cash flows that they have got to meet.
Fourth, risk avoidance itself is risky. So, this is emphasising that there are two sides of a distribution. A lot of focus is on the left-hand tail, but, quite often, there is not as much focus on, “Are we giving up the right-hand tail of the distribution?”
Fifth, one size does not fit all. So, as Susan (Siew) said, the Foroughi paper reinforces the point that there is not just one magic number that we should all be focusing on.
Finally, shifting landscapes. What we mean by that is things change, and it is important for us all to make sure that we keep on reflecting, and asking ourselves, “Are the risk measurement approaches that we are using fit for the purpose for which they are being used, and for making those investment decisions?”
Mr A. M. Slater, F.I.A.: I think it is long overdue to have a paper that reminds us that we are talking about a social science and not physics. I have sat through too many papers in this hall trying to present financial economics as a branch of physics, which it is just not. I am not a fan of financial economics and have cautioned before that its naïve application is dangerous, and I think we have seen some of those dangers highlighted by our speakers.
My first comment is focusing more on the investment side, where one of the key measures, or key characteristics, we care about is around equity versus inflation. I was taught, when I started my actuarial training, that equity investment is a good match for inflation in the long term. I come from a pensions’ background more than an insurance background. Then we had financial economics overturning this almost overnight with, let’s say, its dogma of “the only investment is fixed income” and “discount rates are risk free,” whatever that is. I would say both approaches are right and both approaches are wrong.
The reason I say that is that there is a term structure to the correlation between inflation and equity returns. At very short durations, the correlation is zero, it may actually be negative, but as the term increases, maybe up to 20 years plus, that correlation does increase to around 0.4–0.5. This is something we observe in the UK, the US, and many other markets, it is not unique to the UK, it seems to be a permanent feature of the markets. Therefore, both are right, depending on which end of that term structure you are looking at, and both are wrong because neither is looking at the full picture. Neither approach takes into consideration the purpose or time horizons and many of the other features that the speakers were talking about.
My second observation is if we are talking about short term versus long term, we do need to ask ourselves, “How long is the long term?” A few years ago, I heard Professor Elroy Dimson, from London Business School, who has the definitive database of long-term returns from an increasing number of countries, give his answer to that question of, “How long is long term?” He used his database to analyse, country by country, what period of investment you need to have to have a high degree of confidence, I forget whether it was 95% or 99% confidence, that equities will outperform inflation. The answer is that it depends on the country. At the shortest was the US at 17 years, and the longest was Italy at 77 years. Therefore, the long term can be quite long, but the long term is different from the short term.
Mr Jinks: One thing I would say is that when we were writing the paper, we did have a brief discussion on “What do we mean by long term?” I agree with Andrew (Slater) that it is not really easy to define. I think we probably found it easier to define the long term by what it is not than what it is. So, I think it was easier for us to say, “These investors are probably short term and out of scope,” than it was for us to say, “These are long-term investors and therefore in scope.” So, that is why we were intentionally quite vague on that.
Mr M. J. Clark, F.I.A.: A very wise colleague of mine many years ago said that risk is an ex ante concept which has an ex-post friend called Pain. So, whenever we look at risk, we are often using past data, whereas, clearly, risk is entirely a forward issue. I am probably a greater fan of market values than most of the people in this room, and possibly the panel, although, clearly, market values have deficiencies. I wonder if the working party has spent time looking at “All Swans are Black in the Dark”, which tells us quite a lot about how risk is priced by markets, or not priced, beyond about 3–5 years.
So, the foundation of market values, and picking up one of the points from Foroughi, is that it is not just in crises that things may be different, it is also on a regular basis. If you want an example of a risk metric, slightly esoterically, I offer you the risk of the inevitable policy response of regulators and policy makers to the Paris Agreement. We are probably familiar with the Paris Agreement, the ratchet effect, and the fact that the countries have to report on their climate change policy. So, I suggest one risk is that there will be a severe policy response in the coming years. There are people beginning to quantify that, so it is actually a quantifiable risk, putting a probability on that will lead to regulation and possibly the pricing of carbon.
When we speak about investors, we ought to think about the time horizon of our principals. So, our principals will be trustees, they will be insurance companies. In my world, we talk about asset owners and investment managers. Investment managers basically do what their asset owner clients want. I think of the time horizon of the asset owner, which may be long term, and we encourage the long term, but it could be shortened; there may be a move suddenly to buy out, or there may be evolving policy and regulatory changes. So, although we love the long term, we need to be aware that, all of a sudden, we may need to walk across the road to an insurance company, and it actually is the market values that count.
For the record, anybody who does not value liabilities at other than bond rates, I believe, is misguided. I will buy that bit of financial economics. Clearly, if you put it together with the liabilities and the assets, there is a question about monitoring an entity. So, the other comment, just to think about, is that beta in financial economics is not a given. If I am an asset owner, I could begin to choose my own beta. We tend to think of beta as a simple specification of the market, but as a trustee, I can decide to avoid carbon risk if I believe it is mis-priced, which I happen to do, so I can begin to choose my own beta. So, I think the financial economics that we have grown up with, we can begin to evolve in useful ways to think about, “I will choose a beta which reflects my capital market risk desires which are not totally framed by financial economics but by the real-world risk that I face.”
Mr Spain: Just one comment on that. We did talk about whether or not the sponsor did have a long-term horizon without which the trustees of a DB pension scheme could not have one. That should all be part of the statement of investment principles, statement of funding principles, but whether or not that is actually taken into account in either of those documents is unclear to me, but certainly, it is important. Without a decent long-term horizon, you just cannot talk about this, and you have to go for other solutions. I agree with that.
Mr Jinks: The other point I would make is we also discussed in the paper briefly the role that having delegated authority has on some of this. The fact that if trustees are making decisions on behalf of members and so the decision is delegated, that can also create certain incentives to behave in certain ways.
Mr D. Simmons, F.I.A.: I have three comments. One is really less aimed at the authors, but more at any Council members sitting here. Near the beginning of Andrew (Jinks)’s section, I could not help noticing that communication was at the bottom of the list. If the profession is serious about prioritising communication, maybe we have not reached where we want to be. I think if you put communication first, maybe other things fall into place.
My main point is that there is a distinction between what we invest in and discount rates. So, I very much agree with the paper’s view that what we decide to invest in depends on what our objectives are, but I do not want us, as a profession, to be using this to try and manufacture lower discount rates when we use them. I think there can be a distinction, and I think sometimes our profession, with the benefit of hindsight, has not been as good as it could have been when deciding what discount rates are. If I have an obligation to one of you of X in, say, 10 years’ time, and if I am going to hold a provision that is less than X, I want to be very confident that the provision I hold will grow to X over that 10 years. So, when we refer to various areas, I think, we will always use discount rates, but want to be very confident that our discount rates are going to work.
Third, we talk a lot about “short term” and “long term,” and I am not sure if that is the terminology we want because, as someone said, they mean different things to different people. The long term is always made up of many, many spans of short term, and I think what we want to focus on is the time horizon at which we are paying out the obligations that we are looking at.
Mr Jinks: I will say sorry for putting communication at the bottom of the list and not at the top. I think the point on discount rates is a valid one. We grappled with discount rates for quite a while, trying to work out how to segment it in to the paper. I think the point that we were trying to make is, or what we were trying to comment on was, when you talk about needing X to provision for something in 10 years’ time, is what is the risk associated even if you provision X and how that changes as X changes. Your point on making sure that it links to the obligations chimes with exactly what we want to say.
Mr Spain: Just on the short-term/long-term distinction, I think one of the things I would draw attention to is the idea of path-dependence, which very roughly suggests that where things are depends on where you have come from. Logically, that means they will also depend on where you are going. For a short period, you are going to have less opportunity for good things or bad things to happen. So, long term/short term is a valid distinction, and in fact, I think the actuaries are really the only profession who have ever systematically tried to consider the financial position of long-term entities. No-one else does that. That must be part of our USP except it would not help with general insurance concerns.
Mr N. S. Spencer, F.I.A.: I am probably in a camp of it is neither one nor the other of these approaches but both, to consider the broader approach to risk and financial economics is the way to look forward. I did particularly like the comments on the risk around Defined Contribution Schemes (DCS), and I think, actually, the use there is part of what builds into the market failure of pricing some long-term risk with that focus on central and medium returns rather than the variability.
However, I would like to raise two points. First of all, I would very much push back against the assertion that the US is a representative market in this sense. Looking at the Dimson-Marsh work, the period of negative real returns in the US is 16 years, but if you were to take France, Germany, and Japan, you come up with 54, 55, and 51 years, respectively, at least in the 2018 book. So, I think that gives a very different perspective. I think the challenge, if we think about the risks of modelling failure that happened around subprime where many of the models failed to recognise that negative returns were possible in real estate across the whole of the US, is how do we think about those negative risks, particularly where we get to a point in a timeline when we have not seen the historical observance? So, how do we take the charts that you showed on the S&P and actually really think about the risks of there being negative real returns in 20, 25, and 30 years, if they have not happened in practice? I would assert that risk is not zero.
So, there is one question, panel, both broadening to different countries and then how do you go on to think about the possibility of negative returns rather than guaranteed positive real returns if you wait long enough? The other is, again, picking up on earlier points, around the environmental, social and governance (ESG) risk. Thinking about climate, those future paths are going to be different. What is your thinking here, taking a long-term horizon in regard to market prices and risk where current market prices are quite unlikely to be correct and you have a high degree of uncertainty about the outcome particularly on carbon-dependent companies and businesses?
Ms Hue: I think it is just our comment on the many emerging risks which we cannot cater for fully. It is in one of the paragraphs in the paper but which we did not discuss here.
Mr Jinks: So, on the point about analysing whether the US is representative, Jon did look at that, I think, for UK equities as well. I cannot quite recall what the results were but I think they were broadly similar. I take your point that it does depend on the market that you are thinking about. I think your last point was on the ESG risk, and that often these are calibrated to the market, and what is the risk that the market has got it wrong. I suppose not only is a variety of risk measures important but also a variety of assumptions linked to those risk measures is important. We talk in the paper about “point in time” calibrations versus “through the cycle” calibrations, and there is a question about whether there is enough, whether people who use the ESGs are putting too much on a calibration to a particular date, or whether there is value to be had in looking at longer-term calibrations for ESGs. Obviously, that is open to debate.
Mr Spain: Just to pick up the use of the S&P indices, Mahesh kindly did all of those sums on a chart so we used them, but we did also look to see if the UK numbers were broadly consistent, and they were. Just looking at the 15-year stage we are talking about two different things. We are talking about equities on the one hand, and either over-15-year gilts in the UK or 10-year treasuries, which is pretty well all there is in the US, but the numbers were 7% in the UK and I think it was about 7.2% in the US. For equity risk premia over 15 years, the UK had 3.6 and the US had 5.1, so they are the same sort of order, and we will update those numbers in our written response later on.
Second, the issue of model risk, that is always a problem. All models are suspect, but some are better than others. Sometimes you are going to have to use more than one model to see if you get a similar sort of result. In terms of looking at the fan of outcomes, yes, that can be a bit difficult to explain to some stakeholders, “How do I know where I am?” The answer is, “We do not know where you are going to be,” but the question is, “Where do you want to be? How confident do you want to be that you are going to be 80% to 90% funded? If you do want to be there, that is going to imply a different investment strategy or a different funding strategy, in terms of how much you put in.” At least they get a better answer than, “Put in 33% and we will look at it in three years’ time.” Thirty-three per cent is just one number, it hides everything else. It cannot possibly be a good number to communicate. So, I agree with David Simmons, in fact, the communication of this stuff is all important.
Mr Clark: I heard you say “emerging risks we cannot cater for.” I would like to set up the debate and suggest that every risk is emerging. If the risk is data, it is past and it is an event. So, just in terms of the way we think about the issue, I suggest all risks are emerging, and we should be focused on the best way of helping our principals manage those risks. So, a slightly pedantic point, but I think how we think about the problem is quite important.
Ms Hue: Well, there are many uncertainties so it depends on your perspective. We said there are multiple perspectives of risk, and for all the people who have commented this evening, they are adding nuances and extensions to what we have, which does enrich the discussion. During our research, we found a problem we constantly faced was scope creep. There was so much further detail that we could go into, and we could go in greater depth, but then the paper would just extend to hundreds of pages. So, there are things in the paper which do not come across fully just because in order to extend them properly, it would require a separate paper all of its own.
Mr P. D. Needleman, F.I.A.: I think it is very easy for some of the younger members of the profession to be wholly immersed in market-consistent techniques and perhaps forget there was a time, 20 years ago or more, when there were many other techniques used to value liabilities or to make projections, and stochastic projections were generally of a real-world nature.
I wanted to make a few comments from the perspective of an insurance company. I am the with-profits actuary of an insurance company selling large volumes of with-profits business and in the fortunate position where the solvency position is not, at least at the current time, a significant constraint.
Recently, we have spent a lot of time thinking about investment risk from the policyholder perspective. Interestingly, we still use 1-year volatility as a measure of that risk, for all the reasons that are in the paper, but we are starting to think about risk, from the policyholder’s perspective, in different ways. In particular, that means looking at their average investment time horizon, trying to take account of the benefits smoothing, which further reduces the risk over the long term, and other factors that would be relevant. Perhaps one of the most significant is diversification, because that is something which has been communicated to policyholders. So, there are a number of factors to consider, but particularly the need to consider time horizons is really important. For life products, that could mean anything from 10 to 15 years, perhaps longer for some, but for most of the contracts, you can take early surrender values, so we cannot ignore volatility of payments in the short term completely.
The other major area I just wanted briefly to comment on is the use of market consistent or other techniques to value guarantees. While the market-consistent approaches are now accepted practice for valuing guarantees, and they work well for fairly basic guarantees, nevertheless, life contracts have some long-term embedded options and other risks, which are path dependent, where market-consistent techniques cannot be easily applied. In a recent pricing exercise, we found it very difficult to apply those techniques and ended up using real-world stochastic projections, using investment returns with risk premia, but adding an allowance for a risk margin in exactly the way the paper indicates, taking the 65th or 70th percentile.
So, I think where we end up is a situation where it is horses for courses. Yes, market-consistent approaches are absolutely right in many circumstances, but there are plenty of situations where they are not appropriate. I think the paper is a good reminder of that.
Ms Siew: Thank you. I guess it is quite interesting to hear your comments. I think one of the things that we did as part of the research party was we had a look back at the actuarial literature reviews. It was helpful to be reminded that not that long ago, the immunisation concept was in the minds of all actuaries and you would not think about anything else before you went onto market-consistent techniques.
I think your comments about thinking about the short term and the long term and how that interacts with market-consistent techniques are important because I think one of the big drivers, in the UK insurance industry anyway, is the emergence of market-consistent techniques because of undervaluing guarantees in with-profit funds, and the rise of peak 1 and peak 2 reporting. Solvency II is trying to address it in one sense, having market-consistent techniques. I am not saying that market-consistent techniques are wholly bad, but I think it does help to think about whether we should be trying to model things on a longer-term basis. That would probably require more complex models where you would want to model the interaction between making sure that you have sufficient returns over that period as well as modelling the dynamic relationship between, say, poor investment returns and high surrender rates, for example. It is then calibrating that, which is really tough. That should not be a reason for us not to investigate it, I think, and not just loyally thinking about the 1-year VaR approach.
A market-consistent approach, in my view, is a bit of a short cut because you are not then modelling all of the risk. You are saying that, “Okay, if I have not been able to model all the risk properly then I will not take credit for the return on that.” It might be that if we do model it over a long term, we might find that the risk/reward balance will be different.
My last point about your market-consistent techniques is where you have had to use the real world. One other thing that is a recent development in the industry is that for equity release assets, where quite a lot of insurers have typically valued them using real-world projections, being asked to go down the route of valuing them on a risk-neutral basis using a deferment rate. Now, that is obviously a subject of another working party, but it does make you think, “What is a market-consistent price for property, really?” and whether we can actually get market-consistent prices for all the types of options that we are trying to model.
Mr C. Keating: Thank you for the paper. I have already, as you know, submitted a written comment on this paper. There are a couple of points that I want to make and then a question to ask. The first is that I find some of the econometrics in this paper deeply troubling such as the conclusions you draw from overlapping periods. You actually have three independent 30-year observations not 100 observations over 30 years. That carries significant consequences for the findings that you have.
The second thing is, and this a problem I have seen in a large number of actuarial models for pension funds, in particular the PPF 2030 model. The PPF 2030 model is fine in as much as it tells you about what you might expect to see in 2030. Do not make the mistake that seems to be widely made of assuming that that tells you about the path by which you get there. To establish that path, you would need to have the assumptions and conditions for 1, 2, 3 years, all the way through to the end, and that is the only way you will get that accurate.
So, to the question. The question is really very simple. We know that risk means that more things may happen than will happen, so should we not, if we are talking about risk management, be focusing on the likelihood of particular events occurring, and should we not also be examining and perhaps prioritising things by the possible consequence of those specific events?
Mr Spain: To pick up the last thing, we should pick up on the probability or probabilities of more things happening than will happen as a definition of risk. Yes, it would be a great idea to do that, but when you are talking about things which are almost unknown, it is a bit hard to decide, “Well, it is going to be 70% that Red Rum will win the Grand National again.” I will put the answer at zero probably but if you give me 70%, I will take it. You have got a problem and, yes, you have set out a problem which cannot be answered, and if people want to put, no, you cannot put a probability on future events which are unknown for which you have got no prior.
Mr Keating: All future events are unknown.
Mr Spain: No, all future events will include some events which you can guess at and others at which you cannot guess.
Mr Clark: I think Con (Keating) has made a very good point. Let me see if I can frame it into a question for each member of the panel and possibly the chairman. I am the trustee of a £20 billion pension scheme. I am concerned about climate risk because my plan sponsor happens to be a fossil fuel major. I think their covenant is weaker than most people think. I have just appointed you as my advisor to the trustees, not to do any particular work as yet but to help me to direct my CEO to direct the scheme actuary to do his work given my belief. I think to Con (Keating)’s point, this is an uncertainty but we are in the risk measurement game. So, how might you begin to start your conversation with me when I have just appointed you to advise me around what I believe is a riskier covenant than everybody else seems to think?
Ms Hue: What I am hearing is a distinction between risk and uncertainty, and in a way, it reminds me of the quantifiable unknowns and the unquantifiable unknowns. I do not know what other people think of that.
Mr Jinks: Going back to the probability of success and failure type approaches, I do not think there is anything that prevents using that sort of framework in practice, it is just the distribution would probably be a bit more bimodal depending on the covenant risk. If the sponsor falls over then the chances are you will fail. If it is fine then it will be a bit more successful. Maybe that is then achieving its purpose of demonstrating that risk in a way that it is not demonstrating it currently. Yes, I think you are right that we are talking about known unknowns, unknown unknowns, and whatever else.
Mr Spain: I was intrigued by the suggestion that the scheme actuary could be instructed to do something, and I think that, perhaps, is part of the USP problem. Exactly what is it that this scheme actuary or any other actuary contributes as being a professional to the wider public? If they are just taking instructions to do very complicated algebraic calculations, which almost anybody else could do, if they were just given the formulae, they could write the computer programme and it would be dead simple, that does not say a lot. This scheme actuary in pension and DB terms is supposed to say to the trustees and have it agreed with the sponsor that, “This is where I think you might want to be. Now you, as trustees, have to define the parameters that you want me to use.” I suppose that is a sort of instruction, but that all the more reinforces my point that really all we are glorified clerks. In fact, if you go back 2,000 years, the word “actuary” or “actuarius” actually meant “clerk.” Two thousand years and we are back to where we were, fantastic.
Mr Clark: What I was trying to do was to differentiate between the arithmetical stuff and you, who I have just appointed, and your judgement, as to help me to think through this risk/uncertainty which I have decided I have a view on, and how that would work through my governance structure, through my CEO, to the person you described as the glorified clerk. So, I am looking for your judgement on my assessment as a trustee of a pension scheme, and I guess it could be an asset owner in an insurance company with a fairly weak regulatory constraint. So, I am really testing the thought as to how we begin to think about evaluation and assessment of these risks which are all in the future, really building on Con (Keating)’s point.
Mr Spain: I think it is that V word, the valuation, which is the real problem, because putting everything back to scalars just does not help. In terms of trying to have a responsible, informed conversation between the trustees and the sponsor and the actuary, you can talk about particular risks. You have to start with the sponsor’s game plan. You have to look at the covenant. How long is this sponsor going to be around? How long do you really have to consider? So, maybe it is 15 or 20 years. You can talk about the long term.
If you take the carbon debate as an example, one way of approaching that would be, “We are not going to have any oil companies, and we are going to limit our exposure to the finance behind the oil companies.” That is going to limit your equity options in the UK market quite a lot. So, another thing you could do is say, “Okay, we will invest in Shell or BP,” things like that, “if we think they are good.” I could not possibly comment on that, “but when we start looking at the returns, we are going to build in variance that we are going to lose 20% of the value of the returns on that particular part of the market.” That might change your mind as corporate trustee as to whether or not you actually want to do that. A sponsor might have a particular view on that as well because that will imply a higher funding requirement from the sponsor. The shareholders might not like that, if there are shareholders.
So, you have a balancing item, and it is always going to be a balancing position, and there will be no right answer, which is one of the reasons why you have to keep on looking at it every so often. It does not go off the agenda, it stays on the agenda every meeting, “Are we still feeling okay?” but that does not mean doing a fresh valuation every Tuesday afternoon, because there is a system which can do that. It is a question of balancing what you are building in. I was thinking of the known unknowns in that we know there are these things which can go right or wrong but we do not know by how much. Andy (Jinks) has helpfully mentioned the unknown unknowns. Your guess is as good as anybody else’s, and so, frankly, is any non-actuary’s.
The Chairman: We were getting into a very lively debate. I have a feeling that could have started going on to a very interesting place. We talked about communication and framing. Andrew (Slater) referred to this as this is social science and not physics. We need to think very carefully about the time horizon and asset owners. All risks are emerging – thank you, Nick (Spencer). Solvency II constraints and the unknowns, quantifiable knowns and unknowns, I think we could talk all night about that. It has been a very interesting discussion on a good paper. Thanks.


 Open access