


Major depressive disorder (MDD) is a mental health condition characterized by decreased mood and anhedonia that severely impacts quality of life. It affects up to 20% of the population across the lifetime and is a leading contributor to disability worldwide (Kessler & Bromet, Reference Kessler and Bromet2013; Marx et al., Reference Marx, Penninx, Solmi, Furukawa, Firth, Carvalho and Berk2023; World Health Organization [WHO], 2017). MDD is referred to as a complex trait in that it is affected by numerous environmental and genetic factors. MDD runs in families and twin and family studies estimate that approximately 35% of the variation in MDD status is due to genetic factors (Flint & Kendler, Reference Flint and Kendler2014).
Similar to the efforts for many other psychiatric disorders, the significant heritability of MDD has stimulated large-scale genomewide association studies (GWAS) and genomewide association meta-analyses (GWAMA) aimed at the identification of genomic variants associated with disease status (Uffelmann et al., Reference Uffelmann, Huang, Munung, de Vries, Okada, Martin, Martin, Lappalainen and Posthuma2021). One of the first GWA projects was initiated in the Netherlands (Sullivan et al., Reference Sullivan, de Geus, Willemsen, James, Smit, Zandbelt, Arolt, Baune, Blackwood, Cichon, Coventry, Domschke, Farmer, Fava, Gordon, He, Heath, Heutink, Holsboer and Penninx2009) in 1738 MDD cases and 1802 controls. The sample size in this study was small by current standards, but the gene detected in this study (PCLO) was later confirmed in large collaborative projects (Howard et al., Reference Howard, Adams, Clarke, Hafferty, Gibson, Shirali, Coleman, Hagenaars, Ward, Wigmore, Alloza, Shen, Barbu, Xu, Whalley, Marioni, Porteous, Davies, Deary and McIntosh2019). We now increasingly realize that identifying genetic risk factors for any complex trait within psychiatry, psychology or medicine requires very large sample sizes in order to detect the small effects of hundreds of variants scattered across the genome composing their polygenic architecture.
Due to the higher prevalence and lower heritability of MDD, three to five times as many cases are required to detect the same number of genomewide significant genetic variants as compared to less prevalent psychiatric disorders with a higher heritability, such as schizophrenia (Levinson et al., Reference Levinson, Mostafavi, Milaneschi, Rivera, Ripke, Wray and Sullivan2014; Wray et al., Reference Wray, Ripke, Mattheisen, Trzaskowski, Byrne, Abdellaoui, Adams, Agerbo, Air, Andlauer, Bacanu, Bækvad-Hansen, Beekman, Bigdeli, Binder, Blackwood, Bryois, Buttenschøn and Bybjerg-Grauholm2018). Recent GWA efforts for MDD have focused on boosting sample size by combining datasets with very broad phenotyping sources, including psychiatrically ascertained clinical diagnosis, self-reported clinical diagnosis or self-reported symptom/questionnaire data. This approach has indeed increased the number of significant hits in MDD and depression GWAS (Howard et al., Reference Howard, Adams, Clarke, Hafferty, Gibson, Shirali, Coleman, Hagenaars, Ward, Wigmore, Alloza, Shen, Barbu, Xu, Whalley, Marioni, Porteous, Davies, Deary and McIntosh2019; Levey et al., Reference Levey, Stein, Wendt, Pathak, Zhou, Aslan, Quaden, Harrington, Nuñez, Overstreet, Radhakrishnan, Sanacora, McIntosh, Shi, Shringarpure, Concato, Polimanti and Gelernter2021). However, there is an important and ongoing debate that considers the dilemma of broad phenotyping to maximize sample size and thus statistical power in genetic association studies, versus in-depth phenotyping, often resulting in smaller samples. Although the former approach has been successful in increasing the number of significant genetic hits, it has also been criticized for a possible lack of specificity; genetic variants associated with broad phenotypes may be nonspecific to MDD and instead apply to a wider spectrum of psychopathology (Cai et al., Reference Cai, Revez, Adams, Andlauer, Breen, Byrne, Clarke, Forstner, Grabe, Hamilton, Levinson, Lewis, Lewis, Martin, Milaneschi, Mors, Müller-Myhsok, Penninx, Perlis and Flint2020). Flint (Reference Flint2023) suggested that employing minimal phenotyping strategies may render a substantial portion of the genetic foundation of MDD inaccessible, due to their limited specificity.
To help resolve the dilemma, larger datasets that include a uniform assessment of MDD and adhere to clinical criteria are warranted, such as those defined by the Diagnostic and Statistical Manual of Mental Disorders, Fifth Edition (DSM-5; American Psychiatric Association, 2013). This need incited the establishment of the BIObanks Netherlands Internet Collaboration (BIONIC). BIONIC was established within the Biobanking and BioMolecular resources Research Infrastructure (BBMRI-NL). The BIONIC collaboration combines genotype and depression data from Dutch cohorts initiated by different academic groups across the Netherlands (see Figure 1) to study the causes of individual differences in MDD from a genetic perspective. With the inclusion of large population-based cohorts and some clinical studies, the participants in the BIONIC study form a good representation of the Dutch population. BIONIC sought to adhere to the clinical definition of MDD and initiated development of a new depression instrument to efficiently and uniformly assess MDD status in ongoing studies of which the majority has already gathered genomewide genotype information. This instrument, the LIfetime Depression Assessment Survey (LIDAS), was developed, validated and further tested in a series of studies with concurrent measures of depression and wellbeing (Barbu et al., Reference Barbu, Huider, Campbell, Amador, Adams, Lynall, Howard, Walker, Morris, Van Dongen, Porteous, Evans, Bullmore, Willemsen, Boomsma, Whalley and McIntosh2021; Bot et al., Reference Bot, Middeldorp, de Geus, Lau, Sinke, van Nieuwenhuizen, Smit, Boomsma and Penninx2017; Fedko et al., Reference Fedko, Hottenga, Helmer, Mbarek, Huider, Amin, Beulens, Bremmer, Elders, Galesloot, Kiemeney, Loo, Picavet, Rutters, Spek, Wiel, Duijn, Geus, Feskens and Bot2020; Huider et al., Reference Huider, Milaneschi, van der Zee, de Geus, Helmer, Penninx and Boomsma2021; van de Weijer et al., Reference van de Weijer, Pelt, de Vries, Huider, van der Zee, Helmer, Ligthart, Willemsen, Boomsma, de Geus and Bartels2022; Vreijling et al., Reference Vreijling, van Haeringen, Milaneschi, Huider, Bot, Amin, Beulens, Bremmer, Elders, Galesloot, Kiemeney, van Loo, Picavet, Rutters, van der Spek, van de Wiel, van Duijn, Feskens, Hartman and Jansen2023).

Figure 1. Map of the Netherlands and primary location of BIONIC cohorts.
Note: MooDFOOD, Multi-country cOllaborative project on the rOle of Diet, Food-related behavior, and Obesity in the prevention of Depression; NESDA, Netherlands Study of Depression and Anxiety; MOTAR, MOod Treatment with Antidepressants or Running; NESDO, Netherlands Study of Depression in Older persons; NESDAsib, Netherlands Study of Depression and Anxiety sibling cohort; TRAILS, Tracking Adolescents’ Individual Lives Survey; NQplus, Nutrition Questionnaires plus.
For genetic projects, we have created an infrastructure to combine the MDD phenotype data obtained with LIDAS and other established psychiatric interviews and genotype data from participants from 16 Dutch cohorts into a dataset spanning over 130,000 individuals. Our aim was to reduce heterogeneity in phenotypic assessment of MDD and to carry out GWAS in a single, relatively homogeneous population. This article aims to serve as a description of the BIONIC resources; we describe the project establishment and infrastructure, the phenotype harmonization process across cohorts and genotype data pipelines, the features of the BIONIC database, and offer some reflections on the process and next steps.
Materials and Methods
Table 1 provides an outline of the multiple steps in our collaborative project. In step 1 we developed the project idea within the BBMRI-NL framework (https://www.bbmri.nl/). BBMRI-NL coordinates collaborations between Dutch cohort studies and biobanks to maximize the use of phenotype information, biosamples, imaging, omics and other data for genetic and health research. BIONIC is a collaborative effort with the two-part goal of providing a proof-of-concept for harmonized measurement of phenotypes in ongoing biobank studies, a key aspect of BIONIC’s philosophy being the uniform online assessment of major depression status in studies and biobanks with existing genotype data. To this end we designed a structured and efficient online instrument to assess DSM-5-based diagnosis of depression: the LIfetime Depression Assessment Survey (LIDAS; Bot et al., Reference Bot, Middeldorp, de Geus, Lau, Sinke, van Nieuwenhuizen, Smit, Boomsma and Penninx2017). The LIDAS was validated in step 2 against the Composite International Diagnostic Interview (CIDI; Kessler, Wittchen et al., Reference Kessler, Wittchen, Abelson, Mcgonagle, Schwarz, Kendler, Knäuper and Zhao1998), considered the gold standard. The development of the LIDAS allowed for the efficient expansion of sample size for genetically informed approaches.
Table 1. Timeline of stages in the BIONIC project

Note: BBMRI-NL, Biobanking and BioMolecular resources Research Infrastructure; LIDAS, LIfetime Depression Assessment Survey; MDD, major depressive disorder; SNP-h², single nucleotide polymorphism heritability; BIONIC, BIObanks Netherlands Internet Collaboration; QC, quality control.
In step 3, cohorts and biobanks across the Netherlands were contacted and asked for their interest in participating in a uniform phenotyping effort for MDD, offering to facilitate the online data collection as well as financial reimbursement to the cohort. In step 4, the LIDAS data were analyzed and phenotype characteristics described. The prevalence based on the LIDAS data analyses was 6.7% for current depression and 18.1% for lifetime MDD. These percentages are in line with population estimates in the Netherlands (Bijl et al., Reference Bijl, Ravelli and van Zessen1998; Fedko et al., Reference Fedko, Hottenga, Helmer, Mbarek, Huider, Amin, Beulens, Bremmer, Elders, Galesloot, Kiemeney, Loo, Picavet, Rutters, Spek, Wiel, Duijn, Geus, Feskens and Bot2020; see also: https://www.trimbos.nl/kennis/cijfers/depressie/). Heritability based on a combined analysis of twin and extended family data was estimated at 34% for lifetime MDD (Huider et al., Reference Huider, Milaneschi, van der Zee, de Geus, Helmer, Penninx and Boomsma2021).
To carry out genetic association studies, a challenging step (5) consisted of enabling cohorts and biobanks to share all phenotype and genotype data at the HPC Gearshift facility of the Genomics Coordination Center (GCC; https://docs.gcc.rug.nl/gearshift/cluster/) in Groningen, the Netherlands. All cohorts needed to sign data transfer agreements for this purpose. A standard operating procedure was developed to guide the initial preparation and upload of the phenotype data and genotype data to the HPC cluster.
In step 6, the phenotype harmonization involved defining case-control status based on LIDAS data or DSM-5-based interviews. A pipeline was developed to process the different genotype arrays and for imputation against the Human Reference Consortium panel (v1.1; McCarthy et al., Reference McCarthy, Das, Kretzschmar, Delaneau, Wood, Teumer, Kang, Fuchsberger, Danecek, Sharp, Luo, Sidore, Kwong, Timpson, Koskinen, Vrieze, Scott, Zhang and Mahajan2016).
In a future step 7 we aim to carry out both a GWA analysis of the data in SAIGE (Scalable and Accurate Implementation of GEneralized mixed model; Zhou et al., Reference Zhou, Nielsen, Fritsche, Dey, Gabrielsen, Wolford, LeFaive, VandeHaar, Gagliano, Gifford, Bastarache, Wei, Denny, Lin, Hveem, Kang, Abecasis, Willer and Lee2018), which is suited for the analysis of binary traits in related individuals.
Phenotype Data
Harmonized assessment of major depression in the participating cohorts was primarily achieved through the LIDAS instrument. A detailed description of the development and validation of the LIDAS instrument can be found in Bot et al. (Reference Bot, Middeldorp, de Geus, Lau, Sinke, van Nieuwenhuizen, Smit, Boomsma and Penninx2017). In short, LIDAS is an online self-report survey based on the CIDI short form (CIDI-SF; Kessler, Andrews et al., Reference Kessler, Andrews, Mroczek, Ustun and Wittchen1998), which assesses the presence of major depression symptoms as defined by the DSM-5. The LIDAS content can be divided into three sections: (1) demographics and lifestyle factors, (2) depression symptoms and episode characteristics, and (3) diagnostic and treatment history. Sections 1 and 3 are completed by all individuals. The first items of section 2 pertain to the cardinal symptoms of major depression, decreased mood and anhedonia; individuals with one or more cardinal symptoms are asked about accessory symptoms and episode characteristics, while individuals without cardinal symptoms are immediately redirected to the next section for efficient control identification. Cohorts were offered the option to add extra items to the online instrument, such as questions about wellbeing or zygosity. The LIDAS showed good sensitivity (.85) and specificity (.80) when compared to the CIDI (Bot et al., Reference Bot, Middeldorp, de Geus, Lau, Sinke, van Nieuwenhuizen, Smit, Boomsma and Penninx2017). In BIONIC, additional depression information was obtained from the CIDI and Mini-International Neuropsychiatric interview (MINI; Sheehan et al., Reference Sheehan, Lecrubier, Sheehan, Amorim, Janavs, Weiller, Hergueta, Baker and Dunbar2018) diagnostic interviews provided that DSM-5 criteria could be applied in the identification of cases, as discussed below.
MDD Definition
We settled on a uniform definition of lifetime MDD cases in accordance with DSM-5 criteria, where a case is defined as having at least five out of nine clinical depression symptoms, of which at least one is a cardinal symptom (by definition), with dysfunctionality for a period of at least two weeks. Controls were defined as having fewer than five depression symptoms, having no cardinal symptoms (by definition), or experiencing functional impairment for less than two weeks as a result of symptoms. Extra controls, who did not complete the LIDAS, were identified based on conservative cut-offs for sum scores on depression symptom questionnaires, such as the Beck’s Depression Inventory (BDI; Beck et al., Reference Beck, Ward, Mendelson, Mock and Erbaugh1961). Controls were screened for the presence of psychopathology when such information was available. This included screening for a diagnostic or treatment history of depression, anxiety disorder, bipolar disorder, any eating disorder, schizophrenia, obsessive-compulsive disorder, post-traumatic stress disorder, phobia, attention deficit hyperactivity disorder (ADHD) or attention deficit disorder (ADD), any personality disorder, alcohol or drug addiction, or use of antidepressant medication. The presence of any one of these was sufficient for exclusion as a control.
Genotype Data
Cohorts had collected genotype data through a variety of arrays, including the Illumina Infinium General Screening Array, the Illumina Infinium Core Exome chip, the Illumina Infinium CytoSNP chip, the Illumina Infinium OmniExpress-24 Beadchip, the Affymetrix SNP array 6.0, the Affymetrix AXIOM-NL array, and the FinnGen ThermoFisher Axiom custom array. Combining multiple genotype datasets means risking stratification, which is a well-known source of false positive and false negative results in GWAS (Marchini et al., Reference Marchini, Cardon, Phillips and Donnelly2004). The possible sources of stratification can be controlled for at the analysis level but are best addressed during data preparation. To this end, cohorts performed only minimal preprocessing before genotype data were shared and subjected to the same quality control (QC) pipeline. The genotype pipeline is summarized in Figure 2.
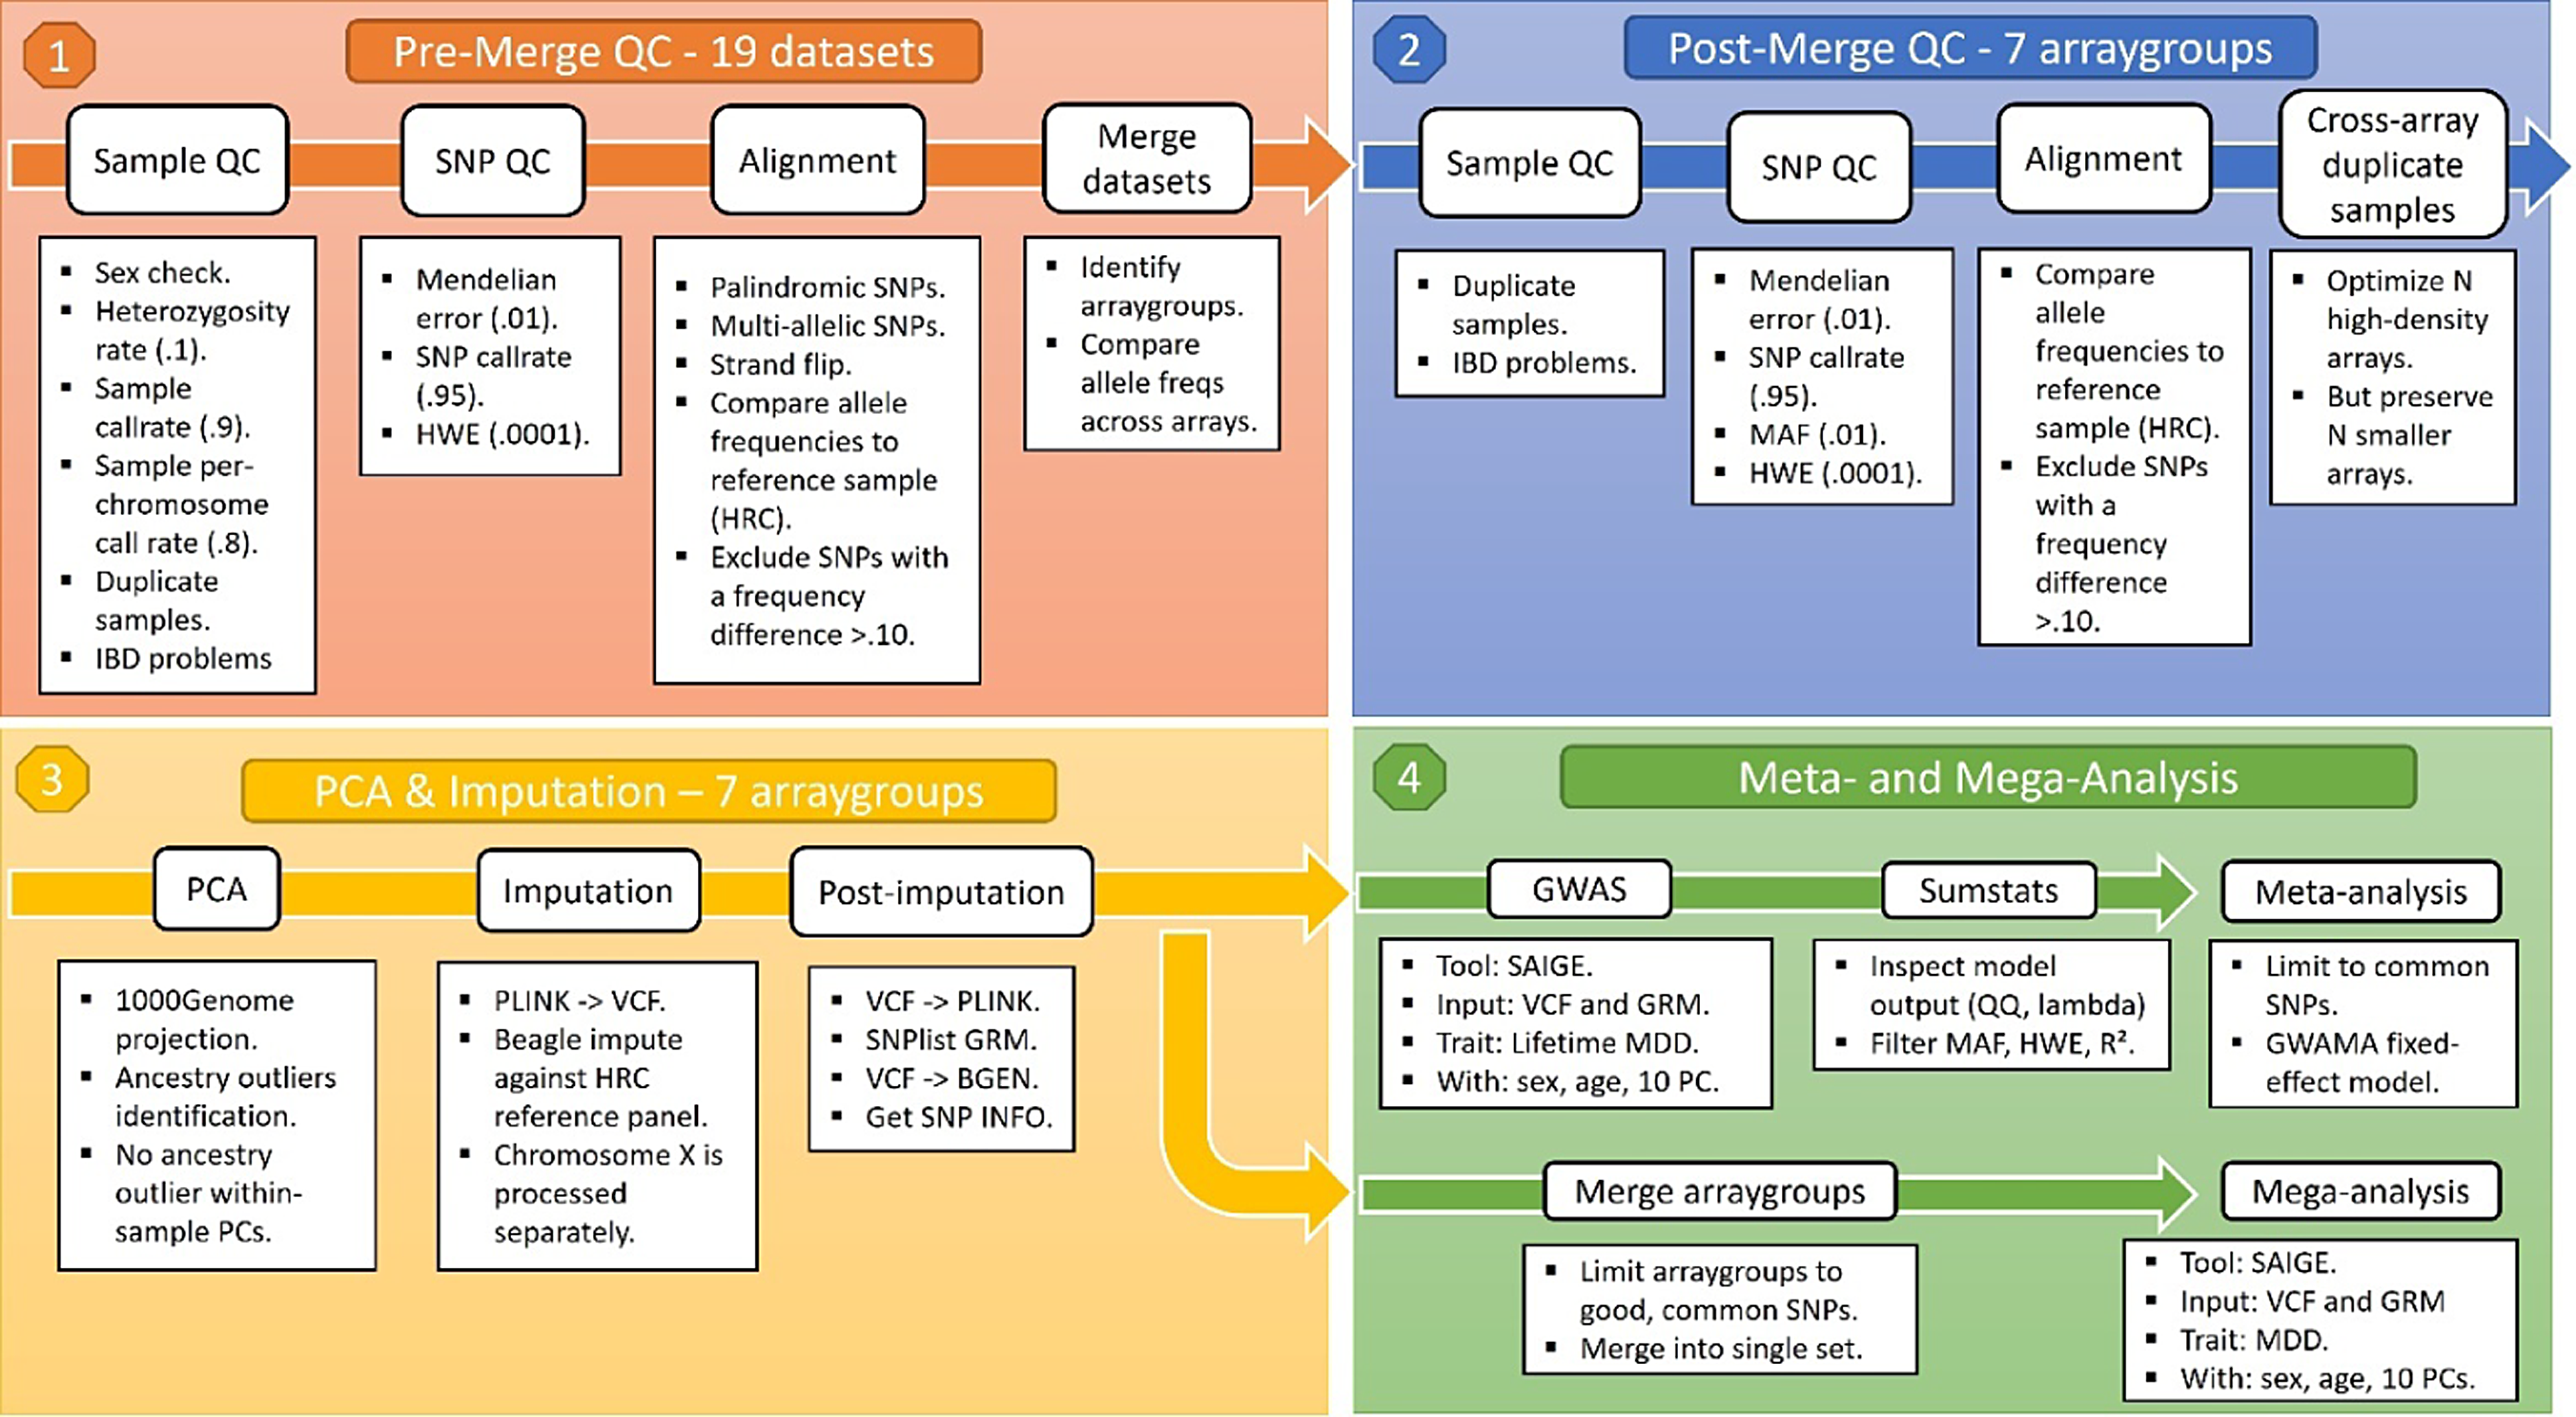
Figure 2. Overview of BIONIC genotype pipeline.
Note: QC, quality control; SNP, single nucleotide polymorphism; HWE, Hardy Weinberg equilibrium; PC, principal component; GRM, genetic relationship matrix; HRC, human reference consortium; MAF, minor allele frequency; GWAS, genomewide association study; GWAMA, genomewide association meta-analysis; MDD, major depressive disorder.
Sample and single nucleotide polymorphism (SNP) QC were conducted using PLINK v1.90 and KING v2.24 (Manichaikul et al., Reference Manichaikul, Mychaleckyj, Rich, Daly, Sale and Chen2010; Purcell et al., Reference Purcell, Neale, Todd-Brown, Thomas, Ferreira, Bender, Maller, Sklar, de Bakker, Daly and Sham2007). In short, samples were excluded in case of discrepancy between reported and biological sex (PLINK FchrX-coefficient < .8 for males and FchrX > .2 for females), excess heterozygosity (Fautosomes > .10 or < -.10), insufficient sample call rate (<.90) and call rate by chromosome (<.80), or incorrect identity-by-descent sharing between relatives. SNPs were excluded based on Hardy Weinberg Equilibrium (p < 1 x 10⁻⁴) and SNP call rate (<.95), as well as Mendelian error rates above 1%. Palindromic SNPs were excluded with minor allele frequency > 0.30. SNPs were aligned to the Haplotype Reference Consortium (HRC) panel (v1.1; McCarthy et al., Reference McCarthy, Das, Kretzschmar, Delaneau, Wood, Teumer, Kang, Fuchsberger, Danecek, Sharp, Luo, Sidore, Kwong, Timpson, Koskinen, Vrieze, Scott, Zhang and Mahajan2016) and SNPs with an allele frequency difference > 0.10 with the reference data were also excluded.
An important caveat of a multi-cohort GWA approach is that some genotype datasets may have small sample size or contain an overrepresentation of either cases or controls, thus risking chance findings when the data from these cohorts are analyzed independently. As a solution, genotype data derived from the same genotype array were combined into seven array groups, so that each group had sufficient size for analysis and a similar case-control distribution. The new genotype array groups underwent the same SNP QC again, including the thresholds above and a minor allele frequency (MAF) threshold of 0.01. Some individuals were genotyped multiple times, sometimes across different arrays. These duplicate observations were resolved by favoring the more modern arrays. Genotype data were then phased and imputed against the HRC reference panel using the BEAGLE software (v5.1; Browning et al., Reference Browning, Zhou and Browning2018).
The Netherlands has a population of nearly 18 million people, living within a total area of 41,850 km2 (16,160 sq miles) and has seen historical immigration over the centuries. In the 20th century, immigration was mainly from Indonesia; in the 1960s, from Turkey, Morocco, Italy and Spain; and in the 1970s from Suriname and the Netherlands Antilles. The Netherlands also retains regional differences; for example, a north-south gradient, which may lead to stratification and hence to false positives in GWAS (Abdellaoui et al., Reference Abdellaoui, Hottenga, Knijff, Nivard, Xiao, Scheet, Brooks, Ehli, Hu, Davies, Hudziak, Sullivan, van Beijsterveldt, Willemsen, de Geus, Penninx and Boomsma2013; Francioli et al., Reference Francioli, Menelaou, Pulit, van Dijk, Palamara, Elbers, Neerincx, Ye, Guryev, Kloosterman, Deelen, Abdellaoui, van Leeuwen, van Oven, Vermaat, Li, Laros, Karssen and Kanterakis2014). We conducted a standard 1000 Genomes projection genetic principal component analyses (PCA) in the array groups to identify and exclude ancestry outliers (>4 SDs from mean of the first standardized 6 PCs). Subsequent PC analyses will be conducted in the HRC imputed data to accommodate the Dutch population substructure, as well as post-imputation platform differences and other sources of genetic stratification.
Results
Sixteen cohorts were combined in the BIONIC project: The Doetinchem Cohort Study (DCS; Picavet et al., Reference Picavet, Blokstra, Spijkerman and Verschuren2017), the Hoorn Study and the New Hoorn Study (Rutters et al., Reference Rutters, Nijpels, Elders, Stehouwer, van der Heijden, Groeneveld, ‘T Hart, Dekker and Beulens2018), the Hoorn Diabetes Care System cohort (Heijden et al., Reference Heijden, Rauh, Dekker, Beulens, Elders, Hart, Rutters, Leeuwen and Nijpels2017), Longitudinal Aging Study Amsterdam (LASA; Hoogendijk et al., Reference Hoogendijk, Deeg, Breij, Klokgieters, Kok, Stringa, Timmermans, Schoor, Zutphen, Horst, Poppelaars, Malhoe and Huisman2020), Lifelines (Sijtsma et al., Reference Sijtsma, Rienks, van der Harst, Navis, Rosmalen and Dotinga2022), the Multi-country cOllaborative project on the rOle of Diet, Food-related behavior, and Obesity in the prevention of Depression study (MooDFOOD; Cabout et al., Reference Cabout, Brouwer and Visser2017), the MOod Treatment with Antidepressants or Running study (Lever-van Milligen et al., Reference Lever-van Milligen, Verhoeven, Schmaal, van Velzen, Révész, Black, Han, Horsfall, Batelaan, van Balkom, van Schaik, van Oppen and Penninx2019), the Netherlands Study of Depression and Anxiety (NESDA) and its sibling cohort (NESDAsib; Penninx et al., Reference Penninx, Eikelenboom, Giltay, van Hemert, Riese, Schoevers and Beekman2021), the Netherlands Study of Depression in Older Persons (NESDO; Comijs et al., Reference Comijs, van Marwijk, van der Mast, Naarding, Oude Voshaar, Beekman, Boshuisen, Dekker, Kok, de Waal, Penninx, Stek and Smit2011), the Nutritional Questionnaires plus study (NQplus; Brouwer-Brolsma et al., Reference Brouwer-Brolsma, van Lee, Streppel, Sluik, van de Wiel, de Vries, Geelen and Feskens2018), the Nijmegen Biomedische Studie (NBS; Galesloot et al., Reference Galesloot, Vermeulen, Swinkels, de Vegt, Franke, den Heijer, de Graaf, Verbeek and Kiemeney2017), the Netherlands Twin Register (NTR; Ligthart et al., Reference Ligthart, Beijsterveldt, Kevenaar, Zeeuw, Bergen, Bruins, Pool, Helmer, Dongen, Hottenga, Ent, Dolan, Davies, Ehli, Bartels, Willemsen, Geus and Boomsma2019), and the Tracking Adolescents’ Individual Lives Survey (TRAILS) and its clinical cohort (TRAILS-CC; Oldehinkel et al., Reference Oldehinkel, Rosmalen, Buitelaar, Hoek, Ormel, Raven, Reijneveld, Veenstra, Verhulst, Vollebergh and Hartman2015). The Hoorn Diabetes Care System cohort, The Hoorn Study, and The New Hoorn Study were combined into one Hoorn Studies cohort, and the TRAILS and TRAILS-CC cohorts were combined into one TRAILS study cohort. A brief overview of each cohort is presented in the supplementary material. Together, these cohorts have recruited participants across the entire country of the Netherlands.
Depression, age and sex information was available for a total of N = 132,850, and lifetime MDD status could be determined for N = 123,950, with 29,650 cases and 94,300 screened controls; 4361 potential control participants were excluded as part of the screening process because they met diagnostic criteria for anxiety and/or bipolar disorder, had a history of psychopathology or had taken antidepressants. Eleven cohorts administered the LIDAS (in one, or in multiple stages; N = 70,982) and five cohorts relied on diagnostic interviews. An overview of the instruments can be found in the supplementary material. There were 79,213 women and 53,637 men, with MDD case prevalences of 28.2% and 17.6% respectively. Mean age was 48.8 years (16.1 SD). The sex-averaged prevalence of MDD in the full sample (23.9%) is slightly higher than that of the general population, which is primarily explained by the inclusion of the clinical depression cohorts, and the screening of controls.
Genotype information was available for N = 66,648 individuals with European ancestry, and so the BIONIC MDD GWAS sample has 16,847 cases and 49,801 screened controls. Table 2 describes the participating BIONIC cohorts in the MDD GWAS set, with number of participants by cohort, depression instruments used, cohort type, percentage female, mean age and percentage MDD cases. The relatively high percentage of cases in Lifelines can be explained by the fact that data were in part derived from the MINI questionnaire, which measured current depression and so only allowed for lifetime MDD cases to be identified. The higher prevalence in TRAILS is explained by the combination of the population-based and clinical TRAILS cohorts. The prevalence of MDD prevalences in other cohorts seems in line with expectations, with population cohorts ranging between 11.5% and 27.2% and clinical cohorts having a higher prevalence by design.
Table 2. Overview of BIONIC cohorts in the GWAS set
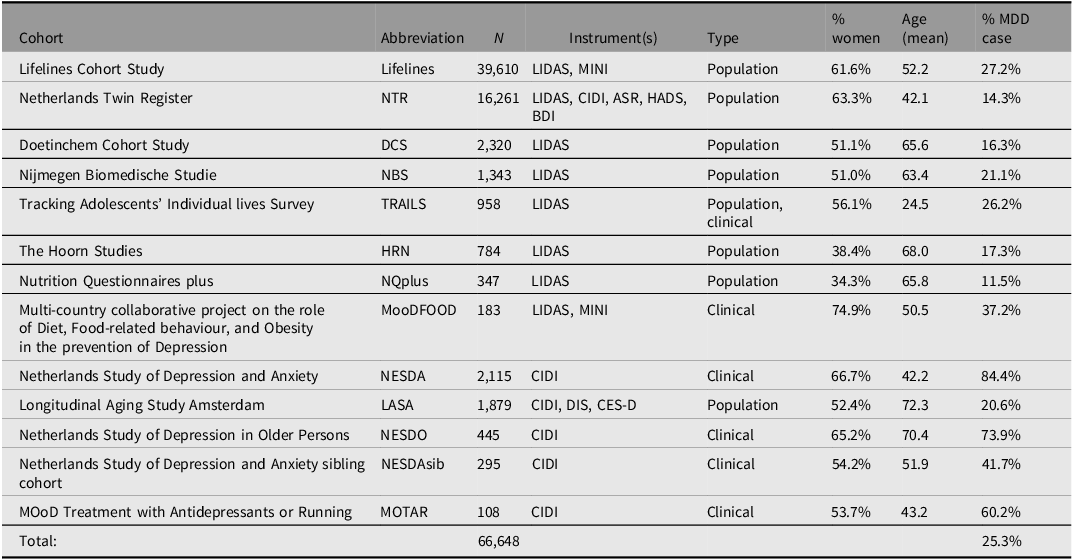
Note: MDD, major depressive disorder; LIDAS, Lifetime Depression Assessment Survey; CIDI, Composite International Depression Inventory; MINI, Mini-international neuropsychiatric interview; DIS, Diagnostic Interview Schedule; CES-D, Center for Epidemiological Studies Depression scale; ASR, Adult Self Report - Achenbach System of Empirically Based Assessment; BDI, Beck’s Depression Inventory; HADS, Hospital Anxiety and Depression Scale.
Table 3 contains an overview of the available information in the BIONIC GWAS set as well as its full phenotype dataset. Besides MDD status, available variables include individual symptoms, episode characteristics, psychiatric history, and demographic and lifestyle factors. There is a noticeable shift in the availability of symptoms 1 and 2 versus symptom 3 and beyond. This difference reflects the fact that the former were used as screening questions and so are available for nearly everyone. Subsequent symptoms and episode characteristics are generally available only to those who passed the screening questions, which predominantly comprises MDD cases but also some controls (at a ratio of about 2.5 to 1). The psychiatric history category includes information on ever having been diagnosed for (and/or subsequently treated for) a range of psychopathology, including depression, bipolar disorder, schizophrenia or psychosis, eating disorder, anxiety disorder, ADD/ADHD, post-traumatic stress disorder, phobia, personality disorder, panic disorder, obsessive compulsive disorder, and alcohol or drug addiction. In addition, ‘ever treated with …’ includes the treatments of antidepressant medication, psychotherapy, online help program or e-health intervention, running therapy or physical activity, light therapy, hospitalization in psychiatric hospital, and electroconvulsive therapy.
Table 3. BIONIC variables
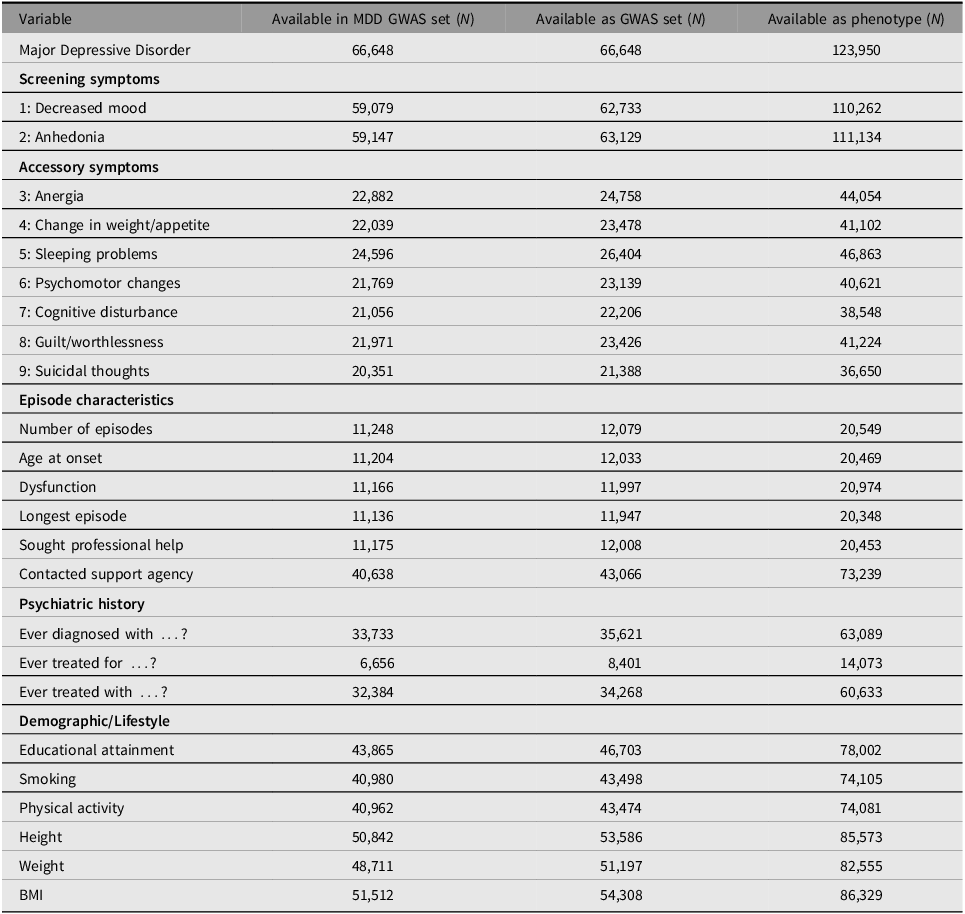
Note: MDD, major depressive disorder.
Table 4 contains a descriptive overview of the full MDD GWAS sample as well as separately for MDD cases and screened controls. From descriptives it appears that MDD cases and controls were comparable in their educational attainment and body size. Mean age was similar in both groups although cases may be slightly younger on average. Women were overrepresented among cases, and cases seemed more likely to be smokers. These descriptives are in line with formal testing in an earlier subsample of BIONIC (Fedko et al., Reference Fedko, Hottenga, Helmer, Mbarek, Huider, Amin, Beulens, Bremmer, Elders, Galesloot, Kiemeney, Loo, Picavet, Rutters, Spek, Wiel, Duijn, Geus, Feskens and Bot2020).
Table 4. Variables descriptives in full MDD GWAS sample and for MDD cases and controls

Note: MDD, major depressive disorder; GWAS, genomewide association study.
The sample with complete phenotype data for MDD and covariates was genotyped across 22 genotype arrays. Table 5 describes the seven array groups that were derived from these datasets. Array group sample sizes appear sufficient for independent analysis before being pooled in meta-analysis. Lifetime MDD prevalence across the seven array groups varied between 18.2% and 31.8%, forming a well-balanced range around the ideal 1-to-4 case-control ratio for binary trait GWAS (Hong & Park, Reference Hong and Park2012).
Table 5. Overview genotype data

Note: NTR, Netherlands Twin Register; NESDA, Netherlands Study of Depression and Anxiety; HRN, Hoorn Studies; DCS, Doetinchem Cohort Study; LASA, Longitudinal Aging Study Amsterdam; mooDFOOD, Multi-country cOllaborative project on the rOle of Diet, Food-related behavior, and Obesity in the prevention of Depression; MOTAR, MOod Treatment with Antidepressants or Running; NESDAsib, Netherlands Study of Depression and Anxiety sibling cohort; NESDO, Netherlands Study of Depression in Older persons; TRAILS, Tracking Adolescents’ Individual Lives Survey; NBS, Nijmegen Biomedische Studie; NQplus, Nutrition Questionnaires plus.
Discussion
In this article we have described the establishment of the BIObanks Netherlands Internet Collaboration (BIONIC) project and its lifetime MDD and genotype databases. Through the collaborative efforts of 16 Dutch cohorts we established the largest depression dataset of its kind in the Netherlands; a dataset that comprises not only MDD status and genetic data but also symptom presentation, episode characteristics, and a range of demographic and lifestyle factors. We provided an overview of the project and its resources, including the development and validation of a standardized homogeneous online depression instrument and its heritability. We showcased the effectiveness of rapid phenotyping in ongoing biobanks, described MDD features in the dataset and established that the BIONIC sample is a good representation of the population of the Netherlands. Finally, we described a pipeline for the preparation of genotype data from multiple genotype arrays and the resulting MDD GWAS set. The GWAS in the Dutch BIONIC sample is underway and in the future we hope to expand these efforts to include analyses of more fine-grained depression information such as symptom presentation.
We expect that the BIONIC resource will make a valuable contribution to our understanding of the genetics of MDD. It can also serve as a resource for epidemiological studies that do not necessarily focus on genetics, as it has already in recent projects (van Loo et al., Reference van Loo, Aggen and Kendler2022, van Loo et al., Reference van Loo, Beijers, Wieling, de Jong, Schoevers and Kendler2023; Vreijling et al., Reference Vreijling, van Haeringen, Milaneschi, Huider, Bot, Amin, Beulens, Bremmer, Elders, Galesloot, Kiemeney, van Loo, Picavet, Rutters, van der Spek, van de Wiel, van Duijn, Feskens, Hartman and Jansen2023), and for studies of the exposome. The focus on a uniform MDD case definition will improve power in genetic association analyses, and the additional depression information will also allow us to dive deeper into the heterogeneous patterns in which depression manifests. That is not to say that the focus on increasing sample size has not been a successful endeavor; the number of genetic variants identified through international efforts is a testament to that (Howard et al., Reference Howard, Adams, Clarke, Hafferty, Gibson, Shirali, Coleman, Hagenaars, Ward, Wigmore, Alloza, Shen, Barbu, Xu, Whalley, Marioni, Porteous, Davies, Deary and McIntosh2019). The focus on deeper phenotyping is a next step in refining our GWAS hits and understanding of MDD etiology (Cai et al., Reference Cai, Revez, Adams, Andlauer, Breen, Byrne, Clarke, Forstner, Grabe, Hamilton, Levinson, Lewis, Lewis, Martin, Milaneschi, Mors, Müller-Myhsok, Penninx, Perlis and Flint2020; Flint, Reference Flint2023).
Population-based studies such as this one will also benefit cross-ancestry projects in the future. An important caveat of GWASs published so far is that the majority has been conducted in European populations, which limits the utility of GWAS-derived findings such as polygenic scores for underrepresented groups (Martin et al., Reference Martin, Gignoux, Walters, Wojcik, Neale, Gravel, Daly, Bustamante and Kenny2017; Martin et al., Reference Martin, Kanai, Kamatani, Okada, Neale and Daly2019). People in the Netherlands have a wide range of ancestral backgrounds, due to historical geographical differences within the population of the Netherlands as well as more recent population admixture. These complex ancestries are somewhat accounted for through principal components in GWAS, but approaches that exclude individuals with the more diverging ancestries, because of analytical difficulties, are not desirable. One of the future goals of our project is to include individuals from all ancestral backgrounds, as analytical approaches to include these are currently actively being studied and developed (e.g., see Peterson et al., Reference Peterson, Kuchenbaecker, Walters, Chen, Popejoy, Periyasamy, Lam, Iyegbe, Strawbridge, Brick, Carey, Martin, Meyers, Su, Chen, Edwards, Kalungi, Koen, Majara and Duncan2019). The database we established originates from the Netherlands, and based on the genotype information we will analyze 66,648 participants of European origin. However, 953 individuals whose ancestry is different from this are also part of BIONIC, and we hope to add the full BIONIC resource to the ongoing efforts in cross-ancestry research that have been established so far.
Another future goal is to examine sex differences in depression. Around the globe, MDD is consistently more prevalent in women, yet existing research based on GWAS has not yet fully addressed this sex difference, and fails to offer an explanation or mechanism. Perhaps this is in line with the finding that female-dominated disorders receive less funding (Smith, Reference Smith2023). Recently, there have been method developments and suggestions to incorporate the analysis of sex differences into GWAS projects (Khramtsova, Wilson et al., Reference Khramtsova, Wilson, Martin, Winham, He, Davis and Stranger2023; Khramtsova, Winham et al., Reference Khramtsova, Winham, Davis, Stranger and Wilson2023; Vink et al., Reference Vink, Bartels, Beijsterveldt, Dongen, Beek, Distel, Moor, Smit, Minica, Ligthart, Geels, Abdellaoui, Middeldorp, Hottenga, Willemsen, Geus and Boomsma2012). Although our own project might not yet be sufficiently powered to implement these suggestions, we intend to address the analysis of sex differences in collaboration with similar efforts and examine, through sex-specific GWAS, the contribution of genetic variants to depression risk separately in men and women, possibly revealing unique biological pathways for each. Similarly, the X-chromosome has long been left unconsidered in GWAS because of analytical difficulties. We aim for the inclusion of the X-chromosome to allow us to search for genetic associations there.
Other goals are to obtain polygenic risk scores (PRS), based on MDD as well as other traits, and to test their associations with MDD in the Dutch population. Based on our meta-analysis we will estimate genetic correlations with a range of other phenotypes as well as with other indices of depression as a way to investigate shared etiology and comorbidity across traits and populations. This work will be carried out as part of an international collaboration with similar online population-wide MDD efforts, such as those that have been or are being carried out in the United Kingdom (the Genetic Links to Anxiety and Depression (GLAD) study; Davies et al., Reference Davies, Kalsi, Armour, Jones, McIntosh, Smith, Walters, Bradley, Kingston, Ashford, Beange, Brailean, Cleare, Coleman, Curtis, Curzons, Davis, Dowey, Gault and Breen2019) and Australia (the Australian Genetics of Depression Study (AGDS; Byrne et al., Reference Byrne, Kirk, Medland, McGrath, Colodro-Conde, Parker, Cross, Sullivan, Statham, Levinson, Licinio, Wray, Hickie and Martin2020). Both have a wide array of MDD and other phenotype data that will facilitate fine-grained analyses of MDD and its symptoms, episode characteristics, and sex differences, especially given the statistical power of the combined samples. Furthermore, we aim to contribute the BIONIC resource to the Psychiatric Genetics Consortium MDD group effort (Howard et al., Reference Howard, Adams, Clarke, Hafferty, Gibson, Shirali, Coleman, Hagenaars, Ward, Wigmore, Alloza, Shen, Barbu, Xu, Whalley, Marioni, Porteous, Davies, Deary and McIntosh2019). Finally, we aim to integrate the MDD and GWA data with other biological (‘omics’) layers, which are available in many BBMRI-NL projects, including the metabolome (Bot et al., Reference Bot, Milaneschi, Al-Shehri, Amin, Garmaeva, Onderwater, Pool, Thesing, Vijfhuizen, Vogelzangs, Arts, Demirkan, van Duijn, van Greevenbroek, van der Kallen, Köhler, Ligthart, van den Maagdenberg and Mook-Kanamori2020), epigenome and transcriptome.
In conclusion, the BIONIC project launches an exciting new era of MDD research and collaboration in the Netherlands and beyond. We hope that this article serves to describe effective methodology in establishing such a database and to promote the dataset resource as well as invite future collaborations.
Supplementary material
To view supplementary material for this article, please visit https://doi.org/10.1017/thg.2024.4.
Data availability
Data are available upon reasonable request from the contributing cohorts.
Acknowledgements
We are very grateful to everyone who participated in this research or worked on this project and its contributing studies.
Funding statement
Funding for the BIONIC project was awarded to Dorret Boomsma and Brenda Penninx by the Biobanking and Biomolecular Resources Research Infrastructure (BBMRI-NL: 184.021.007; 184.033.111). Below are cohort-specific funding declarations and acknowledgments.
Lifelines
The Lifelines initiative has been made possible by subsidy from the Dutch Ministry of Health, Welfare and Sport, the Dutch Ministry of Economic Affairs, the University Medical Center Groningen (UMCG), Groningen University and the Provinces in the North of the Netherlands (Drenthe, Friesland, Groningen). NARSAD Young Investigator Grant from the Brain & Behavior Research Foundation. VENI grant from the Talent Program of the Netherlands Organisation for Scientific Research (NWO-ZonMW 09150161810021). We thank Trynke de Jong for the contribution to Lifelines data collection. We thank Martje Bos and Victória Trindade Pons for their help in preparing the Lifelines phenotype data.
MooDFOOD
European Union FP7 funding for MooDFOOD Project ‘Multi-country cOllaborative project on the rOle of Diet, FOod-related behaviour, and Obesity in the prevention of Depression’ (grant agreement no. 613598).
TRAILS
Participating centers of the TRacking Adolescents’ Individual Lives Survey (TRAILS) include the University Medical Center and University of Groningen, the University of Utrecht, the Radboud Medical Center Nijmegen, and the Parnassia Group, all in the Netherlands. TRAILS has been financially supported by various grants from the Netherlands Organization for Scientific Research NWO (Medical Research Council program grant GB-MW 940-38-011; ZonMW Brainpower grant 100-001-004; ZonMw Risk Behavior and Dependence grant 60-60600-97-118; ZonMw Culture and Health grant 261-98-710; Social Sciences Council medium-sized investment grants GB-MaGW 480-01-006 and GB-MaGW 480-07-001; Social Sciences Council project grants GB-MaGW 452-04-314 and GB-MaGW 452-06-004; ZonMw Longitudinal Cohort Research on Early Detection and Treatment in Mental Health Care grant 636340002; NWO large-sized investment grant 175.010.2003.005; NWO Longitudinal Survey and Panel Funding 481-08-013 and 481-11-001; NWO Vici 016.130.002, 453-16-007/2735, and Vi.C.191.021; NWO Gravitation 024.001.003), the Dutch Ministry of Justice (WODC), the European Science Foundation (EuroSTRESS project FP-006), the European Research Council (ERC-2017-STG-757364 and ERC-CoG-2015-681466), Biobanking and Biomolecular Resources Research Infrastructure BBMRI-NL (CP 32), the Gratama foundation, the Jan Dekker foundation, the participating universities, and Accare. Statistical analyses are carried out on the Genetic Cluster Computer (http://www.geneticcluster.org), which is financially supported by the Netherlands Scientific Organization (NWO 480-05-003) along with a supplement from the Dutch Brain Foundation.
LASA
The Longitudinal Aging Study Amsterdam is largely supported by grants from the Netherlands Ministry of Health, Welfare and Sport, Directorate of Long-Term Care.
NQplus
NQplus was core funded by ZonMw (ZonMw, Grant 91110030); add-on funding was provided by ZonMW Gezonde Voeding (ZonMw, Grant 115100007), BBMRI (Grant BBMRI-NL RP9 and CP2011-38) and Wageningen University and Research.
MOTAR
The MOTAR study was funded by NWO VICI grant number 91811602 of B.W.J.H. Penninx. NWO had no role in the design of the study, the collection, analysis and interpretation of the data, or in the preparation, review, or approval of the manuscript.
The Hoorn Studies
We appreciate the corporation of the participants and research assistants who have been involved in the Hoorn Study and New Hoorn Study. We would like to thank Tootje Hoovers and Jolanda Bosman as well as all the researchers previously involved for the organization of both studies.
NTR
NTR acknowledges funding from the Netherlands Organization for Scientific Research (NWO): Biobanking and Biomolecular Research Infrastructure (BBMRI–NL, 184.033.111) and the BBMRI-NL funded BIOS Consortium (NWO184.021.007); The Netherlands Twin Register is supported by grant NWO 480-15-001/674: Netherlands Twin Registry Repository: researching the interplay between genome and environment, the Avera Institute for Human Genetics and by multiple grants from the Netherlands Organization for Scientific Research (NWO). Genotyping was made possible by grants from NWO/SPI 56-464-14192, Genetic Association Information Network (GAIN) of the Foundation for the National Institutes of Health, Rutgers University Cell and DNA Repository (NIMH U24 MH 068457-06), the Avera Institute, Sioux Falls (USA) and the National Institutes of Health (NIH R01 HD042157-01A1, MH081802, Grand Opportunity grants 1RC2 MH089951 and 1RC2 MH089995) and European Research Council (ERC-230374). DIB acknowledges the Royal Netherlands Academy of Science Professor Award (PAH/6635).
Doetinchem Cohort Study
The Doetinchem Cohort Study is supported by the Dutch Ministry of Health, Welfare and Sport and the National Institute for Public Health and the Environment. We thank the respondents, epidemiologists and fieldworkers of the Municipal Health Service in Doetinchem for their contribution to the data collection for this study. The authors want to acknowledge the logistic management which was provided by P Vissink, and the data managers J van der Laan, R J de Kleine, I Toxopeus. Further, we thank all (senior) researchers who contributed to the data for collection, in particular in (alphabetical order): J M A de Boer, H B Bueno de Mesquita, P Engelfriet, G C Herber-Gast, G Hulsegge, D Kromhout, L Launer, A C J Nooyens, M C Ocke, S H van Oostrom, K Proper, J C Seidell, H A Smit, W G C Wendel-Vos.
NESDA and NESDAsib
The infrastructure for the NESDA study (www.nesda.nl) is funded through the Geestkracht program of the Netherlands Organisation for Health Research and Development (ZonMw, grant number 10-0001002) and financial contributions by participating universities and mental health care organizations (VU University Medical Center, GGZ inGeest, Leiden University Medical Center, Leiden University, GGZ Rivierduinen, University Medical Center Groningen, University of Groningen, Lentis, GGZ Friesland, GGZ Drenthe, Rob Giel Onderzoekscentrum).
NESDO
The infrastructure for NESDO is funded through the Fonds NutsOhra, Stichting tot Steun VCVGZ, NARSAD The Brain and Behaviour Research Fund, and the participating universities and mental health care organizations (VU University Medical Center, Leiden University Medical Center, University Medical Center Groningen, Radboud University Nijmegen Medical Center, and GGZ inGeest, GGNet, GGZ Nijmegen, GGZ Rivierduinen, Lentis, and Parnassia).
Competing interests
None.
Ethical statement
All relevant ethical regulations for working with human participants were followed in the conduct of the study, and written informed consent was obtained from all participants.


 Open access