


Introduction
Automated heat (oestrus) detection systems that optimise herd pregnancy rates and hence milk production are now commonplace on dairy farms (McGowan et al., Reference McGowan, Burke and Jago2007; Roelofs and Kooij, Reference Roelofs and Kooij2015; Heat Detection and Health Monitoring – National Milk Records, 2018). The success of these systems has generated a positive message within the sector highlighting the benefits that technology can bring. Currently, all of the commercial systems are vendor specific and are generally not open to interaction with third parties. They comprise a number of distributed sensor nodes that communicate via a custom radio channel to a central computer where a decision support user interface interprets the measurements for the herdsman. As rural connectivity improves, the trend is to mirror these systems on a cloud-hosted platform that facilitates access through a range of mobile devices. Consequently, a significant opportunity exists to integrate multiple sensor data streams to produce a more holistic understanding of animal welfare and production performance. A number of Internet enabled commercial platforms have been created with this purpose (Glas Data, 2018, 2019; Farmnet365, 2019). This paper illustrates a range of sensor methods and considers how their data can be integrated, for example combining cattle collar based measurements with milk constituent analysis and/or feed composition, to optimise farm production. Examples show how the approach can potentially lead to more specific diagnosis of illness, in the current case mastitis and by promoting early detection support strategies to reduce antibiotic usage.
Internet of Things in the dairy industry
Within the past ten years, methods for automating the process of monitoring the behaviour of cattle have become increasingly important. In the UK, there has been a steady decline in the number of milk producers. The number of dairy cows in the UK has dropped from 2.6 million in 1996 to 1.9 million in 2015 (AHDB Dairy, 2016). Similarly, the number of dairy producers has fallen from 35 741 in 1995 to 13 815 in 2014. In tandem the average herd size has risen as those holdings with smaller herds have been forced out of the industry. In 2014 the average number of cows per herd was 133 compared to 97 in 2004. A direct consequence has been that the time available to farmers for observing their herd has reduced and increasingly farmers are relying on technology to undertake this function, underlined by the growth in oestrus, or ‘heat’, detection products that assist in the optimisation of fertility services (Afimilk, 2015; Roelofs and Kooij, Reference Roelofs and Kooij2015; Borchers et al., Reference Borchers, Chang, Tsai, Wadsworth and Bewley2016).
Oestrus detection in dairy cattle
The cost of cattle infertility derives from the loss of revenue from milk production. If an eligible cow is not bred (or is incorrectly bred), the farmer loses approximately 21 d of milk production with an estimated value of around £140 per cow in the UK at a representative milk price (AHDB Dairy, 2016). An examination of the efficiency of farm workers to detect heat carried out in 1994 over 4550 herds in the US, found a mean detection accuracy of 38% (Gröhn and Rajala-Schultz, Reference Gröhn and Rajala-Schultz2000; Lucy, Reference Lucy2001; Wathes et al., Reference Wathes, Taylor and August2002). In contrast, technological solutions are reported to perform with success rates upwards of 80–90% (McGowan et al., Reference McGowan, Burke and Jago2007; Robert et al., Reference Robert, White, Renter and Larson2009; Wolfger et al., Reference Wolfger, Timsit, Pajoe, Cook, Barkema and Orsel2015; Heat Detection and Health Monitoring – National Milk Records, 2018).
Oestrus (heat) detection systems are exemplars of the successful application of an ‘Internet of Things’ methodology. Low power sensor technologies, usually Micro-Machined Electromechanical (MEMs) accelerometers, are combined with low power wireless radio chipsets to provide a monitoring capability that operates 24 h per day over an extended period of time (5 to 10 years). To determine when a cow is on heat the activity of the animal is measured. It is well known that cattle in heat (oestrus) become restless (Kiddy, Reference Kiddy1977; Van Vliet and Van Eerdenburg, Reference Van Vliet and Van Eerdenburg1996) hence machine learning or statistical approaches can be used to identify outlier behaviour that aligns with the onset of heat (Eradus et al., Reference Eradus, Scholten and Cate1996; Martiskainen et al., Reference Martiskainen, Järvinena, Skön, Tiirikainen, Kolehmainen and Mononen2009). Measurement of this change in activity is readily achieved using MEMs accelerometers (Pastell et al., Reference Pastell, Tiusanen, Hakorjarvi and Hanninen2009; Robert et al., Reference Robert, White, Renter and Larson2009; Michie et al., Reference Michie, Andonovic, Tachtatzis, Davison and Konka2017), however, it is not possible to transmit all of the unprocessed accelerometer data which may operate in three-axes with a sample frequency of 10 Hz or more. This is because the low power wireless transmission channels do not have sufficient bandwidth. Data must, therefore, be processed locally (i.e. on the animal) with only periodic status updates being relayed along with alerts every hour or two to preserve power consumption. Alternatively, data can be pre-processed into summaries that describe the dominant signal characteristics over a period of time such that this information can be subsequently processed. In this manner substantial savings in radio transmission power consumption are obtainable and battery lifetimes of 5–10 years are common (Michie et al., Reference Michie, Andonovic, Tachtatzis, Davison and Konka2017). Information generated in this way can then be processed on a central farm computer or in the cloud to represent the measurement data in a manner that is meaningful to the herdsman to support their daily decision making.
Automated measurement of animal welfare
Heat detection systems are now well accepted within the dairy industry to the extent that there is strong competition to differentiate products through the inclusion of additional features that give insight into illness or other key welfare conditions. Moreover, consumers are becoming more aware of animal welfare. Surveys of UK consumers carried out more than a decade ago as well as much more recently (Kjærnes, Miele, and Roex, Reference Kjærnes, Miele and Roex2007; Wolf et al., Reference Wolf, Tonsor, McKendree, Thomson and Swanson2016) suggested that most of those surveyed (93% in the case of the earlier survey) would be willing to pay a premium for milk produced with a strong focus on welfare. The details of this survey were not discussed in detail but nonetheless there is at least anecdotal evidence of an increasing awareness of animal welfare among consumers. Supermarkets are moving to models where a premium is paid to the producer based on evidence of practices with a high degree of consideration of animal welfare (Arlafoods Ltd, 2019). Measurement technology that can automate the process, remove the subjectivity and cost of human observation clearly has a role to play.
Monitoring the feed intake of cattle is considered an excellent proxy for establishing a view of overall health. At present there is no mechanism for directly measuring feed intake in a production environment. However, it is possible to measure the time that a cow exhibits feeding behaviour using accelerometer collars. This is a good alternative to feed intake as a welfare measure: cows that are sick eat less or spend less time eating. The same is true for rumination (Phillips, Reference Phillips1993; Walker et al., Reference Walker, Smith, Routli, Jones, Morris and Dobson2008; Mottram, Reference Mottram2016; Thorup et al., Reference Thorup, Nielsen, Robert, Giger-Reverdin, Konka, Michie and Friggens2016). A healthy dairy cow will feed for two to three hours per day and ruminate for 500 min to 600 min per day (Soriani et al., Reference Soriani, Panella and Calamari2013). The rumination process is characterised by a steady rhythmic chewing action lasting for around 50 s per bolus (Kononoff et al., Reference Kononoff, Lehman and Heinrichs2002; Borchers et al., Reference Borchers, Chang, Tsai, Wadsworth and Bewley2016; Deniz et al., Reference Deniz, Chelotti, Galli, Planisich, Larripa, Rufiner and Giovanini2017). The steady rhythm allows rumination to be identified from the motion of the neck muscles hence facilitating the use of accelerometers to detect and time this behaviour. The process of extracting the rumination information is not the subject of the present paper but for illustration the accelerometer output shown in online Supplementary Figure S1 shows an example of a rumination sequence measured using an accelerometer collar and verified by comparison with a pressure sensitive halter monitoring jaw action (Michie et al., Reference Michie, Andonovic, Tachtatzis, Davison and Konka2017). Although the Signal-to-Noise Ratio (SNR) of the accelerometer signal is lower than the pressure data, the same features (periodic motion followed by a cessation of activity) are apparent. Processing on the collar to identify the chewing frequency enables rumination periods to be readily captured without transmitting unprocessed accelerometer signals, hence optimising battery lifetime. Feeding signatures differ from rumination because during feeding there is significantly more neck motion. A range of approaches to resolving these two behaviour classes with reasonable precision has been reported elsewhere (Martiskainen et al., Reference Martiskainen, Järvinena, Skön, Tiirikainen, Kolehmainen and Mononen2009;Tani et al., Reference Tani, Yokota, Yayota and Ohtani2013; Fargas and Petersen, Reference Fargas and Petersen2017; Rutten et al., Reference Rutten, Kamphuis, Hogeveen, Huijps, Nielen and Steeneveld2017). The value of such measurements is illustrated in Figure 1 which shows a representative measurement from the Silent Herdsman platform (Afimilk, 2015) showing an example where rumination and feeding patterns have dropped below 25% of their running average. In this particular case the changes enabled the early detection of a significant illness event. There is an important point to make here. While early indication of illness is possible using automated systems, diagnosis of the specific illness should usually be the responsibility of the veterinarian. A significant drop in the average time spent eating and/or ruminating serve to indicate to the farmer that the cow should be examined further. The following section will demonstrate how an early illness indication can be combined with other automated measurements to potentially generate a more precise illness alert directly from automated measurements.

Fig. 1. Feeding and rumination patterns taken from Silent Herdsman accelerometer data showing sharp reduction reflective of illness.
Mastitis detection from milk component analysis
The use of robotic milking stations significantly reduces the workload of the dairyman but at the same time reduces the opportunity for visual observation to identify instances of oestrus and potential illness. In-line milk analysis tools can compensate in part for reduced observation and provide ready access to important chemical parameters relevant to welfare for those animals that are being milked. The fat/protein ratio can give an indication of energy imbalance and consequently susceptibility to illness. Electrical conductivity (Nielen et al., Reference Nielen, Deluyker, Schukken and Brand1992; Maatje et al., Reference Maatje, de Mol and Rossing1997; Brandt et al., Reference Brandt, Haeussermann and Hartung2010) measurements have been used to indicate potential mastitis.
IoT-enabled sensor fusion
Internet-enabled connectivity between sensor systems enables the integration of ranges of data streams that has hitherto been complicated to achieve. Figure 2 illustrates the platform where data from a range of measurement devices, cattle collars, milking station and feed wagon are integrated into a cloud infrastructure. Presently these systems are typically vendor specific and do not communicate readily with each other. The cloud framework offers an ideal mechanism for lowering the barriers to execute full integration. In the following examples the additional benefit that can be derived from integrating data re-enforces the potential benefits that result.
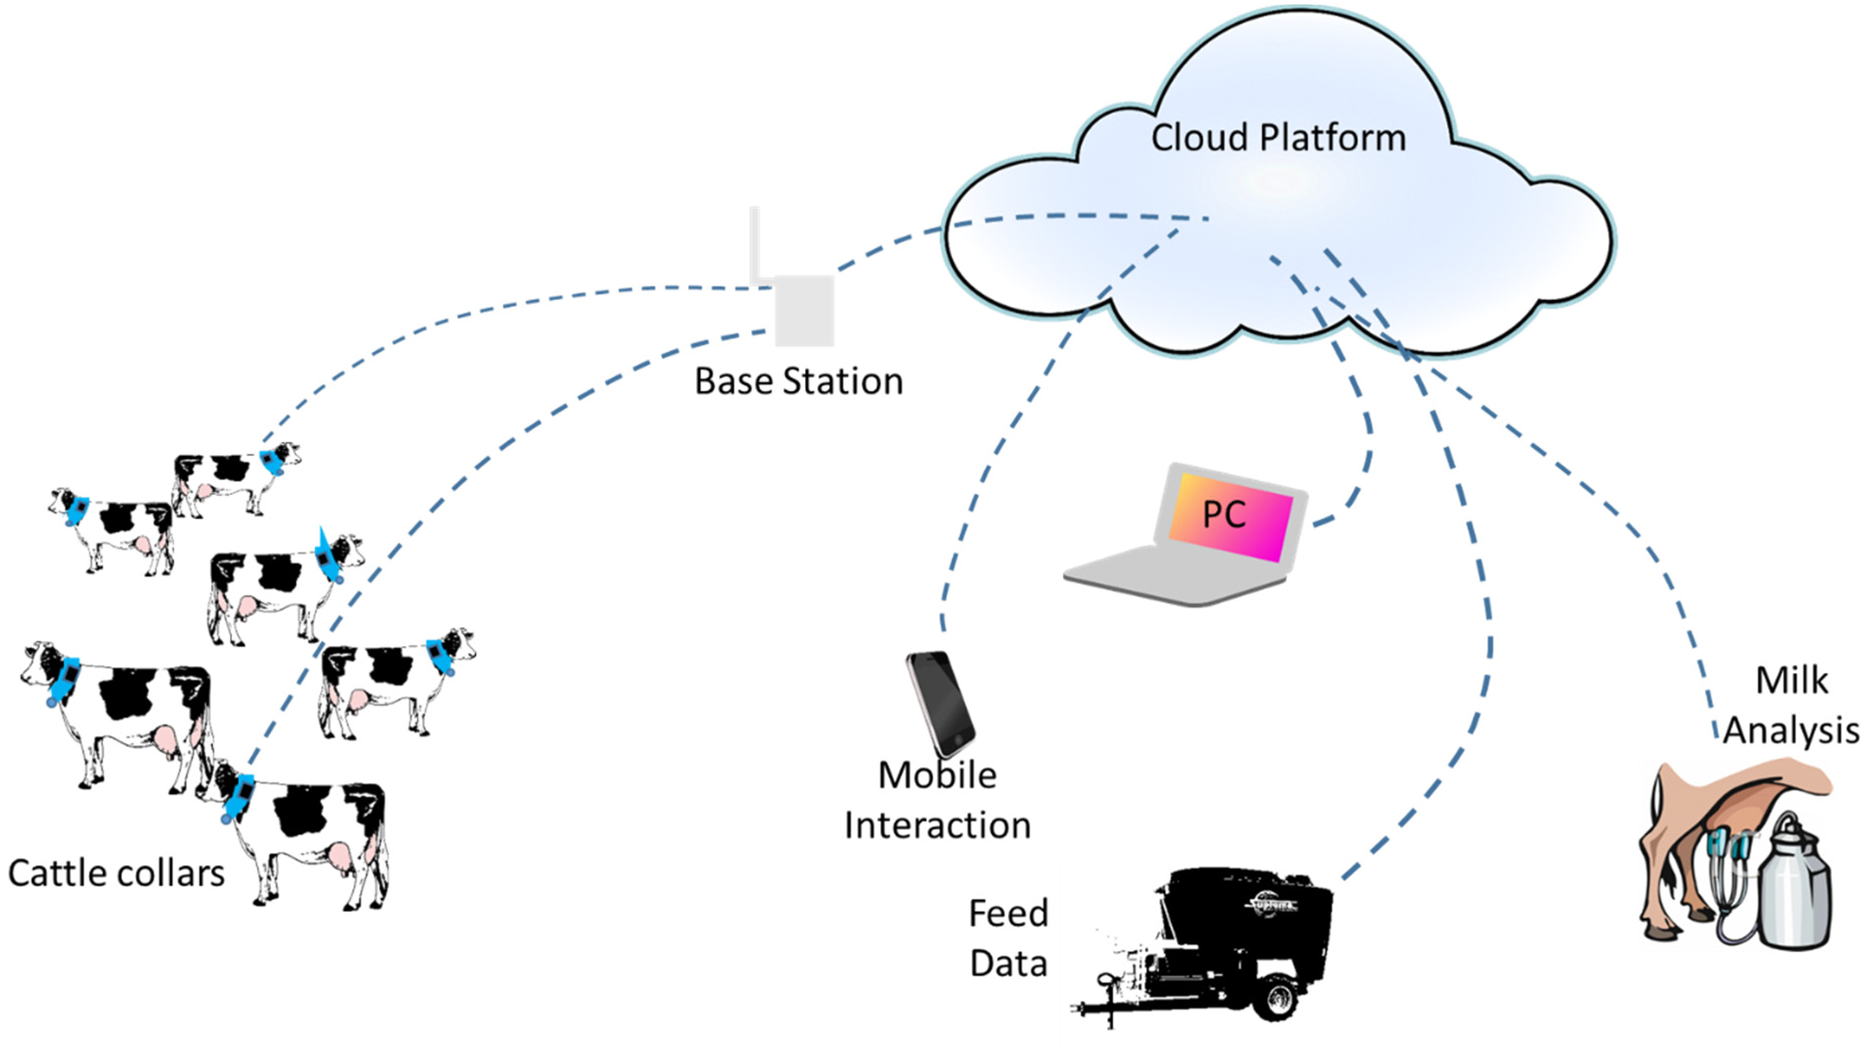
Fig. 2. Schematic of Internet-enabled farm.
Early detection of mastitis in dairy cattle
Measurements of milk conductivity are readily implemented in robotic milking stations. Since cattle visit the milking robot several times daily, there is an inherent and ideal opportunity to obtain data from which to identify a signature that can be used to identify the possible onset of mastitis. The advantage of early detection of mastitis is that early treatment is enabled thus minimising or potentially removing the need for antibiotics and in turn maintaining the continuity of production.
Sensors integral to the milking robot measure the conductivity of the milk as it is extracted from each udder quarter. The change in conductivity arises from an increase in milk Na+ concentration as cell-cell tight junctions become leaky as a consequence of infection. As measurements are made on each quarter, systemic (whole-udder) day-to-day variation can be ruled out and the location of mastitis can be identified. Changes in conductivity owing to mastitis are observed in advance of visible changes in foremilk or udder tissue (Nielen et al., Reference Nielen, Deluyker, Schukken and Brand1992; Maatje et al., Reference Maatje, de Mol and Rossing1997; Viguier et al., Reference Viguier, Arora, Gilmaring, Welbeck and O'Kennedy2009).
Despite the demonstrated positive value of conductivity measurements, instances where sensors can produce misleading outputs remain. To improve detection, we combined milk component analysis from a Fullwood milking robot with accelerometer derived data from the Afimilk Silent Herdsman collar to produce a solution that provides an early indication of the onset of mastitis which informs an early intervention action. The combination of the two measurements provides corroboration between two radically different sensor modalities and provides an improvement in the measurement reliability and accuracy. Welfare alerts are generated by the milking robot when the conductivity of the milk rises above a nominal normal value. Figure 3a shows an example where significant increases in conductivity were detected on all four quarters over a period of three days, a condition that would alert as potential mastitis. However, in this instance the associated collar derived welfare indicators (feeding and rumination) are stable over this period. A cow with mastitis would be expected to feed and ruminate to a lesser degree. Given that this did not happen suggests that the conductivity increase is not due to mastitis. It was in fact the result of a fertility treatment administered to a group of cattle: all cattle within the group displayed a rise in milk conductivity without any significant change in feeding/rumination behaviour. Thus, the additional data stream provides information that can be used to qualify an alert and indicate that there was no significant welfare issue. An example of a genuine mastitis response is shown in the measurement combinations in Figure 3b which shows a sharp fall in the time spent feeding/rumination as the mastitis infection progresses. Rumination and feeding have dropped by more than 25% the day prior to a rise in conductivity being detected. After the collar alert, the rise in conductivity is observed followed by an indication from the farmer that he has noticed the signs of mastitis.

Fig. 3. Examples of combining accelerometer and milk composition data for detection of mastitis. Figure 3a: Healthy cow, showing false-positive indicated by conductivity and confirmed to be false by absence of any change in feeding and rumination. Figure 3b: actual case of mastitis. Conductivity increases and in this case feeding and rumination have decreased.
During a six month observation period carried out on a dairy farm in Fife, Scotland, milk conductivity data and feeding/rumination behaviour was examined from 47 cases of mastitis cattle. The cattle were part of a 200 strong herd that was robotically milked. During the trial period, dairymen observed the cattle for visible signs of welfare issues and recorded instances of mastitis and the time diagnosis was made. The objective of the investigation was to determine whether or not conductivity increases during mastitis were accompanied by changes in feeding and/or rumination. We also aimed to determine whether or not collar derived signals showed a response to illness before or after conductivity changes. To detect clinical mastitis, cattle were observed at milking to analyse the milk composition and for signs of both udder inflammation as well as of general illness. The dairymen made use of the information from both the Silent Herdsman system and the milking robot to identify cattle at risk but only confirmed this analysis following visual observation and examination of milk quality. In almost all cases, feeding and rumination indicators generated an alert prior to the condition being detected by the dairymen and before rises in milk conductivity. In 74% of cases, the feeding/rumination signatures alerted the onset of mastitis at least one day before the condition was noted by staff, and more than 90% of cases were detected at least as early as the farm observations (or confirmed on the day of alerting). Given that the evaluation of performance was executed under trial conditions where the staff were specifically tasked with maintaining a close watch on the herd for welfare related indicators, the efficacy of the approach is noteworthy. Conductivity changes were generally noted after the collar alerts, 25% of which were in advance of the observation and 50% at least equal to it. In 12% of cases, conductivity increases were observed after detection had been confirmed by the dairymen. Changes in the fat-to-protein ratio were not observed to be a strong indicator for mastitis in the sense that the changes were identified before the farmer's observation in a relatively small, 13% of cases. The data are shown in online Supplementary table S1. The study focused only on cattle that were diagnosed as having mastitis in order to assess whether or not the combination of collar and milk conductivity could provide an early indication. False positive alerts were generated where animals had no indication of mastitis, however, these animals were found to have other relevant welfare issues that were responsible. Detailed analysis of this has not been performed.
The combination of the two streams of data illustrates an early example of the potential benefits arising from a combination of sensors to either increase the reliability of the method (remove instances of false positives as noted following fertility treatment) or to provide an early indication of a welfare event followed by additional reaffirmation to assist in subsequent diagnoses. Illnesses that present as a drop in feeding and rumination behaviour may be detected in a timely manner and the nature of the illness confirmed using subsequent conductivity measurements.
Optimising feeding for cattle
Producing high quality food from either beef or dairy cattle presents significant challenges. Animal welfare is paramount both from a moral standpoint and to optimise production efficiency. One of the main costs of milk or beef production is attributed to the animal feed.
While commercial vendors offer collar and ear tag based systems that provide estimates of the time an individual animal spends feeding or showing feeding behaviour, to date no mechanism exists for production settings that enable farmers to quantify the amount that an individual animal consumes and to relate feed intake to the nutritional demands required to grow or to produce beef or milk optimally. Significant advances have been made in terms of delivering consistent mixes of feed across the herd through the use of feed-mixer wagons which have replaced humans to ensure that the uniformity of the feed mix is guaranteed and that animals are not compromised by poor feed quality because they are fed at a point in the delivery where the mix was deficient and lacked essential components. These wagons are now equipped with Internet-enabled telemetry to record the composition of the feed mix in a cloud hosted platform such that the nutritional history is known and its relationship with welfare can be quantified (Keenan, 2019). More recently, manufacturers have integrated spectroscopic analysis equipment into the feeder wagon to further optimise the process (Barbi et al., Reference Barbi, Ghiraldi, Manzoli and Berzaghi2010). Real time analytical measurements are recorded to deliver precise information on feed composition at the point of delivery. These advances support the possibility of precision feeding to be considered.
Deriving time spent feeding and ruminating using collars or ear tags offers the potential to measure feed intake provided that, firstly, time spent feeding and intake are well correlated and, secondly, collar/ear tag technology provides an accurate indication of the time spent feeding. The following analysis reports the potential for determining feed intake from time spent feeding alone. The research was carried out on a finishing farm where beef cattle were fed using an automated feeder (Hokofarm, 2019) which records the time animals spend feeding and the feed consumed. The time at the feeder was used to estimate the feed intake on a per animal basis in order to remove other potential sources of error derived from, for example, collar based feeding time measurements. 80 beef finishing cattle were used in the study divided into two groups of 40 and given diets of different composition. The diets (as total mixed rations) were generated using a diet mixing wagon and consisted of (g/kg DM) forage to concentrate ratios of either 500 : 500 (MIXED) or 79 : 921 (CONCENTRATE). Each animal was tagged with a radio frequency ear tag with a unique identifier, the basis for recording the time spent at individual feeding station and the feed intake (kg removed from the feeding station) during a feeding bout. This information enabled the correlation between time spent feeding and feed intake to be confirmed.
Feed intake (FI) was firstly estimated from the proportion of the time that an animal in a group spends feeding (t feed), compared to the total time that the group (t group) spends feeding along with knowledge of the feed delivered (F del) and the residual feed left over (F res), described mathematically below as:
 $$FI = \lpar {F_{{\rm del}}-F_{{\rm res}}} \rpar \displaystyle{{t_{{\rm feed}}} \over {t_{{\rm group}}}}\;{\rm kg}$$
The errors that are embedded in this approach are shown in online Supplementary Figure S2. The difference between the estimated intake for each animal and the actual intake over the 56 d period is recorded in a box plot. The Root Mean Square Error, RMS, of feed intake is 3.5 kg (freshweight) for the MIXED diet and 2.44 kg for the CONC diet. Some animals consistently show an underestimate in feed intake while others an over estimate. Which is which is purely down to coincidence, since the error reflects how close an animal's behaviour is to the mean for the herd. Clearly there are significant errors in this approach which is the result of individual feeding behaviour. We then employed Random Forest and Support Vector Regression models trained on feeding duration, number of visits to the feed bin and the animal live-weight, to estimate feed intake. Lower RMS errors 2.0 kg (Freshweight) were obtained for the MIXED diet and 1.24 kg for the CONC diet, the data are shown in online Supplementary Figure S3. The feed intake estimates were used to calculate feed conversion ratio FCR based on the ratio of average daily intake to average liveweight gain. The predicted and actual FCR are shown in online Supplementary Figure S4. This example represents the case for a concentrate feed diet and has an R 2 value of 0.92 between the estimated FCR and the actual FCR (calculated from feed intake estimates). This data was then used to estimate the best performers and poorest performers across the herd. The predicted value was contrasted against a calculated value derived from the feeder measurements and the liveweight gain measurements. This data was used to rank the animals into three groups – top performing, middle performing and lowest performing. In the case of the 40 steers given the concentrate ration, 11 out of 12 animals were correctly identified as being in the top 3rd of the group in terms of FCR. Similarly, 12 of the 13 animals were correctly identified as being low performers. These data are shown in online Supplementary Table S2. A fuller analysis is in preparation, however, the results are encouraging in that they suggest that useful data can be provided in a production setting using feed time estimates.
New sensor modalities
Radar physiological measurements
As the benefits that can be obtained from new technology are more widely disseminated, other emerging technologies will be adopted from other sectors and re-purposed for agricultural use. One potential example of this is radar. Radar systems use radio frequency (RF) waves to typically determine the range, angle and velocity of objects. The widescale production of these for the automotive industry has brought their cost to around £100.
Radar systems operate by sending radio frequency signals towards an object and measuring how the reflected signal changes over time to determine parameters such as the range and velocity. Doppler frequency refers to the frequency shift introduced in a wave due to the relative motion between the transmitter and observer. This allows the receiver to determine the speed of an object by comparing the frequency of the transmitted signal with the received.
Micro-Doppler radar
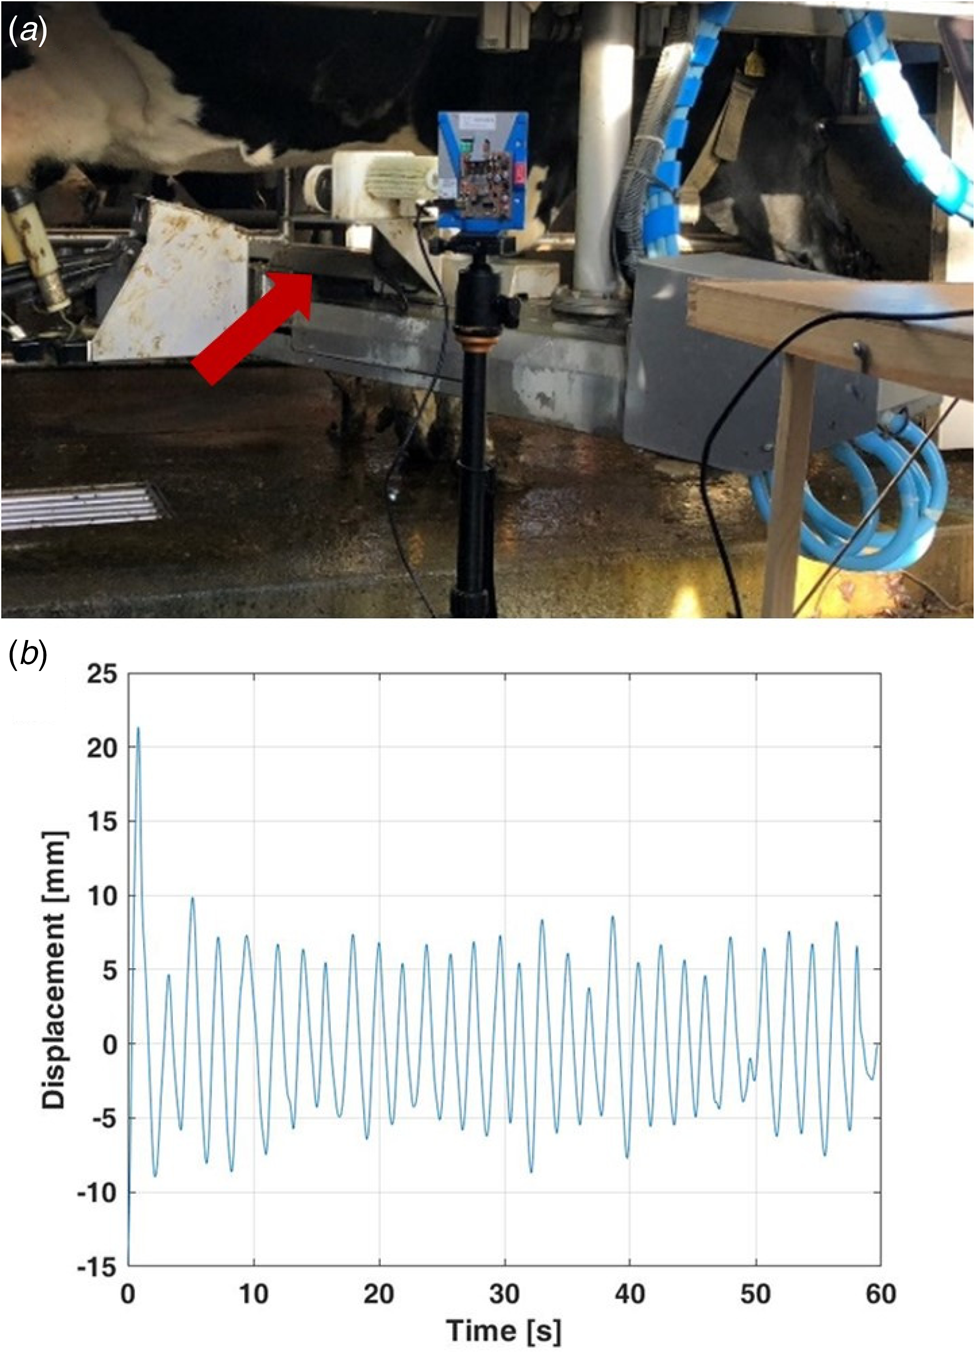
In addition to the frequency shift introduced by the bulk motion of the target, other micro-motions such as vibrations and rotations may also introduce changes in frequency. The micro-Doppler phenomenon simply refers to the Doppler characteristics of these secondary motions. Micro-Doppler can also be used to observe smaller motions and vibrations on the body. One very topical issue is the use of radar to extract respiration and heart rates using the micro-Doppler phenomenon which facilitates contact-less monitoring of patients with relatively low-cost solutions (Diraco et al., Reference Diraco, Leone and Siciliano2017). In an agricultural setting this can be of great advantage in minimising stress to the animal from handling and safer operating conditions for vets by removing the need for contact with a potentially stressed animal. Figure 4a shows a radar system positioned adjacent to a milking robot as a precursor to integration. The motion of the chest cavity, detected from the micro-Doppler phase is shown in Figure 4b. The motion aligns with the respiration of the animal. These signals have been used to identify respiration and heart rate in humans and it is possible to do so in cattle. This will potentially enable a non-contact measurement of key physiological conditions that relate to animal welfare.
In addition to this, global motion such as that detected during walking produce radar signatures that can be processed to identify changes in gait due to lameness (Busin et al., Reference Busin, Viora, King, Tomlinson, LeKernec, Jonsson and Fioranelli2019). Initial trials of the technology suggest that good agreement exists between observational data and lameness prediction (sensitivity 85% and specificity 81%). Thus, this technology has a range of potential applications within the dairy sector.
Conclusions
Growing adoption of monitoring technologies that furnish farmers with real time information on animal behaviour supports the wide scale implementation of decision support tools. As rural connectivity improves, these systems are increasingly connected to a cloud environment enabling the provision of Internet of Things-inspired solutions and services. We have described the use of heat detection technologies that are now commonplace on farms and have shown that these systems can be enhanced by combining with other sensor modalities. Collar derived feeding and rumination with individual-quarter milk conductivity from milking robots supports the development of more robust detection of mastitis. Estimates of time spent feeding can in principal be used as a proxy for feed intake. A recent study provides a benchmark for the operation of these systems, using accurate measurements of time spent feeding to predict Feed Conversion Ratio. The process allowed high performing and low performing animals to be identified. Translating the process to use collar derived feeding times will support the transfer of this approach on to a farm environment. For dairy cows, integration of feeding times and milk production data with feed composition within a cloud-based environment will facilitate the process. The benefits of IoT-based technology are now beginning to be validated. Further novel sensor developments are likely to augment this to add greater value. We have also described the use of miniature radar devices, designed for the automotive industry, to measure respiration rate within cattle. The same devices can give indication of heart rate and produce signatures that are characteristic of mobility.
Supplementary material
The supplementary material for this article can be found at https://doi.org/10.1017/S0022029920000680.
Acknowledgements
This article is based upon work from COST Action FA1308 DairyCare, supported by COST (European Cooperation in Science and Technology, www.cost.eu). COST is a funding agency for research and innovation networks. COST Actions help connect research initiatives across Europe and enable scientists to grow their ideas by sharing them with their peers. This boosts their research, career and innovation. The authors wish to acknowledge the support of Innovate UK 10283 CowHealth and Innovate UK/BBSRC BB/M027333/1 PrecisionBeef.


 Open access