


Suboptimal fruit intake is a leading dietary contributor to cardiometabolic diseases worldwide(1). Substantial observational evidence shows that greater fruit consumption is associated with lower risk of CVD(Reference Aune, Giovannucci and Boffetta2,Reference Bechthold, Boeing and Schwedhelm3) , type 2 diabetes(Reference Li, Fan and Zhang4,Reference Schwingshackl, Hoffmann and Lampousi5) and the metabolic syndrome(Reference Lee, Lim and Kim6), and increasing fruit and vegetable intake improves risk factors such as blood pressure and lipids/lipoproteins(Reference Appel, Moore and Obarzanek7,Reference Toh, Koh and Kim8) . Strategies to increase fruit intake are needed to reduce the burden of cardiometabolic diseases.
Optimal fruit intakes, associated with the lowest risk of mortality, range from 200 to 300 g/d for most diseases(1). This range is consistent with dietary guidelines in many countries(9–11), which encourage selection of various whole, non-juice forms of fruit including fresh as well as frozen, cooked, canned and dried fruits. Dried fruits are shelf-stable forms of fruit that are widely available and can be eaten without preparation as a snack or included in a meal, thereby overcoming some common barriers to adequate fruit intake(Reference Nicklas, Jahns and Bogle12,Reference Haynes-Maslow, Parsons and Wheeler13) . Traditional dried fruits are dried by sun or thermal processing, without addition of sugar or juice(Reference Sadler, Gibson and Whelan14), and largely retain the nutrients and bioactives in their fresh counterparts, excluding heat- and light-sensitive vitamin C(Reference Kamiloglu, Toydemir and Boyacioglu15). Most dried fruits are good sources of dietary fibre and K(16), which have been associated with lipid-lowering and vascular benefits, respectively(Reference Dreher17,Reference Blanch, Clifton and Keogh18) . Although dried fruits are concentrated sources of simple sugars, the sugars in traditional dried fruits are intrinsic to the fruits and are excluded from recommended limits for added sugar consumption(Reference Swan, Powell and Knowles19). Compared with fresh fruits, carotenoid contents of dried fruits are generally reduced, while the effect of drying on phenolic contents varies, with increases in some types and decreases in others reported(Reference Kamiloglu, Toydemir and Boyacioglu15). Authoritative dietary guidelines recognise dried fruits as acceptable alternatives to fresh fruits(9–11). Though dried fruit consumption is low in Western countries(Reference Sadler, Gibson and Whelan14,Reference Bachman, Reedy and Subar20–Reference Jesionkowska, Sijtsema and Simoneaux22) , encouraging consumption could be a strategy to improve fruit intake and, thereby, benefit cardiometabolic health.
Few randomised trials have assessed the cardiometabolic effects of consuming dried fruits(Reference Tinker, Schneeman and Davis23–Reference Puglisi, Vaishnav and Shrestha28). Single fruit interventions were used in previous studies, which limits the generalisability of findings and contrasts with the recommendation to consume a variety of fruits(9). Furthermore, most trials have utilised a parallel design with small sample sizes, making it difficult to distinguish within-person from between-person variation(Reference Anderson, Weiter and Christian25,Reference Bays, Weiter and Anderson26,Reference Puglisi, Vaishnav and Shrestha28,Reference Clayton, Fusco and Schreiber29) . Therefore, we conducted a randomised crossover trial to determine the effect of daily consumption of mixed dried fruits, compared with energy- and carbohydrate-matched snacks, on cardiometabolic risk factors in adults with elevated baseline risk. The primary endpoint was LDL-cholesterol, an established causal factor in the development of CVD(Reference Ference, Ginsberg and Graham30). We hypothesised that inclusion of 3/4 cup of mixed dried fruits as part of habitual dietary intake would decrease LDL-cholesterol due to the fibre content, compared with the processed low-fibre snacks. We further hypothesised that dried fruits would lower brachial and central blood pressure and improve arterial stiffness compared with the control group, due to the phenolic compounds(Reference Bondonno, Croft and Ward31) and K(Reference Blanch, Clifton and Keogh18) provided by dried fruits. Markers of glycaemic control, C-reactive protein and other lipids/lipoproteins were also assessed.
Methods
Study design
A two-period randomised crossover trial was conducted to determine the effect of daily dried fruit consumption on cardiometabolic risk factors, compared with an energy- and carbohydrate-matched control. A computer-generated randomisation scheme (www.randomization.com) was used to assign the condition order for enrolled participants; each condition was followed for 4 weeks. After a 2- to 4-week compliance break, subjects crossed over to the alternate condition. The Metabolic Diet Study Center manager kept the randomisation code, and the personnel responsible for endpoint measurement and analysis were blinded to condition allocation until study completion. Participants were not blinded to the condition allocation.
The primary outcome was LDL-cholesterol. Secondary outcomes included concentration, size and particle number of major lipid and lipoprotein classes, fasting glucose, fasting insulin, high-sensitivity C-reactive protein, brachial systolic and diastolic blood pressure, central systolic and diastolic blood pressure, central augmentation pressure, augmentation index, carotid-femoral pulse wave velocity and blood pressures assessed by 24-h continuous blood pressure monitoring. Serum proprotein convertase subtilisin/kexin type 9 (PCSK9) concentration was an exploratory outcome. This study was conducted according to the Declaration of Helsinki Ethical Principles for Medical Research, and all procedures involving human subjects were approved by the Institutional Review Board of the Pennsylvania State University, STUDY00004871. Written informed consent was obtained from all subjects. All data were collected at the Pennsylvania State University Clinical Research Center. This trial is registered at ClinicalTrials.gov, identifier NCT03020758.
Participants
Adults (aged 25–60 years) with a BMI 25–36 kg/m2 and at least one additional cardiometabolic risk factor were recruited in State College, PA from January 2017 to November 2018. Subjects were recruited using posted flyers, mailed and online advertisements, and direct communication with previous study participants who consented to be contacted. An initial telephone screening was conducted to ascertain eligibility based on key inclusion and exclusion criteria. Individuals who were eligible based on the telephone screening attended a screening visit at the Clinical Research Center. Participants were instructed to fast for 12 h (no food or beverage consumption other than water); refrain from strenuous activity for 24 h; and avoid taking anti-inflammatory medications for 48 h prior to the screening visit. Weight was assessed to the nearest 0·1 kg using a digital scale, with participants dressed in light clothing with shoes removed. Height was assessed to the nearest 0·5 cm using a mechanical stadiometer. Blood pressure was measured in triplicate using a manual sphygmanometer following a 5-min rest period; the average of the last two measurements was used. Waist circumference was measured by two nurses to the nearest 0·1 cm using a tape measure positioned in a horizontal plane around the abdomen at the level of the iliac crest; two measurements within 0·5 cm were taken and averaged. Blood samples drawn by venepuncture were processed to separate serum and plasma and then immediately refrigerated. Blood was analysed for lipids, lipoproteins, glucose, blood chemistry and complete blood count (Quest Diagnostics). Qualifying risk factors included elevated blood pressure (systolic 120–159 mmHg, diastolic 80–99 mmHg); increased waist circumference (men ≥ 94 cm, women ≥ 80 cm); fasting glucose ≥ 100 mg/dl (5·55 mmol/l) and <126 mg/dl (6·99 mmol/l); fasting TAG >150 mg/dl (1·69 mmol/l) and <350 mg/dl (3·95 mmol/l); low HDL-cholesterol (men < 40 mg/dl (1·03 mmol/l), women < 50 mg/dl (1·29 mmol/l)) and LDL-cholesterol > 116 mg/dl (3·00 mmol/l; mean LDL-cholesterol in US adults(Reference Carroll, Kit and Lacher32)). Exclusion criteria included the following: allergy to study foods, tobacco use, alcohol consumption >14 drinks/week, use of lipid-, glucose- or blood pressure-lowering medications or supplements, lactation or pregnancy, diagnosed inflammatory disease, diabetes, CVD, kidney disease, untreated thyroid disease and reported weight loss ≥10 % body weight in the past 6 months.
Composition and nutrient profile of study foods
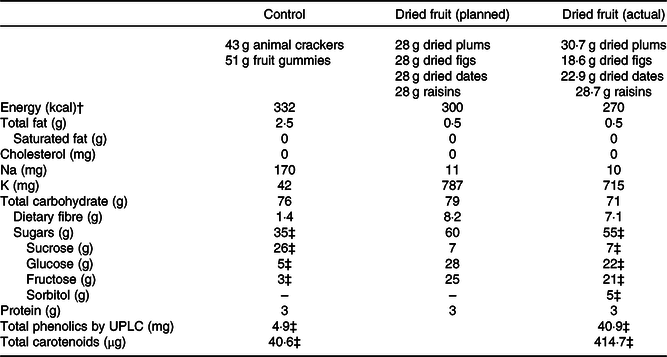
In the dried fruit condition, participants were given individually pre-packaged portions of equal parts dried plums (California Dried Plum Board), Black Mission figs (California Fig Advisory Board), Deglet Noor dates (California Date Commission) and raisins (California Raisin Marketing Board) for each day of the study period. These types were selected because they are commonly consumed unsweetened dried fruits in the USA and globally(33). The daily portion provided was 3/4 cup total (112 g), composed of 28 g of each fruit. Animal crackers (43 g; Stauffer’s) and fruit snack gummies (51 g; Welch’s, The Promotion In Motion Companies, Inc.) were selected as control snacks based on their low fibre and K contents and were portioned to match the energy and carbohydrate content of the fruits. Average daily portions of dried fruits deviated slightly from planned due to variation in the fruit weights. The nutrient profiles of study foods are presented in Table 1. All study foods were stored at room temperature, which is consistent with consumers’ usual storage practices.
Table 1. Nutrient profiles and bioactive contents for daily portions of dried fruits and control snacks*
UPLC, ultra-performance liquid chromatography.
* Nutrient information obtained from FoodData Central(16) and manufacturers of control snacks. Planned nutrient profile for dried fruit calculated based on equal portions of dried fruits (28 g each) totalling 3/4 cup. Actual nutrient profile calculated as 7-d weighted average of pre-packaged fruit portions used in study.
† To convert energy values from kcal to kJ, multiply by 4·184.
‡ Sugar, carotenoid and phenolic profiles of study foods measured by chemical analysis.
Sugar, carotenoid and phenolic contents of study foods were chemically analysed according to previously published methods to verify the study foods had levels comparable with published values. Method details and modifications are described further in Supplementary materials. Sucrose, fructose and glucose were determined by LC with refractive index detection as described by Fall et al.(Reference Fall, Perkins-Veazie and Ma34). Carotenoids were determined by LC with photodiode array detection, according to methods described by Kean et al.(Reference Kean, Hamaker and Ferruzzi35) with minor modification. Detailed phenolic profiles and quantitation of individual phenolic species were accomplished by ultra-performance LC coupled with tandem MS using methods adapted from Li et al.(Reference Li, Koecher and Hansen36) and Shahnazari et al.(Reference Shahnazari, Turner and Iwaniec37). Total phenolic content was also assessed by the modified Folin-Ciocalteu assay as described by Waterhouse(Reference Waterhouse and Wrolstad38), and results expressed as gallic acid equivalents. Carotenoids and phenolic content totals for the dried fruits and control snacks are presented in Table 1. Subtypes are detailed in online Supplementary Tables S1 and S2.
Participants were informed of the energetic value of study foods and were instructed to incorporate the foods into their usual diets, substituting them for other foods they were already consuming. No specific or personalised guidance was provided for which foods to substitute. Participants could consume the study foods whenever and however they preferred as long as the entire portion was consumed daily. In addition, participants were instructed to consume one serving of fresh fruit daily during both conditions; avoid other dried fruits throughout the trial; and otherwise maintain their usual diets and physical activity to support weight maintenance. Compliance with assigned study food consumption was self-reported in weekly written logs. Compliance was quantified as the percentage of days that participants consumed the entire portion of study foods.
Outcome assessment
All data were collected at the Clinical Research Center on two consecutive days at baseline and at the end of each study period. Participants were instructed to fast for 12 h and avoid alcohol and anti-inflammatory medications for 48 h prior to clinic visits. Pre-menopausal women were tested within a week of starting their menstrual period to minimise variability due to hormone fluctuations.
Blood sample collection
Whole blood samples were drawn into serum separator, EDTA-coated and heparin-coated tubes. Serum separator tubes were allowed to clot at room temperature for 30–60 min prior to centrifugation. EDTA- and heparin-coated tubes were immediately centrifuged. Tubes were centrifuged for 15 min, and aliquots of serum and plasma were stored at –80°C until analysis.
Lipids, lipoproteins and PCSK9
Serum lipid and lipoprotein concentrations were measured on two consecutive days at each time point and an average used for data analysis (Quest Diagnostics). Total and HDL-cholesterol and TAG were measured by spectrophotometry. LDL-cholesterol was calculated using the Friedewald equation (in mg/dl: LDL-cholesterol = total cholesterol − HDL-cholesterol − TAG/5)(Reference Friedewald, Levy and Fredrickson39). Concentration, size and particle number of major plasma lipoprotein classes and subclasses were measured on 1 d at each time point by NMR spectroscopy (LabCorp). Serum PCSK9 was assessed in a subset of participants (n 45) by solid-phase sandwich ELISA (Penn State Biomarker Core Lab).
Glucose, insulin and C-reactive protein
Blood samples collected on 1 d at baseline and after each condition were used for analysis of glucose, insulin and high-sensitivity C-reactive protein. Fasting glucose was assessed from heparinised plasma by spectrophotometry (Quest Diagnostics). Serum insulin was assessed by immunoassay (Quest Diagnostics). Insulin resistance was estimated by homeostatic model assessment of insulin resistance (HOMA-IR), calculated using the following formula: fasting plasma glucose (mg/dl) × fasting serum insulin (mU/l)/405(Reference Matthews, Hosker and Rudenski40). Serum high-sensitivity C-reactive protein was measured by immunoturbidimetry (Quest Diagnostics). Values exceeding 10 mg/l were assumed to be acute elevations unrelated to study conditions and were excluded from analysis.
Blood pressure and arterial stiffness assessment
Brachial blood pressure was assessed by a nurse using a manual sphygmomanometer after a 5-min seated rest. Subsequently, a cuff was placed on the upper left arm for central arterial waveform analysis using the SphygmoCor XCEL (AtCor). Participants were then rested in a supine position for assessment of carotid-femoral pulse wave velocity using the SphygmoCor XCEL. An automated cuff placed on the upper right thigh inflated to record femoral pulse, while the right carotid pulse was concurrently recorded by applanation tonometry. For all blood pressure and vascular assessments, three measurements were taken. The second and third measurements were averaged for analysis.
Twenty-four-hour blood pressure
Participants wore an ambulatory blood pressure monitor on the non-dominant arm for a 24-h period at baseline and after each condition (Mortara Instrument Inc.). The monitor was programmed to automatically capture a reading every 20 min during the day and every 30 min overnight. Averages of SBP and DBP readings were computed for the entire period worn as well as separately for readings taken while awake v. during sleep.
Weight
Weight was measured at every clinic visit using a digital scale with participants dressed in light clothing and shoes removed. Weights were averaged over the two clinic visits at each time point for analysis.
Statistical analysis
Statistical analyses were performed using SAS software, version 9.4 (SAS Institute). For all variables, normality of the residuals was assessed using univariate analysis to quantitatively evaluate skewness and to visually inspect the distribution and normal probability (Q–Q) plots. Variables with skewed residuals were transformed for analysis. The linear mixed model procedure (PROC MIXED) was used to test the effect of the conditions on end-of-condition means and changes from baseline for all outcomes. Condition was included in the model as a fixed effect, and subject was a repeated effect. Interactions between condition and sex or condition sequence were tested for all outcomes. There was no indication for different responses by sex or condition sequence, and there was no deviation from results of the primary analysis. Therefore, these were removed from the model. Significance level for all statistical tests was set at P = 0·05. A per-protocol analysis was conducted to evaluate whether condition response differed in participants who reported ≥90 % compliance with assigned conditions; the between-condition results were unchanged. Therefore, results presented are from the intent-to-treat analysis. A sensitivity analysis was conducted to determine whether weight change explained the observed effects. For endpoints where a significant between-condition difference was detected, analyses were repeated after excluding data from participants who lost or gained 2·0 kg or more of body weight in a study period.
A power calculation estimated that fifty subjects were required to detect a 12 mg/dl (0·31 mmol/l) difference in between-condition LDL-cholesterol, assuming a standard deviation of 30 mg/dl (0·78 mmol/l) at a 5 % significance level with 80 % power(Reference Puglisi, Vaishnav and Shrestha28). Anticipating a 10 % dropout rate, we enrolled fifty-five participants.
Results
Participants
Fifty-five participants were enrolled and randomised, and fifty-two completed the trial (Fig. 1). One withdrew at the first baseline appointment and two withdrew during the first condition due to schedule conflicts. Most participants (87 %) had elevated waist circumferences (Table 2). Mean BMI was 28·5 kg/m2, and mean LDL-cholesterol was above optimal (2·94 (sd 0·94) mmol/l) at baseline. Baseline characteristics did not differ by randomisation sequence (data not presented). Self-reported compliance in participants who returned completed compliance forms for all study days was 98·9 % for dried fruit (n 37) and 98·4 % (n 39) for the control. Participants gained weight during both conditions (control 0·4 kg, 95 % CI 0·01, 0·75, P = 0·043; dried fruit 0·3 kg, 95 % CI –0·09, 0·65, P = 0·14) with no between-condition difference in weight change detected (P = 0·55).
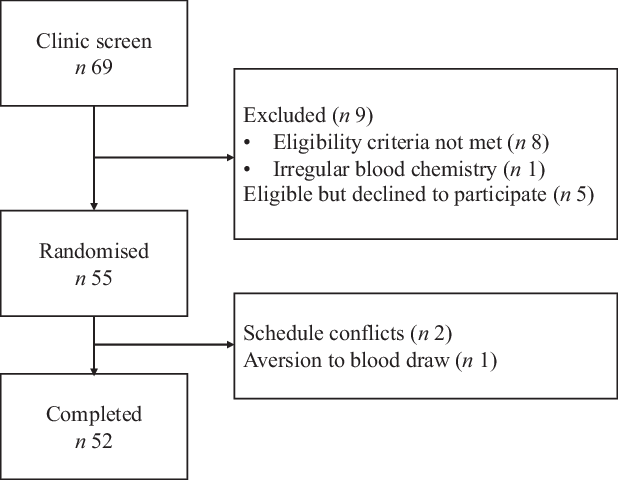
Fig. 1. Consolidated Standards of Reporting Trials 2010 flow diagram.
Table 2. Baseline characteristics of enrolled participants (n 55)
(Mean values and standard deviations; numbers and percentages)
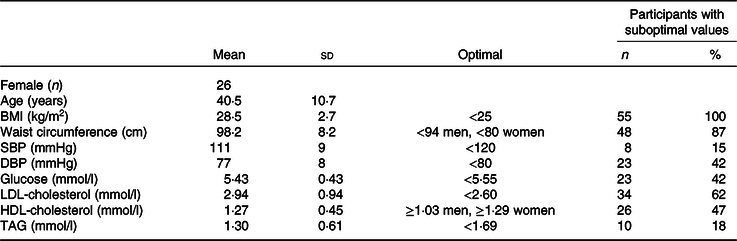
SBP, systolic blood pressure; DBP, diastolic blood pressure.
Lipids, lipoproteins and PCSK9
There were no significant between-condition differences in endpoint-to-endpoint comparison of means or change from baseline for lipid, lipoprotein or PCSK9 concentrations (Table 3). Following the dried fruit condition, LDL-cholesterol (0·10 mmol/l, 95 % CI 0·01, 0·20) and non-HDL-cholesterol (0·12 mmol/l, 95 % CI 0·01, 0·23) increased from baseline, while HDL-cholesterol decreased (–0·05 mmol/l, 95 % CI –0·09, –0·01) (all P < 0·05); no changes in these outcomes were detected following the control condition. The total cholesterol:HDL-cholesterol ratio increased significantly following both conditions (control 0·13, 95 % CI 0·01, 0·26, P = 0·037; dried fruit 0·20, 95 % CI 0·08, 0·33, P = 0·002). LDL particle number increased from baseline after dried fruit (51 nmol/l, 95 % CI 1, 101; P = 0·045); a similar increase after control was not statistically significant (50 nmol/l, 95 % CI 0, 100). Specifically, small LDL particles increased significantly following the control condition (63 nmol/l, 95 % CI 11, 115; P = 0·018), whereas the increase in total particles with dried fruit was composed of both large and small particles. Large HDL particles decreased from baseline following dried fruit consumption (–0·38 µmol/l, 95 % CI –0·74, –0·01; P = 0·045). After exclusion of participants with substantial weight changes (±2·0 kg within condition v. baseline), all within-condition changes from baseline were attenuated to non-significance with the exception of HDL-cholesterol (online Supplementary Table S3).
Table 3. Mean lipid (n 55), lipoprotein (n 52) and proprotein convertase subtilisin/kexin type 9 (PCSK9) (n 45) concentrations for participants at baseline and after dried fruit and control conditions†
(Mean values with their standard errors)
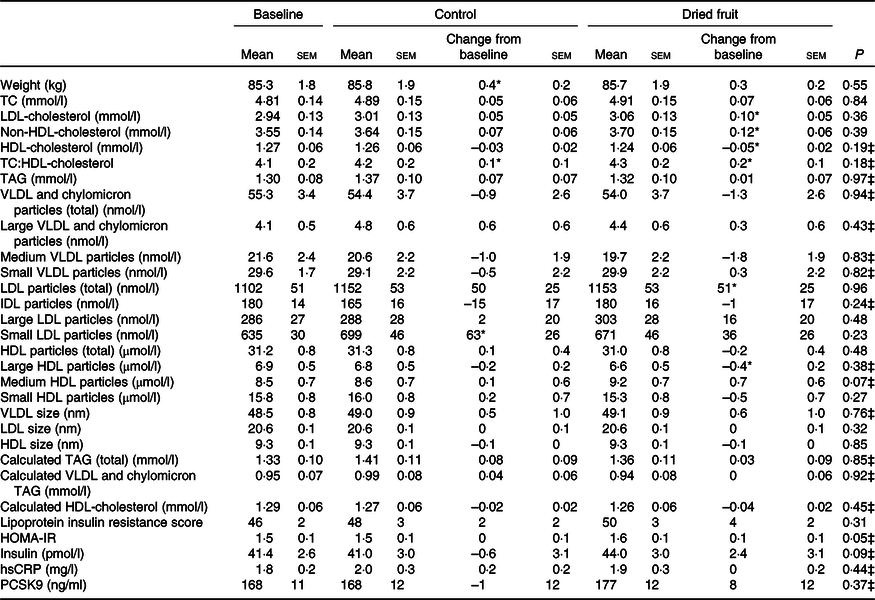
TC, total cholesterol; hsCRP, high-sensitivity C-reactive protein; HOMA-IR, homeostatic model assessment of insulin resistance.
* Significant change from baseline (P < 0·05).
† Baseline values presented as unadjusted mean values with their standard errors. Least squared mean values with their standard errors for end-of-condition means and changes from baseline for control and dried fruit. P value for linear mixed model comparing end-of-condition means.
‡ Transformed means used in linear mixed model for variables with non-normally distributed residuals.
Glucose, insulin and C-reactive protein
Mean fasting glucose was significantly greater following the dried fruit condition v. the control condition (mean difference 0·08 mmol/l, 95 % CI 0·005, 0·16; P = 0·038) (Fig. 2). This difference persisted after exclusion of participants with substantial (±2·0 kg) within-condition weight changes v. baseline. Changes from baseline were not statistically significant for either condition in the intent-to-treat analysis (Table 3). However, the increase in glucose after the dried fruit condition v. baseline was significant in the per-protocol analysis (0·15 mmol/l, 95 % CI 0·01, 0·29; P = 0·038; online Supplementary Table S4) and after exclusions for substantial weight changes (0·12 mmol/l, 95 % CI 0·004, 0·23; P = 0·04; online Supplementary Table S3). The between-condition difference in HOMA-IR approached significance (0·1, 95 % CI –0·3, 0·9; P = 0·054) but was not changed from baseline for either condition. There were no condition effects or changes from baseline for insulin or high-sensitivity C-reactive protein.
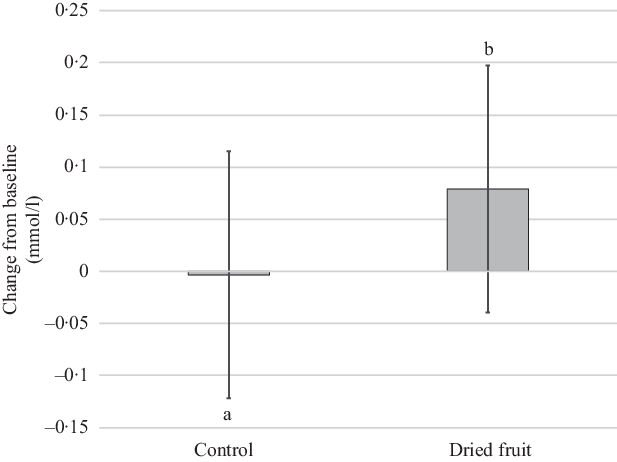
Fig. 2. Changes from baseline for fasting plasma glucose following 4 weeks of consuming dried fruits or the control snacks (n 55). Data are unadjusted mean values and 95 % confidence intervals from linear mixed model comparing changes from baseline. a,b Statistically significant between-treatment effect denoted by unlike letters.
Blood pressure and arterial stiffness
No between-condition differences in endpoint-to-endpoint analysis of means or changes from baseline were detected for blood pressure or measures of central arterial stiffness (Table 4). Brachial diastolic pressure and derived central diastolic pressure assessed by the SphygmoCor increased from baseline on the control condition only (diastolic blood pressure 2·1 mmHg, 95 % CI 0·5, 3·7 mmHg; central diastolic blood pressure 2·0 mmHg, 95 % CI 0·4, 3·6; both P = 0·01). Excluding participants with weight changes of 2·0 kg or greater (n for analysis dried fruit = 45, control = 44) attenuated the central diastolic blood pressure change from baseline to non-significance but diastolic blood pressure remained significantly elevated after the control compared with baseline (2·1 mmHg, 95 % CI 0·5, 3·7; P = 0·01). There were no significant changes in clinician-assessed blood pressures, brachial systolic blood pressure, central systolic blood pressure or any central arterial stiffness measures compared with baseline.
Table 4. Vascular outcome means at baseline and after each condition (n 55)†
(Mean values with their standard errors)

SBP, systolic blood pressure; DBP, diastolic blood pressure.
* Significant change from baseline (P < 0·05).
† Baseline values presented as unadjusted mean values with their standard errors. Least squared mean values with their standard errors for end-of-condition means and changes from baseline for control and dried fruit. P value for linear mixed model comparing end-of-condition means.
Twenty-four-hour blood pressure
An average of fifty blood pressure readings (thirty-seven during waking hours and thirteen while asleep) was recorded per participant. Mean blood pressure combined across sleeping and wake periods did not differ between conditions (Table 4). When sleeping v. awake periods were analysed separately, end-of-condition mean diastolic pressure during waking hours was significantly higher after dried fruit v. control condition (mean difference 0·6 mmHg, 95 % CI 0·02, 1·17; P = 0·04). Changes from baseline for total, waking, and sleeping SBP and DBP were not significant for either condition and did not significantly differ between conditions.
Discussion
This study aimed to assess the effect of consuming mixed dried fruits, within a self-selected diet, on risk factors for cardiometabolic diseases. Contrary to our hypothesis, consuming a ¾ cup portion of mixed dried plums, figs, dates and raisins daily for 4 weeks did not improve LDL-cholesterol, blood pressure or vascular stiffness in overweight/obese subjects at increased risk of cardiometabolic diseases, compared with a carbohydrate-rich control.
Our findings agree with those of Peterson et al.(Reference Peterson, Montgomery and Haddad24), who reported no difference in LDL-cholesterol after adults with above optimal or high LDL-cholesterol (n 88; mean baseline LDL-cholesterol 3·49–3·52 mmol/l) consumed 120 g/d of dried Mission figs v. their usual diet for 5 weeks. In contrast, two previous trials reported lowering of LDL-cholesterol with dried plum consumption. Tinker et al.(Reference Tinker, Schneeman and Davis23) reported significantly lower LDL-cholesterol after hypercholesterolaemic men (n 41; mean baseline LDL-cholesterol 3·89 mmol/l) consumed twelve dried plums (approximately 100 g) daily for 4 weeks compared with an equienergetic daily portion of grape juice (mean difference 0·17 mmol/l, P = 0·02). A numerically small increase from baseline (0·03 mmol/l) was observed with plum consumption but, considering the CI of the estimate, was not statistically significant. Likewise, Clayton et al.(Reference Clayton, Fusco and Schreiber29) reported 0·63 mmol/l lower LDL-cholesterol after normocholesterolaemic overweight and obese adults (mean baseline LDL-cholesterol 2·03–2·04 mmol/l) consumed two 418 kJ (100 kcal) servings (84 g) of dried plums daily for 8 weeks (n 26) v. the control group that consumed energy-matched low-fat muffins (n 23), though changes from baseline were not significant.
The conflicting results in these studies v. ours and that of Peterson et al.(Reference Peterson, Montgomery and Haddad24) are not easily explained. Our trial was comparable in duration and fruit dose to Tinker et al.(Reference Tinker, Schneeman and Davis23), and while elevated LDL-cholesterol was not an essential criterion for enrolment in our study, participants’ mean baseline LDL-cholesterol was classifiable as ‘above optimal’ (≥2·6 mmol/l)(Reference Grundy, Stone and Bailey41) and exceeded that of participants in the study by Clayton et al.(Reference Clayton, Fusco and Schreiber29). Thus, differences in duration or baseline health of participants do not fully explain why LDL-cholesterol was not reduced by dried fruits in our study. It is possible that cholesterol-lowering was effected by higher soluble fibre content in the dried plum interventions compared with ours, as dried plums contain nearly twice as much soluble fibre as raisins and dates(Reference Dreher17). Yet, dried figs are higher in soluble fibre than plums and did not lower cholesterol in the study by Peterson et al.(Reference Peterson, Montgomery and Haddad24). Specific bioactives may be responsible for the cholesterol-lowering effect of dried plums that, as part of a dried fruit mixture, may have been consumed in too small a dose or antagonised by other fruits’ bioactives(Reference Phan, Paterson and Bucknall42).
An important distinction between the trials that report LDL-cholesterol-lowering with dried fruit consumption(Reference Tinker, Schneeman and Davis23,Reference Clayton, Fusco and Schreiber29) v. our trial and that of Peterson et al.(Reference Peterson, Montgomery and Haddad24) is maintenance of energy balance. In the study by Peterson et al.(Reference Peterson, Montgomery and Haddad24), mean energy intake increased by about 837 kJ/d (200 kcal/d) while consuming figs, compared with participants’ usual diets. Similarly, we observed modest weight gain (0·3–0·4 kg) after both conditions suggesting daily overconsumption of approximately 314–439 kJ/d (75–105 kcal/d) (approximately 25–30 % of the study foods’ daily energetic values), though without dietary records, total energy intakes cannot be estimated. Therefore, our results may be explained by increased sugar intake in the setting of excessive energy intake(Reference Chiavaroli, de Souza and Ha43). Short-term overfeeding with simple carbohydrates increases de novo lipogenesis(Reference Sevastianova, Santos and Kotronen44), and fructose-containing sugars may be particularly lipogenic as hepatic fructose uptake is not enzymatically regulated(Reference Samuel45). Within a hyperenergetic diet, perhaps even sugars from dried fruits can increase lipogenesis in individuals with elevated cardiometabolic risk. Accordingly, the within-condition increase in LDL-cholesterol following dried fruit consumption was attenuated by omission of data from participants with substantial weight changes, though this post hoc analysis should be interpreted with caution due to the loss of statistical power with a reduced sample size (n for analysis dried fruit = 45, control = 44). Future investigation into the lipidemic effects of dried fruit under eucaloric and hyperenergetic conditions is required to understand these findings. In addition, comparison with a low-fructose control would further clarify whether energy excess, fructose content or a combination of the two explain the finding.
The K and phenolic compounds in dried fruits were predicted to improve vascular health. However, a 4-week intervention was likely too short to effect structural changes that alter vascular stiffness. Though numerically lower mean DBP was observed after dried fruit consumption, detection of such a small blood pressure-lowering effect would have required hundreds of subjects. Substantial reductions in blood pressure were reported by Anderson et al.(Reference Anderson, Weiter and Christian25) after daily consumption of raisins (85 g) for 12 weeks. Within-condition changes in SBP at 4, 8 and 12 weeks ranged from –5·4 to –8·3 mmHg, all significantly reduced from baseline (P < 0·05). The raisin group had lower DBP at all time points v. the control group consuming processed carbohydrate-rich snacks, with a significant reduction from baseline (–5·5 mmHg) reported at week 12. However, a qualifying enrolment criterion for this previous study was elevated blood pressure. In contrast, more than half of our participants had a normal blood pressure at baseline.
Although this study was not specifically designed to investigate the effects of dried fruit on glycaemic control, the increase in fasting plasma glucose observed after dried fruit consumption, compared with the control snack, is intriguing. This increase persisted in both the sensitivity and per-protocol analyses. Dried fruits have a low to moderate glycaemic index, and the acute glycaemic response to carbohydrate-rich meals is attenuated by replacement of refined starches with dried fruits(Reference Viguiliouk, Jenkins and Blanco Mejia46–Reference Zhu, Fan and Dong50). The lower postprandial glycaemic response is likely due to partial glucose replacement by fructose, which does not contribute substantially to blood glucose and may even stimulate hepatic glucose uptake(Reference Mirtschink, Jang and Arany51). However, the longer-term glycaemic effects of dried fruits have been less investigated. Previous studies did not detect changes in fasting glucose in overweight/obese adults consuming raisins (one cup/d) or dried plums (84 g/d) for 6 and 8 weeks, respectively(Reference Puglisi, Vaishnav and Shrestha28,Reference Clayton, Fusco and Schreiber29) . In a randomised parallel study of overweight/obese adults (n 31), a similar dose of dried fruits to what we provided (85 g raisins) for 12 weeks resulted in a non-significant 0·13 ± 0·11 mmol/l (P = 0·36) increase in fasting glucose from baseline, which did not statistically differ from the mean change observed in the control arm (n 15) consuming processed snacks (0·03 ± 0·03 mmol/l)(Reference Anderson, Weiter and Christian25). However, this difference is directionally and numerically similar to that observed in our crossover study. Thus, it is possible that differences in study design may explain the inconsistent findings. However, this finding requires further investigation, as glycaemic measures were not the primary focus of our trial.
Many of the hypothesised benefits of dried fruits are attributed to the phytochemicals they contain(Reference Ho, Ferruzzi and Wightman52,Reference Arvaniti, Samaras and Gatidou53) . We assessed the phenolic and carotenoid contents of the provided study foods for comparison with published values. The measured carotenoid contents of our fruits were greater than reference values(16). Analysed total phenolic contents were greater for dried plums and raisins and lower for dates than previously reported(Reference Wu, Beecher and Holden54), while reported total phenolics in figs were variably higher(Reference Wu, Beecher and Holden54) or lower(Reference Ouchemoukh, Hachoud and Boudraham55) than ours. Differences in fruit varieties, growing conditions, maturity, drying conditions and analytical methods might contribute to differences in our observed values compared with previous reports. Concentrations of these bioactives were not substantially lower compared with other reports, so it is unlikely that the results of our study are explained by lower bioactive content of the studied dried fruits. However, we did not control how the fruits were consumed (i.e. together v. individually) and, thus, possible antagonism of particular bioactive components by coingestion with the other fruits cannot be excluded(Reference Phan, Paterson and Bucknall42). Furthermore, reported contents represent amounts present in the foods, as consumed, but most phenolic compounds are metabolised by gut bacteria prior to absorption, thereby altering their biological activity(Reference Selma, Espín and Tomás-Barberán56). Thus, physiological responses to these compounds may depend on composition of the gut microbiome. Substantial interindividual variability in plasma concentrations of individual phenolic compound metabolites has been shown(Reference Feliciano, Mills and Istas57,Reference Manach, Williamson and Morand58) . Characterisation of participants’ gut microbial populations may help to explain variation in physiological responses to diet.
To our knowledge, this study is the first to assess a wide range of cardiometabolic disease risk factors in free-living subjects consuming mixed dried fruits with minimal guidance as to how or when to consume the fruits. This pragmatic design allowed participants to incorporate study foods into their diets however they preferred, and therefore these results are informative about the cardiometabolic consequences of recommending increased dried fruit consumption as a strategy to improve fruit intakes. In addition to the 3/4 cup/d portion of dried fruit provided, equivalent to 1·5 cup-equivalents of fruit according to the 2015–2020 Dietary Guidelines for Americans, subjects were instructed to consume one additional fruit serving per d. Thus, total fruit consumption during the dried fruit condition was consistent with recommended fruit intake, and during the control period fruit intake aligned with average US adult intakes(9,59) . While dietary incorporation of dried fruits did assist with meeting recommended fruit intake, the dried fruits were not effectively substituted for other foods in the diet and thereby contributed to weight gain, which may have obscured the expected cardiometabolic benefits. Fully controlling the diet through provision of all foods and beverages could limit the confounding effects of weight changes and other dietary factors and, thereby, determine the efficacy of dried fruits to effect cardiometabolic improvements. However, the health effects observed under these tightly regulated conditions may not readily translate to free-living individuals who incorporate dried fruits into their diets. At minimum, provision of more detailed guidance may be necessary to support maintenance of energy balance in a supplemental dietary trial and may not be unique to dried fruit supplementation(Reference Wibisono, Probst and Neale60).
A major strength of our study was its crossover design, which allows separation of between-person from within-person variability. We utilised functional assessments of cardiometabolic health including lipoprotein subclass analysis, pulse wave analysis, carotid-femoral pulse wave velocity measurement and 24-h blood pressure monitoring, in addition to established measurements of CVD risk including lipid profile and brachial blood pressure. We also analysed the phenolic contents of our study foods to more accurately quantify the actual doses provided to participants. However, our inferences regarding the effects of dried fruits are limited by the absence of dietary assessment before or during the intervention, as we were unable to confirm that an isoenergetic substitution occurred in both periods. We made the assumption that participants altered their usual diets similarly to incorporate dried fruits v. the control snacks. Without dietary records, we cannot confirm that background dietary intake was consistent in both periods and cannot determine if, or how, energy content from participants’ usual diets were compensated when study foods were consumed. Unmeasured changes in intake of other foods and nutrients, accompanying either the control or dried fruit conditions, may explain the lack of observed cardiometabolic benefits with dried fruit consumption compared with the control. However, with the current diet assessment methods available, we would likely lack the sensitivity to completely understand dietary alterations that occurred in response to the daily consumption of dried fruits. In addition, due to natural variations in the consumer-grade dried fruits, we provided less fruit than planned (approximately 101 v. 112 g), which may have resulted in underestimation of the effects we observed. We did not adjust P values for multiple comparisons, thus the inflation of type I error rate could be responsible for our significant findings. However, we suggest that the observed changes are consistent with metabolic responses to overconsumption of sugars. Finally, given the broad eligibility criteria, participants varied substantially in baseline health status and mean values for most risk factors were within acceptable limits. Individuals with normal baseline values had little room for improvement, and the absence of changes in these healthier participants may have attenuated improvements in higher-risk participants.
In summary, short-term consumption of 3/4 cup/d of mixed dried plums, figs, dates and raisins within a self-selected diet did not improve risk factors for cardiometabolic disease compared with non-fruit, carbohydrate-rich snacks in adults with increased risk for cardiometabolic diseases. Further research is needed to determine what, if any, dietary guidance regarding portion or pattern of consumption (e.g. with meals) is warranted to support healthful dried fruit consumption. Maintenance of energy balance should be ensured in future studies investigating the efficacy of routine dried fruit consumption to improve health.
Acknowledgements
We thank Dr Mario Ferruzzi, Dr Min Li, and laboratory members at the Plants for Human Health Institute (North Carolina State University, Kannapolis, NC, USA) for conducting the chemical analyses of study foods and providing guidance in reporting methods and results for these analyses. We also thank Metabolic Diet Study Center Manager, Marcella Smith, and research staff nurses Cyndi Flanagan, Christa Oelhaf and Filomena Martin for their assistance with this study.
This study was funded by the INC International Nut and Dried Fruit Council, the California Dried Plum Board, the California Date Commission, the California Fig Advisory Board and the California Raisin Marketing Board. These funders contributed to the study design, and dried fruits were donated by the California Dried Plum Board, the California Date Commission, the California Fig Advisory Board and the California Raisin Marketing Board. This study was also supported by the John A. Milner Graduate Student Endowment in Nutritional Sciences at Penn State and by the National Center for Advancing Translational Sciences, National Institutes of Health through grant UL1 TR002014. This content is solely the responsibility of the authors and does not necessarily represent the official views of the NIH.
The authors’ responsibilities were as follows: P. M. K.-E. designed the research; V. K. S. conducted the research; V. K. S. and K. S. P. analysed the data; V. K. S. and K. S. P. authored the manuscript and P. M. K.-E. had primary responsibility for final content. All authors have read and approved the final manuscript.
The authors declare that there are no conflicts of interest.
Supplementary material
For supplementary material referred to in this article, please visit https://doi.org/10.1017/S0007114520002007


