


INTRODUCTION
The prevalence of low-density cholesterol (LDL-C) ≥ 3.4 mmol/L declined from 42.9% in 1999–2000 to 29.4% in 2015–2016 among US adults, paralleling observed increases in the use of lipid-lowering medications (Ford & Capewell, Reference Ford and Capewell2013; Virani et al., Reference Virani, Alonso, Benjamin, Bittencourt, Callaway and Carson2020). In the Cholesterol Treatment Trialists’ Collaboration, the risk of a major vascular event was 21% lower per 1 mmol/L reduction in LDL-C with statin use (Cholesterol Treatment Trialists et al., Reference Cholesterol Treatment Trialists, Mihaylova, Emberson, Blackwell, Keech, Simes and Baigent2012). Although the cardiovascular benefits of LDL-C lowering are well recognized, there were initial concerns raised regarding the potential for adverse cognitive effects associated with lowering LDL-C with lipid-lowering therapies. Findings from animal models suggested that statins altered the composition of brain lipids (Vecka et al., Reference Vecka, Tvrzicka, Stankova, Novak, Novakova and Zak2004) and there were early reports of adverse events related to memory and cognition in postmarket surveillance (“FDA Drug Safety Communication: important safety label changes to cholesterol-lowering statin drugs,” 2012). With findings from randomized clinical trials showing no difference in cognitive decline for those who received a statin to lower LDL-C compared with those who received a placebo, the current evidence suggests that statin use is not associated with cognition (Heart Protection Study Collaborative, 2002; Newman et al., Reference Newman, Preiss, Tobert, Jacobson, Page, Goldstein and Stroke2019; Shepherd et al., Reference Shepherd, Blauw, Murphy, Bollen, Buckley and Cobbe2002). However, randomized trials provide limited information on the association of long-term LDL-C levels with cognition as they typically provide only a few years of follow-up. Findings from observational studies that have investigated the association of LDL-C with or without lipid-lowering therapy and cognition have been mixed, but these studies have typically relied on a single measure of LDL-C at baseline (Benn, Nordestgaard, Frikke-Schmidt, & Tybjaerg-Hansen, Reference Benn, Nordestgaard, Frikke-Schmidt and Tybjaerg-Hansen2017; Lamar et al., Reference Lamar, Durazo-Arvizu, Rodriguez, Kaplan, Perera, Cai and Daviglus2019; Mefford et al., Reference Mefford, Rosenson, Cushman, Farkouh, McClure, Wadley and Levitan2018; Reitz, Tang, Luchsinger, & Mayeux, Reference Reitz, Tang, Luchsinger and Mayeux2004; Shepardson, Shankar, & Selkoe, Reference Shepardson, Shankar and Selkoe2011; West et al., Reference West, Beeri, Schmeidler, Hannigan, Angelo, Grossman and Silverman2008). It is unclear whether long-term changes or therapeutic reductions in LDL-C over decades may affect cognitive function.
Few studies have examined the association of long-term levels of LDL-C during young adulthood with cognition in middle age. As cognitive decline often develops over an extended period of time (Jack et al., Reference Jack, Knopman, Jagust, Shaw, Aisen, Weiner and Trojanowski2010) and LDL-C levels attained may vary over time, we investigated the association of time-averaged LDL-C over 25 years with cognitive function (primary analysis) and with brain tissue and perfusion measures (secondary analysis) in the Coronary Artery Risk Development in Young Adults (CARDIA) study. Given potential associations with LDL-C and cognition, we also examined potential effect modification by statin use ("FDA Drug Safety Communication: important safety label changes to cholesterol-lowering statin drugs," 2012; Stroes, Reference Stroes2005), PCSK9 loss-of-function (LOF) variants (Robinson et al., Reference Robinson, Farnier, Krempf, Bergeron, Luc and Averna2015; Sabatine et al., Reference Sabatine, Giugliano, Wiviott, Raal, Blom and Robinson2015; Swiger & Martin, Reference Swiger and Martin2015) and Apolipoprotein E (ApoE) phenotypes (Alfred et al., Reference Alfred, Ben-Shlomo, Cooper, Hardy, Cooper and Deary2014; Bennet et al., Reference Bennet, Di Angelantonio, Ye, Wensley, Dahlin, Ahlbom and Danesh2007; Zhao et al., Reference Zhao, Brunner, Kumari, Singh-Manoux, Hawe, Talmud and Humphries2005).
METHODS
Study Population
CARDIA is a multicenter prospective study of CVD risk factors among 5,115 adults aged 18–30 years when recruited at baseline in 1985–1986. Participants were recruited at four field centers (Birmingham, AL, Chicago, IL, Minneapolis, MN, and from members of the Kaiser Permanente Medical Care Plan in Oakland, CA). Participants were recruited with equal proportions with respect to age (18–24 years, 25–30 years), race (white, black), sex, and education (≤12 years, >12 years) at baseline. Follow-up examinations used in the current analysis occurred at 2, 5, 7, 10, 15, 20, and 25 years after baseline. Retention rates have been high (72% of the surviving cohort attended the Year 25 exam).
For this analysis, we excluded participants who did not attend or died prior to the Year 25 examination (n = 1,617), those who attended the Year 25 exam but had <3 LDL-C measures (n = 31), and those who were missing all cognitive function assessments (n = 139) for a final analytic sample of 3,328. Baseline characteristics of participants included and excluded in our analysis are presented in Supplemental Table 1. The primary outcomes were cognitive function measures as assessed by the Digit Symbol Substitution Test (DSST; N = 3,321), the Rey Auditory Verbal Learning Test (RAVLT; N = 3,322), and the Stroop Test (N = 3,320). A sub-study at the Year 25 examination evaluated brain structural and functional measures using magnetic resonance imaging (MRI). The secondary outcomes from the MRI sub-study included white matter abnormal tissue volume (AWMV; N = 696) and gray matter cerebral blood flow volume (GM-CBFV; N = 539).
Data Collection
Standardized protocols were used for data collection and quality assurance in the CARDIA study (https://www.cardia.dopm.uab.edu/), and all covariates included in the current analysis were collected at the Year 25 examination unless noted otherwise. Education (≥12 years, <12 years), current smoking (current, former, and never), history of illicit drug use, and alcohol use were self-reported. Alcohol use was categorized as never, moderate (men/women: >0–14/>0–7 drinks per week), or heavy (men/women: >14/>7 drinks per week). Participation in moderate or vigorous-intensity activities during the prior year was assessed by self-report and calculated as a study-specific measure of exercise units based on the frequency and types of activity using a validated algorithm, with higher scores indicating higher activity levels (Jacobs, Hahn, Haskell, Pirie, & Sidney, Reference Jacobs, Hahn, Haskell, Pirie and Sidney1989; Parker, Schmitz, Jacobs, Dengel, & Schreiner, Reference Parker, Schmitz, Jacobs, Dengel and Schreiner2007).
The Center for Epidemiological Studies Depression Scale was administered and participants with a score of ≥16 were categorized as having depressive symptoms (Radloff, Reference Radloff1977). Body mass index (BMI) was calculated based on objectively measured height and weight with participants wearing light clothing and no shoes. Systolic blood pressure (SBP) and diastolic blood pressure (DBP) were measured three times using an arm automated blood pressure monitor (Omron HEM-907XL) following a 5 min rest in the seated position, with the last two measurements used to calculate mean SBP and DBP. Statin, non-statin lipid-lowering, antihypertensive, glucose-lowering, and antidepressant medication use was determined by self-report and through a medication inventory during each study examination. Serum creatinine measures were used to calculate the estimated glomerular filtration rate (eGFR) with the Chronic Kidney Disease Epidemiology Collaboration equation with reduced eGFR defined by a level of <60 ml/min/1.73 m2 (Levey et al., Reference Levey, Stevens, Schmid, Zhang, Castro and Feldman2009). Diabetes was defined as fasting blood glucose ≥126 mg/dL, 2-hr post-challenge glucose from an oral glucose tolerance test ≥200 mg/dL, hemoglobin A1c ≥6.5%, or use of glucose-lowering medications, and includes those with type 1 and type 2 diabetes. History of coronary heart disease (CHD) and history of stroke/transient ischemic attack (TIA) were determined by medical record review and physician adjudication of events prior to the Year 25 exam. ApoE phenotypes (2/2, 3/2, 3/3, 4/2, 4/3, and 4/4) were measured using blood samples collected at the Year 7 examination using previously defined methods (Kataoka, Paidi, & Howard, Reference Kataoka, Paidi and Howard1994), and categorized as E2, E3, and E4. PCSK9 LOF variants C679X, R46L, and Y142X were genotyped (Fornage & Doris, Reference Fornage and Doris2005) using specimens collected at the Year 20 examination, and carriers were defined as having at least one of these variants.
Time Averaged LDL-C
Blood samples were drawn at each CARDIA examination, processed and stored at −70°C until they were analyzed at the Northwest Lipid Research Lab, University of Washington. Total and high-density cholesterol and triglycerides were measured, and LDL-C was calculated at each examination using the Friedewald equation for those with fasting triglycerides <400 mg/dL. The test–retest correlation was 0.98–0.99 for all lipid measures (Gross et al., Reference Gross, Steffes, Jacobs, Yu, Lewis, Lewis and Loria2005). Time-averaged LDL-C levels were estimated for participants with LDL-C measurements at ≥3 CARDIA study visits, and approximately 90% of participants had 5 or more LDL-C measurements available. Lipid-lowering medication use was not incorporated into the development of time-averaged LDL-C, consistent with prior studies examining other lipids.
Linear mixed models were used to estimate trajectories of LDL-C for each participant, as described previously (Pletcher et al., Reference Pletcher, Bibbins-Domingo, Liu, Sidney, Lin, Vittinghoff and Hulley2010). Briefly, group mean trajectories were modeled for each race-sex group. It was assumed that trajectories of LDL-C for each participant had a constant slope within each decade (e.g., 20–29, 30–39) and a random intercept. Individual trajectories were then estimated based on group-level mean trajectories and conditional expectations from random effects. Next, the area under the curve was calculated for each participant’s LDL-C trajectory. Time-averaged LDL-C was then calculated by dividing the area under the curve by a participant’s total follow-up time from baseline to their last available LDL-C measurement. Time-averaged LDL-C was categorized as <100 mg/dL, 100–129 mg/dL, 130–159 mg/dL, ≥160 mg/dL (Pletcher et al., Reference Pletcher, Bibbins-Domingo, Liu, Sidney, Lin, Vittinghoff and Hulley2010).
Neurocognitive Function Assessment
A battery of three standardized tests to measure cognitive function was administered at the Year 25 examination. Repeat measures of cognitive function were not available for this analysis. However, a random review of 5–10% of cognitive test administration booklets and interview materials was performed for quality assurance. The DSST, a subtest of the Wechsler Adult Intelligence Scale (third edition), assesses an array of cognitive abilities, most prominently visual-motor speed, sustained attention, and working memory (Wechsler, Reference Wechsler1997). The range of scores is 0–133, with higher scores indicating better performance. The RAVLT assesses the ability to memorize and to retrieve words (verbal memory) after several presentations of the word list immediately one after another, and then after a delay of 10 min (Schmidt, Reference Schmidt1996). The range of scores on the delayed test is 0–15, with higher scores indicating better performance. The Stroop Test includes three subtests that evaluate the ability to view complex visual stimuli and to respond to one stimulus dimension while suppressing the response to the other dimensions (Stroop, Reference Stroop1935). Each subtest is scored by summing the number of errors and the time required for completion. An interference score is calculated by subtracting the score on the incongruent subtest from the congruent subtest. For the Stroop Test, interference scores can be negative or positive and a higher interference score indicates worse performance on the task. For ease of interpretation and comparability across cognitive function measures, all cognitive test scores were transformed into standardized z scores (mean = 0, standard deviation = 1). For the DSST and RAVLT, positive values indicate better performance and negative values indicate worse performance. For the Stroop Test, positive values indicate worse performance and negative values indicate better performance.
Brain Measures
Brain MRI was performed in a subsample of participants at Year 25 (Launer et al., Reference Launer, Lewis, Schreiner, Sidney, Battapady, Jacobs and Bryan2015) and was used to assess AWMV (Gunning-Dixon & Raz, Reference Gunning-Dixon and Raz2000) and GM-CBFV (Appelman, van der Graaf, Vincken, Mali, & Geerlings, Reference Appelman, van der Graaf, Vincken, Mali and Geerlings2010; Moser et al., Reference Moser, Boles Ponto, Miller, Schultz, Menda, Arndt and Nopoulos2012) which have been linked to subtle deficits in cognitive function. Participants enrolled in the sub-study were balanced with respect to race and sex and excluded those with a contraindication to MRI or with a body size too large for the MRI tube bore. Brain MRI was acquired on 3-T MR scanners located proximal to three CARDIA clinic sites (California: Siemens 3T Tim Trio/VB 15 platform; Minnesota: Siemens 3T Tim Trio/VB 15 platform and Birmingham: Philips 3T Achieva/2.6.3.6 platform). The MRI Reading Center, located at the University of Pennsylvania, worked in collaboration with the MRI field centers to train technologists to follow standardized protocols, and transfer MRI data to a central archive located at the Reading Center. To evaluate scanner stability and image distortion prior to site acceptance and quarterly thereafter, each MRI field center followed standard quality assurance protocols developed for the Functional Bioinformatics Research Network, and the Alzheimer’s disease (AD) Neuroimaging Initiative. Using scans from three persons measured three times at each field center, the technical error of measurement was 27.8% for AWMV and 7.3% for GM-CBFV (Launer et al., Reference Launer, Lewis, Schreiner, Sidney, Battapady, Jacobs and Bryan2015). AWMV was analyzed as the proportion above/below the 85th percentile of the observed distribution, with the top 15% indicative of high AWMV, and the bottom 85% designated low AWMV, consistent with a previous CARDIA analysis on white matter tissue volume (Zhu et al., Reference Zhu, Jacobs, Schreiner, Launer, Whitmer, Sidney and Bryan2015). GM-CBFV was analyzed as the proportion above/below the 15th percentile of the observed distribution, with the bottom 15% indicative of decreased GM-CBFV, and the top 85% indicative of non-decreased GM-CBFV, also consistent with the previous CARDIA analysis (Zhu et al., Reference Zhu, Jacobs, Schreiner, Launer, Whitmer, Sidney and Bryan2015).
Statistical Analysis
Participant characteristics were calculated by the level of time-averaged LDL-C categories. A statistical test for trend across increasing levels of time-averaged LDL-C was calculated for each covariate by modeling LDL-C category as an ordinal variable and examining the association between LDL-C and each covariate, separately. The mean level of LDL-C and the percentage of participants taking a statin and other lipid-lowering medications, separately, was calculated for each study exam (at baseline and 2, 5, 7, 10, 15, 20, and 25 years following baseline) across levels of time-averaged LDL-C. Mean and standardized mean cognitive function scores were calculated for participants by level of time-averaged LDL-C. Using a generalized linear model, we estimated crude and adjusted mean differences in standardized cognitive function scores (DSST, RAVLT, and Stroop Test, separately) for participants with higher time-averaged LDL-C versus the lowest category (LDL-C < 100 mg/dL). Model 1 included adjustment for age, race, sex, and education. Model 2 included adjustment for covariates in Model 1 and BMI, diabetes, smoking, alcohol use, physical activity, SBP and DBP, use of antihypertensive medications, reduced eGFR, depressive symptoms, history of illicit drug use, and history of CHD and stroke/TIA. Model 3 included adjustment for covariates in Model 2 and statin, other lipid-lowering medication, and antidepressant medication use. Model covariates were chosen a priori based on previous studies examining the association between LDL-C and cognition, as well as clinical judgment (Gencer et al., Reference Gencer, Mach, Guo, Im, Ruzza, Wang and Investigators2020; Lamar et al., Reference Lamar, Durazo-Arvizu, Rodriguez, Kaplan, Perera, Cai and Daviglus2019; Yaffe et al., Reference Yaffe, Vittinghoff, Pletcher, Hoang, Launer, Whitmer and Sidney2014). Tests for linear trend across LDL-C categories were calculated by modeling the LDL-C category as an ordinal variable.
To test for effect modification, in fully adjusted models we included statin use as a main effect and an interaction term between LDL-C and statin use. We repeated this step to test for effect modification by (1) PCSK9 LOF variants and (2) apoE phenotypes. Finally, we examined associations of time-averaged LDL-C categories with high AWMV and low GM-CBFV, separately, using Poisson regression with robust error variance to obtain prevalence ratios in models with progressive adjustment as described above.
Missing data were minimal for all covariates (Supplemental Table 2), and a complete case analysis was used. For models with interaction terms for PCSK9 variants and apoE phenotypes, a complete case analysis was also used which resulted in more exclusions because more participants were missing data for those variables. In a sensitivity analysis, ApoE phenotype was included as a covariate in fully adjusted models for each cognitive function test. A separate sensitivity analysis calculated LDL-C using the Martin–Hopkins method which has been shown to have greater concordance with direct measurement than the Friedewald equation (Martin et al., Reference Martin, Blaha, Elshazly, Toth, Kwiterovich, Blumenthal and Jones2013). Analyses were repeated to obtain mean and standardized mean cognitive function scores across levels of time-averaged LDL-C using the Martin–Hopkins method. Two-sided p-values of <0.05 were considered statistically significant. Analyses were performed using SAS 9.4 (SAS Institute, Cary, NC).
Standard Protocol Approvals, Registrations, and Patient Consents
The Institutional Review Boards for the protection of human subjects at all study sites provided approval for all aspects of the CARDIA study and written informed consent was obtained from all participants at each study visit.
Data Availability
CARDIA study datasets may be requested from the NHLBI Biologic Specimen and Data Repository Information Coordinating Center (BioLINCC) at https://biolincc.nhlbi.nih.gov/home/. These are available by application through the BioLINCC website and are subject to established review processes for their distribution to investigators.
RESULTS
Overall, 15.6%, 32.9%, 28.9%, and 22.6% of participants had time-averaged cumulative LDL-C <100 mg/dL, 101–129 mg/dL, 130–159 mg/dL, and ≥160 mg/dL, respectively (Table 1). Participants with higher versus lower time-averaged LDL-C were older, less likely to be female, less likely to be black, and more likely to have ≥12 years of education. Additionally, participants with higher versus lower time-averaged LDL-C were more likely to have a history of illicit drug use, diabetes, CHD, stroke/TIA, higher mean SBP and DBP, and to be taking antihypertensive medication, a statin, and other lipid-lowering medications at the Year 25 exam (all p-trend < 0.05). Participants with higher versus lower time-averaged LDL-C were less likely to be carriers of PCSK9 LOF variants and have ApoE2 phenotype but were more likely to have ApoE4 phenotype (all p-trends <0.001). Mean LDL-C and the percentage of participants taking a statin or other lipid-lowering medication at each exam are listed by time-averaged LDL-C category in Supplemental Table 3.
Table 1. Characteristics of participants at the Year 25 Exam by category of time-averaged low-density lipoprotein-cholesterol

Abbreviations: BMI, body mass index; CES-D, Centers for Epidemiological Studies Depression Scale; CHD, coronary heart disease; DBP, diastolic blood pressure; eGFR, estimated glomerular filtration rate; HDL-C, high-density lipoprotein-cholesterol; LDL-C, low-density lipoprotein-cholesterol; LOF, loss-of-function; PCSK9, proprotein convertase subtilisin/kexin type 9; SD, standard deviation; SBP, systolic blood pressure; TIA, transient ischemic attack.
Numbers in table are n (%) unless noted otherwise.
* History of CHD and History of Stroke/TIA determined by adjudicated events prior to Year 25 examination.
† Obtained at Year 20 follow-up (2005–2006).
‡ Obtained at Year 7 follow-up (1992–1993).
Mean and standardized mean cognitive function scores indicated worse performance among participants with higher versus lower time-averaged LDL-C on the DSST (p-trend<0.001), RAVLT (p-trend = 0.002), and the Stroop Test (p-trend = 0.01) (Table 2, Central Illustration). There were no differences in DSST or Stroop Test scores (p-trend = 0.69 and 0.30, respectively) comparing participants with higher versus lower time-averaged LDL-C after multivariable adjustment (Table 3). Participants with higher time-averaged LDL-C had a lower RAVLT score (p-trend = 0.02). In a sensitivity analyses with additional adjustment for statin use at exam years 15 and 20 and, separately, for ApoE phenotypes, results were similar for the DSST, RAVLT, and Stroop Test (data not shown).
Table 2. Mean and standardized mean cognitive function scores by time-averaged LDL-C category using a generalized linear model
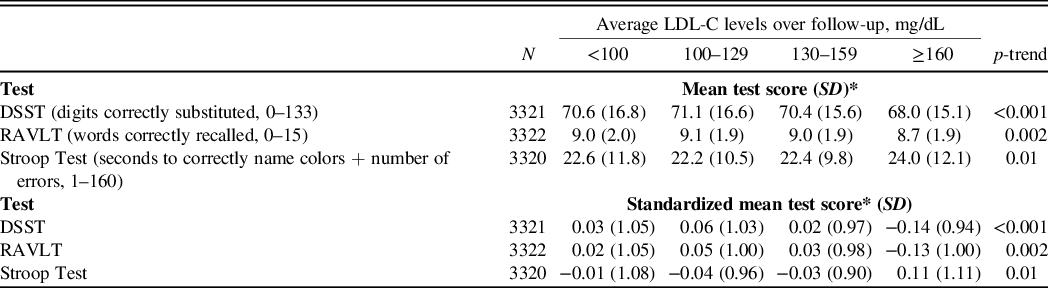
Abbreviations: DSST, Digit Symbol Substitution Test; LDL-C, low-density lipoprotein-cholesterol; RAVLT, Rey Auditory Verbal Learning Test; SD, standard deviation.
*Lower mean and standardized mean scores indicate worse performance on the DSST and RAVLT tests, but better performance on the Stroop Test.
Table 3. Mean differences in standardized cognitive function scores* (95% confidence intervals) associated with time-averaged LDL-C category using a generalized linear model

Abbreviations: DSST, Digit Symbol Substitution Test; LDL, low-density lipoprotein-cholesterol; RAVLT, Rey Auditory Verbal Learning Test.
Model 1 adjusts for age, race, sex, and education.
Model 2 adjusts for Model 1 covariates plus body mass index, diabetes, smoking status, alcohol use, physical activity, systolic and diastolic blood pressure and use of antihypertensive medications, estimated glomerular filtration rate, depressive symptoms, history of illicit drug use, history of coronary heart disease, and history of stroke/transient ischemic attack.
Model 3 adjusts for Model 2 covariates plus statin use, other lipid-lowering medication use, and antidepressant medication use.
* Lower standardized mean scores indicate worse performance on the DSST and RAVLT tests, but better performance on the Stroop Test.
† Calculated using an interaction term between LDL-C category (ordinal) and each variable, separately.
Results were consistent among participants taking and not taking statins, as well as those with and without PCSK9 LOF variants (data not shown; all p-interaction > 0.10 for DSST, RAVLT, and Stroop Test). Additionally, there was no effect modification by ApoE phenotypes for the association of time-averaged LDL-C and the three cognitive function scores (Supplemental Table 4, p-interaction = 0.57, 0.09 and 0.63 for DSST, RAVLT, and Stroop Test, respectively). No differences in cognitive function test scores were present across LDL-C categories for participants with ApoE2 or ApoE3 phenotype. However, for participants with ApoE4 phenotype, participants with higher versus lower time-averaged LDL-C had higher DSST scores (p-trend = 0.03).
Characteristics of participants included and not included in the MRI analysis are listed in Supplemental Tables 5 and 6. Compared to those excluded, those included were similar in age but had higher proportions of men and white participants across LDL-C categories. Among those included in the analysis, the prevalence of high AWMV was 9.3%, 17.3%, 14.8%, and 13.5% for those with time-averaged cumulative LDL-C <100 mg/dL, 100–129 mg/dL, 130–159 mg/dL, and ≥160 mg/dL, respectively. The prevalence of decreased GM-CBFV was 9.0%, 6.7%, 14.5%, and 16.2% for those with time-averaged cumulative LDL-C <100 mg/dL, 100–129 mg/dL, 130–159 mg/dL, and ≥160 mg/dL, respectively. There was no evidence of trends for high AWMV or low GM-CBFV across levels of time-averaged LDL-C after multivariable adjustment (Table 4).
Table 4. Prevalence ratios and 95% confidence intervals for high abnormal white matter tissue volume and low gray matter cerebral blood flow volume associated with time-averaged LDL-C category

Abbreviations: GM-CBFV, gray matter cerebral blood flow volume; LDL-C, low-density lipoprotein-cholesterol; MRI, magnetic resonance imaging; AWMV, abnormal white matter volume.
Model 1 adjusts for age, race, sex, and education.
Model 2 adjusts for Model 1 covariates plus body mass index, diabetes, smoking status, alcohol use, physical activity, systolic and diastolic blood pressure and use of antihypertensive medications, estimated glomerular filtration rate, depressive symptoms, history of illicit drug use, history of coronary heart disease, and history of stroke/transient ischemic attack.
Model 3 adjusts for Model 2 covariates plus statin use, other lipid-lowering medication use, and antidepressant medication use.
A cross-tabulation of participants categorized into time-averaged LDL-C categories using both the Friedewald and Martin–Hopkins equations is presented in Supplemental Table 7. Using time-averaged LDL-C calculated using the Martin–Hopkins equation, mean and standardized mean cognitive function scores indicated worse performance among participants with higher versus lower time-averaged LDL-C on the DSST (p-trend < 0.001), RAVLT (p-trend < 0.001), and the Stroop Test (p-trend = 0.01) (Supplemental Table 8). In addition, participants with higher time-averaged LDL-C had a lower RAVLT score after multivariable adjustment (p-trend = 0.002) (Supplemental Table 9).
DISCUSSION
In this retrospective analysis of a prospective cohort of young black and white US adults followed through middle age, mean differences in cognitive function test scores across time-averaged cumulative LDL-C categories were small. In unadjusted analysis, adults with higher versus lower time-averaged LDL-C had worse performance on the DSST, RAVLT, and Stroop Test. However, after multivariable adjustment, higher time-averaged LDL-C was associated with lower RAVLT scores only. For brain tissue and perfusion, time-averaged LDL-C was not associated with high AWMV or decreased GM-CBFV.
In the current study, after adjustment for potential confounders, standardized differences in cognitive function test scores ranged from 0.16 SD lower to 0.09 SD higher across time-averaged LDL-C categories in comparison to those with LDL-C <100 mg/dL. Higher time-averaged LDL-C was associated with lower RAVLT scores. The RAVLT focuses on the ability to memorize and retrieve words (verbal memory), including delayed recall. Previous evidence from biological studies of lipid dysregulation in AD suggests memory impairment is a strong indicator and early sign of AD (Bjorkhem, Cedazo-Minguez, Leoni, & Meaney, Reference Bjorkhem, Cedazo-Minguez, Leoni and Meaney2009; Kunkle et al., Reference Kunkle, Grenier-Boley, Sims, Bis, Damotte, Naj and Pericak-Vance2019; Reitz, Reference Reitz2013). Additionally, findings from the Northern Manhattan Study showed that higher LDL-C increased the risk for incident vascular dementia (Reitz et al., Reference Reitz, Tang, Luchsinger and Mayeux2004). In a study of HIV-infected men taking antiretroviral therapy, higher levels of LDL-C were associated with greater cognitive decline assessed by a cognitive summary score including the RAVLT (Mukerji et al., Reference Mukerji, Locascio, Misra, Lorenz, Holman, Dutta and Gabuzda2016). In contrast, a positive association between LDL-C levels and cognitive measures of learning and verbal fluency was reported in a cross-sectional analysis of the Hispanic Community Health Study/Study of Latinos (2008–2011) (Lamar et al., Reference Lamar, Durazo-Arvizu, Rodriguez, Kaplan, Perera, Cai and Daviglus2019). The overall evidence is conflicting about the relationship between serum lipids and brain lipids, and how these two are interconnected with cognition. Despite dietary cholesterol not crossing the blood–brain barrier, increases in cholesterol can lead to the formation of cholesterol metabolites, pro-inflammatory mediators, and antioxidant processes, that signal the brain and impact cognition (Schreurs, Reference Schreurs2010). Although it is difficult to posit a definitive mechanism of action, research in animals and humans has shown that cholesterol levels are related to memory and disturbances to cholesterol can result in a range of effects on cognition (Schreurs, Reference Schreurs2010). Differences between the current study and previous observational studies include the frequency and timing of LDL-C measures, the age of the participants included, cognitive function tests utilized, and cognitive abilities examined, which may partially explain the variability in findings. An important next step is to delineate specific aspects of memory that may be influenced by long-term lipid levels versus other markers of health and aging. Additionally, future studies should investigate whether LDL particle size and LDL-C/LDL particle concentration discordance may contribute to mixed findings for lipids with cognition.
Past randomized trials have investigated the effects of pharmacologic therapies that lower LDL-C (i.e., statins and PCSK9 inhibitors) on cognition (Giugliano et al., Reference Giugliano, Mach, Zavitz, Kurtz, Im and Kanevsky2017; Robinson et al., Reference Robinson, Rosenson, Farnier, Chaudhari, Sasiela, Merlet and Kastelein2017; Shepherd et al., Reference Shepherd, Blauw, Murphy, Bollen, Buckley and Cobbe2002). Findings in the current study are consistent with randomized trial data, where there was no evidence of differences in cognitive impairment across high or low levels of LDL-C among participants taking and not taking statins. In addition, in the current study, there was no association between LDL-C levels and cognition among participants with or without PCSK9 LOF variants. This is consistent with a retrospective analysis of the REasons for Geographic And Racial Differences in Stroke (REGARDS) study, where PCSK9 LOF variants and resulting low levels of LDL-C, were not associated with impairment measured by a battery of validated cognitive assessments (Mefford et al., Reference Mefford, Rosenson, Cushman, Farkouh, McClure, Wadley and Levitan2018). Among participants in the current study with apoE4 phenotype, those with higher versus lower LDL-C had a better DSST score, however these differences were small. Given the evidence that apoE4 influences LDL-C levels (Bennet et al., Reference Bennet, Di Angelantonio, Ye, Wensley, Dahlin, Ahlbom and Danesh2007), cognition in middle age (Zhao et al., Reference Zhao, Brunner, Kumari, Singh-Manoux, Hawe, Talmud and Humphries2005), and may result in greater cognitive decline later in life (Schiepers et al., Reference Schiepers, Harris, Gow, Pattie, Brett, Starr and Deary2012), this may require further investigation.
High levels of LDL-C that are still within the range considered normal can result in endothelial dysfunction (Steinberg et al., Reference Steinberg, Bayazeed, Hook, Johnson, Cronin and Baron1997) and brain abnormalities including compromised white matter structural integrity (Williams et al., Reference Williams, Leritz, Shepel, McGlinchey, Milberg, Rudolph and Salat2013). In the current study, time-averaged LDL-C was not associated with high AWMV or decreased GM-CBFV. Previous research examining the association of LDL-C levels with brain structure and perfusion has been limited, with reports of both no association and an association between lower LDL-C and worse white matter microstructural integrity (Debette et al., Reference Debette, Seshadri, Beiser, Au, Himali, Palumbo and DeCarli2011; Power et al., Reference Power, Tingle, Reid, Huang, Sharrett, Coresh and Mosley2017). In the Memory in Diabetes extension of the Action to Control Cardiovascular Risk in Diabetes randomized trial (n = 236), intensive LDL-C lowering versus placebo was not associated with total brain volume (Williamson et al., Reference Williamson, Launer, Bryan, Coker, Lazar and Gerstein2014). Additionally, a study of neural correlates and modifiers of cognitive aging reported LDL-C was not associated with white matter hyperintensity among adults aged 44–77 years (Raz, Yang, Dahle, & Land, Reference Raz, Yang, Dahle and Land2012). White matter hyperintensities in the brain and lower levels of cerebral blood flow have been associated with lower cognitive function (Appelman et al., Reference Appelman, van der Graaf, Vincken, Mali and Geerlings2010; Gunning-Dixon & Raz, Reference Gunning-Dixon and Raz2000; Moser et al., Reference Moser, Boles Ponto, Miller, Schultz, Menda, Arndt and Nopoulos2012), and may be early indicators of decline in cognitive performance.
Strengths of the current study include using a contemporary prospective cohort of middle-aged adults with 25 years of follow-up. Serial measurements of lipid levels at up to eight study examinations allowed us to examine the cumulative exposure of LDL-C across the life course. There are potential limitations to note as well. Cognitive function scores were assessed cross-sectionally at Year 25 and we were unable to assess longitudinal changes in cognition from baseline. As the CARDIA study enrolled young adults at baseline, the population at 25 years post-baseline may still be too young to detect measurable differences in cognition. Although the majority of participants from the Year 25 exam were included in the primary analysis, there were differences with respect to race, education, and current smoking status for those included and excluded, which may have impacted our overall results. Additionally, measures of AWMV and GM-CBFV were only available among CARDIA participants in a sub-study at the Year 25 examination, and these measurements were not available at baseline. The time-averaged LDL-C measure reflected long-term LDL levels only, and not LDL-C variability specifically. Therefore, this may have limited our ability to detect associations between time-averaged categories, although variability in LDL-C levels was present within all categories and not specific to higher or lower time-averaged LDL-C. While we included several covariates of interest in the fully adjusted models, approximately 30% of the variability in the associations between LDL-C and cognitive function was explained by these variables and residual and unmeasured confounding remain a possibility. Finally, PCSK9 genotyping and ApoE phenotypes were only measured in subsamples of CARDIA participants, and this may have limited the statistical power to detect differences across categories of time-averaged LDL-C. Given the smaller sample size available to test effect modification by PCSK9 variants and ApoE phenotypes, we interpret these results cautiously.
In conclusion, mean differences in cognitive function test scores across time-averaged LDL-C categories were small among middle-aged black and white US adults. We provide evidence that higher long-term levels of LDL-C were associated with slightly worse memory performance but not other cognitive measures over 25 years of follow-up from young adulthood to middle age.
SUPPLEMENTARY MATERIAL
To view supplementary material for this article, please visit https://doi.org/10.1017/S1355617721000059
ACKNOWLEDGMENTS
The authors would also like to thank Feng Lin from the University of California at San Francisco for the development of the code for time-averaged cholesterol.
CONFLICT OF INTEREST
MM and LC report no disclosures. CEL receives research support from grant HHSN26820130026C. PM receives research support from Amgen, Inc. SS and LJL report no disclosures. KLM, AR, and HK are employed by Amgen, Inc. RSR receives research grant support from Akcea, Amgen, Medicines Company, and Sanofi; he receives honoraria from Akcea, Kowa, and Pfizer; he has ownership in MediMergent; he receives consultant fees from Akcea, Amgen, Regeneron, and Sanofi; he receives other support from UpToDate. APC receives research support from Amgen, Inc.
FUNDING
The Coronary Artery Risk Development in Young Adults Study (CARDIA) is conducted and supported by the National Heart, Lung, and Blood Institute (NHLBI) in collaboration with the University of Alabama at Birmingham (HHSN268201800005I & HHSN268201800007I), Northwestern University (HHSN268201800003I), University of Minnesota (HHSN268201800006I), and Kaiser Foundation Research Institute (HHSN268201800004I). This manuscript has been reviewed by CARDIA for the scientific content. CARDIA was also partially supported by the Intramural Research Program of the National Institute on Aging (NIA) and an intra-agency agreement between NIA and NHLBI (AG0005). The current secondary data analysis was funded by an academic/industry collaboration between the University of Alabama at Birmingham, Mount Sinai School of Medicine, and Amgen, Inc.


 Open access